Grundlæggende statistik
| Institutionelle aktier (lange) | 7.668.665 - 59,07% (ex 13D/G) - change of -0,29MM shares -3,64% MRQ |
| Institutionel værdi (lang) | $ 294.371 USD ($1000) |
Institutionelt ejerskab og aktionærer
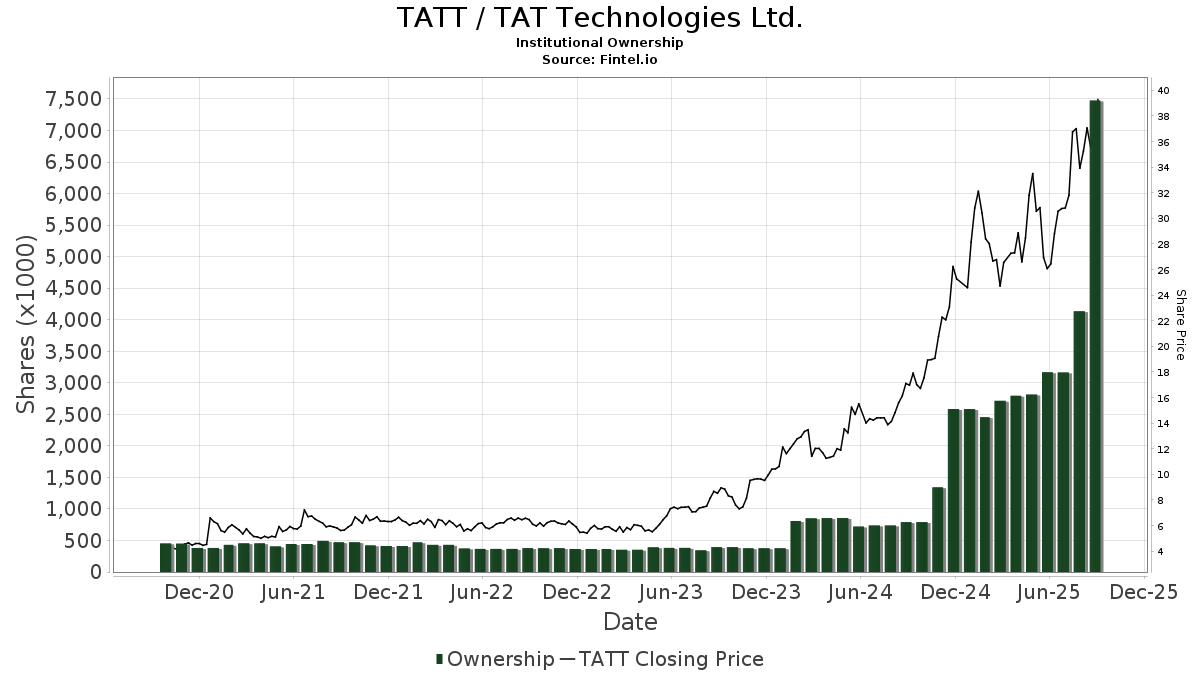
TAT Technologies Ltd. (US:TATT) har 102 institutionelle ejere og aktionærer, der har indsendt 13D/G- eller 13F-formularer til Securities Exchange Commission (SEC). Disse institutioner har i alt 7,668,665 aktier. Største aktionærer omfatter Meitav Dash Investments Ltd, Y.D. More Investments Ltd, Wasatch Advisors Inc, Migdal Insurance & Financial Holdings Ltd., Clal Insurance Enterprises Holdings Ltd, Penn Capital Management Co Inc, Driehaus Capital Management Llc, Russell Investments Group, Ltd., Phoenix Holdings Ltd., and New York State Common Retirement Fund .
TAT Technologies Ltd. (NasdaqGM:TATT) institutionel ejerskabsstruktur viser aktuelle positioner i virksomheden efter institutioner og fonde, samt seneste ændringer i positionsstørrelse. Større aktionærer kan omfatte individuelle investorer, investeringsforeninger, hedgefonde eller institutioner. Skema 13D angiver, at investoren besidder (eller besidder) mere end 5 % af virksomheden og har til hensigt (eller har til hensigt at) aktivt at forfølge en ændring i forretningsstrategi. Skema 13G indikerer en passiv investering på over 5%.
The share price as of March 20, 2026 is 43,01 / share. Previously, on March 24, 2025, the share price was 25,08 / share. This represents an increase of 71,49% over that period.
Fondens stemningsscore
Fund Sentiment Score (fka Ownership Accumulation Score) finder de aktier, der bliver mest købt af fonde. Det er resultatet af en sofistikeret, multi-faktor kvantitativ model, der identificerer virksomheder med de højeste niveauer af institutionel akkumulering. Scoringsmodellen bruger en kombination af den samlede stigning i oplyste ejere, ændringerne i porteføljeallokeringer i disse ejere og andre målinger. Tallet går fra 0 til 100, hvor højere tal indikerer et højere niveau af akkumulering for sine jævnaldrende, og 50 er gennemsnittet.
Opdateringsfrekvens: Dagligt
Se Ownership Explorer, som giver en liste over højest rangerende virksomheder.
AI+ Ask Fintel’s AI assistant about TAT Technologies Ltd..
Select a question to share a public post with an AI-crafted answer.
Thinking of good questions…
Institutionel Put/Call-forhold
Ud over at indberette standardaktie- og gældsudstedelser skal institutter med mere end 100 mill. aktiver under forvaltning også oplyse deres put- og call-optionsbeholdninger. Da salgsoptioner generelt indikerer negativ stemning, og købsoptioner indikerer positiv stemning, kan vi få en fornemmelse af den overordnede institutionelle stemning ved at plotte forholdet mellem put og kald. Diagrammet til højre viser det historiske put/call-forhold for dette instrument.
Brug af Put/Call Ratio som en indikator for investorernes stemning overvinder en af de vigtigste mangler ved at bruge totalt institutionelt ejerskab, som er, at en betydelig mængde af aktiver under forvaltning investeres passivt for at spore indekser. Passivt forvaltede fonde køber typisk ikke optioner, så indikatoren for put/call-forholdet følger mere nøje følelsen af aktivt forvaltede fonde.
13D/G-arkivering
Vi præsenterer 13D/G ansøgninger separat fra 13F ansøgninger på grund af den forskellige behandling af SEC. 13D/G-ansøgninger kan indgives af grupper af investorer (med én ledende), hvorimod 13F-ansøgninger ikke kan. Dette resulterer i situationer, hvor en investor kan indsende en 13D/G, der rapporterer én værdi for de samlede aktier (der repræsenterer alle de aktier, der ejes af investorgruppen), men derefter indsender en 13F, der rapporterer en anden værdi for de samlede aktier (der udelukkende repræsenterer deres egne) ejendomsret). Det betyder, at aktieejerskab af 13D/G-arkiver og 13F-arkiveringer ofte ikke er direkte sammenlignelige, så vi præsenterer dem separat.
Bemærk: Fra den 16. maj 2021 viser vi ikke længere ejere, der ikke har indsendt en 13D/G inden for det seneste år. Tidligere viste vi den fulde historie af 13D/G-arkiver. Generelt skal enheder, der er forpligtet til at indgive 13D/G-ansøgninger, indgive mindst årligt, før de indsender en afsluttende ansøgning. Dog forlader fonde nogle gange positioner uden at indsende en afsluttende ansøgning (dvs. de afvikler), så visning af den fulde historie resulterede nogle gange i forvirring om det nuværende ejerskab. For at undgå forvirring viser vi nu kun 'aktuelle' ejere - det vil sige - ejere, der har anmeldt inden for det seneste år.
Upgrade to unlock premium data.
| Fil dato | Form | Investor | Forrige Aktier |
Seneste Aktier |
Δ Aktier (Procent) |
Ejendomsret (Procent) |
Δ Ejerskab (Procent) |
|
|---|---|---|---|---|---|---|---|---|
| 2026-02-17 | Migdal Insurance & Financial Holdings Ltd. | 678,353 | 5.13 | |||||
| 2026-01-22 | MEITAV DASH INVESTMENTS LTD | 1,994,769 | 1,915,885 | -3.95 | 14.85 | -3.95 | ||
| 2026-01-08 | Y.D. More Investments Ltd | 1,014,777 | 900,147 | -11.30 | 6.98 | -11.65 | ||
| 2026-01-06 | Phoenix Holdings Ltd. | 1,219,933 | 949,437 | -22.17 | 7.33 | -23.08 | ||
| 2025-08-14 | WASATCH ADVISORS INC | 781,216 | 6.10 | |||||
| 2025-06-03 | DAVIDI ISHAY | 2,905,202 | 380,202 | -86.91 | 3.00 | -88.81 |
13F og NPORT arkivering
Detaljer om 13F-arkivering er gratis. Detaljer om NP-ansøgninger kræver et premium-medlemskab. Grønne rækker angiver nye positioner. Røde rækker angiver lukkede positioner. Klik på linket ikon for at se den fulde transaktionshistorik.
Opgrader
for at låse premium-data op og eksportere til Excel ![]() .
.
| Fil dato | Kilde | Investor | Type | Gennemsnitlig pris (Øst) |
Aktier | Δ Aktier (%) |
Rapporteret Værdi ($1000) |
Δ Værdi (%) |
Port Alloc (%) |
|
|---|---|---|---|---|---|---|---|---|---|---|
| 2025-09-25 | NP | DFAI - Dimensional International Core Equity Market ETF | 2.855 | 0,00 | 104 | 32,05 | ||||
| 2026-01-14 | 13F | Hennion & Walsh Asset Management, Inc. | 77.134 | 60,03 | 3.445 | 62,30 | ||||
| 2026-02-18 | 13F | GWM Advisors LLC | 0 | -100,00 | 0 | |||||
| 2026-01-29 | 13F | UBS Group AG | 28.755 | 110,71 | 1.284 | 114,00 | ||||
| 2026-02-13 | 13F | Morgan Dempsey Capital Management Llc | 8.505 | 0,00 | 380 | 2,43 | ||||
| 2026-02-17 | 13F | G2 Investment Partners Management LLC | 10.000 | -79,47 | 447 | -79,20 | ||||
| 2025-11-12 | 13F | Monashee Investment Management LLC | 0 | -100,00 | 0 | -100,00 | ||||
| 2026-01-28 | 13F | Migdal Insurance & Financial Holdings Ltd. | 386.996 | 92,13 | 17 | 112,50 | ||||
| 2026-02-06 | 13F | GPS Wealth Strategies Group, LLC | 100 | 4 | ||||||
| 2025-09-26 | NP | PCSGX - PACE Small/Medium Co Growth Equity Investments Class P | 8.810 | 304 | ||||||
| 2026-02-17 | 13F | Citadel Advisors Llc | 89.210 | 535,99 | 3.984 | 545,71 | ||||
| 2025-11-14 | 13F | Walleye Capital LLC | 0 | -100,00 | 0 | -100,00 | ||||
| 2026-02-13 | 13F | Next Century Growth Investors Llc | 132.154 | 5.902 | ||||||
| 2025-11-13 | 13F | MYDA Advisors LLC | 0 | -100,00 | 0 | -100,00 | ||||
| 2026-01-30 | 13F | North Star Investment Management Corp. | 0 | -100,00 | 0 | |||||
| 2026-02-05 | 13F | Cambridge Investment Research Advisors, Inc. | 36.828 | 652,51 | 2 | |||||
| 2025-09-23 | NP | IZRL - ARK Israel Innovative Technology ETF | 63.944 | 6,92 | 2.315 | 40,73 | ||||
| 2026-02-13 | 13F | Centiva Capital, LP | 0 | -100,00 | 0 | |||||
| 2025-11-14 | 13F | Two Sigma Advisers, Lp | 0 | -100,00 | 0 | -100,00 | ||||
| 2026-02-11 | 13F | MCF Advisors LLC | 169 | 8 | ||||||
| 2026-02-13 | 13F | Marshall Wace, Llp | 0 | -100,00 | 0 | |||||
| 2026-02-13 | 13F | Clal Insurance Enterprises Holdings Ltd | 360.884 | 0,00 | 16 | 6,67 | ||||
| 2026-02-14 | 13F | Rockefeller Capital Management L.P. | 39 | 2 | ||||||
| 2026-02-17 | 13F | Raymond James Financial Inc | 0 | -100,00 | 0 | |||||
| 2026-02-17 | 13F | Advisory Services Network, LLC | 0 | -100,00 | 0 | |||||
| 2026-02-12 | 13F | Jane Street Group, Llc | 43.559 | 97,50 | 1.945 | 100,31 | ||||
| 2026-02-17 | 13F | Qube Research & Technologies Ltd | 12.276 | 548 | ||||||
| 2025-09-29 | NP | CFSSX - Column Small Cap Select Fund | 84.632 | 3.085 | ||||||
| 2026-02-13 | 13F | Arrowstreet Capital, Limited Partnership | 5.430 | -90,52 | 244 | -89,57 | ||||
| 2026-02-17 | 13F | Driehaus Capital Management Llc | 323.773 | 5,19 | 14.460 | 6,69 | ||||
| 2025-09-25 | NP | DFIS - Dimensional International Small Cap ETF | 5.897 | -44,07 | 214 | -26,55 | ||||
| 2026-02-17 | 13F | Jones Financial Companies Lllp | 137 | 0,00 | 6 | 20,00 | ||||
| 2025-11-13 | 13F | Jump Financial, LLC | 0 | -100,00 | 0 | -100,00 | ||||
| 2026-02-10 | 13F | Meitav Dash Investments Ltd | 1.208.738 | -9,40 | 54.221 | -2,87 | ||||
| 2026-02-17 | 13F | Advisor Group Holdings, Inc. | 9.661 | 38,29 | 431 | 67,05 | ||||
| 2026-02-17 | 13F | Quadrature Capital Ltd | 14.116 | 630 | ||||||
| 2026-01-23 | 13F | Oak Ridge Investments Llc | 25.983 | 1.160 | ||||||
| 2025-11-13 | 13F | Winton Capital Group Ltd | 0 | -100,00 | 0 | -100,00 | ||||
| 2026-02-17 | 13F | First Manhattan Co | 4.900 | 0,00 | 219 | 1,40 | ||||
| 2026-03-03 | 13F/A | Caitong International Asset Management Co., Ltd | 190 | 8 | ||||||
| 2025-09-25 | NP | DFAX - Dimensional World ex U.S. Core Equity 2 ETF | 1.891 | 0,00 | 69 | 30,77 | ||||
| 2026-02-13 | 13F | Sei Investments Co | 20.567 | 919 | ||||||
| 2026-02-09 | 13F | Geode Capital Management, Llc | 5.856 | 0,00 | 262 | 1,56 | ||||
| 2026-02-12 | 13F | Renaissance Technologies Llc | 177.002 | -10,97 | 7.905 | -9,70 | ||||
| 2026-02-17 | 13F | Credit Agricole S A | 21.564 | -13,74 | 963 | -12,45 | ||||
| 2026-02-13 | 13F | Virtus ETF Advisers LLC | 6.859 | 0,00 | 306 | 1,32 | ||||
| 2025-10-24 | 13F | Valmark Advisers, Inc. | 0 | -100,00 | 0 | -100,00 | ||||
| 2026-02-10 | 13F | Catalyst Capital Advisors LLC | 900 | 0,00 | 40 | 2,56 | ||||
| 2025-11-14 | 13F | Alta Fox Capital Management, Llc | 0 | -100,00 | 0 | -100,00 | ||||
| 2026-02-11 | 13F | Provident Co of the Employees of the Hebrew University LTD | 19.900 | 889 | ||||||
| 2026-02-17 | 13F | Monimus Capital Management, Lp | 14.156 | 632 | ||||||
| 2025-09-25 | NP | Dfa Investment Dimensions Group Inc - Va International Small Portfolio This fund is a listed as child fund of Dimensional Fund Advisors Lp and if that institution has disclosed ownership in this security, then these positions will not be double counted when calculating total shares and total value | 738 | 0,00 | 27 | 30,00 | ||||
| 2025-11-14 | 13F | ExodusPoint Capital Management, LP | 0 | -100,00 | 0 | |||||
| 2026-02-13 | 13F | Quarry LP | 23 | -68,06 | 1 | -66,67 | ||||
| 2026-02-02 | 13F | Kornitzer Capital Management Inc /ks | 40.171 | 0,43 | 1.794 | 1,87 | ||||
| 2026-02-10 | 13F | Bnp Paribas Arbitrage, Sa | 0 | -100,00 | 0 | |||||
| 2026-02-11 | 13F | Jpmorgan Chase & Co | 10.049 | -64,69 | 449 | -64,25 | ||||
| 2026-02-13 | 13F | Barclays Plc | 175 | 0,00 | 8 | 0,00 | ||||
| 2025-09-25 | NP | DFIEX - International Core Equity Portfolio - Institutional Class This fund is a listed as child fund of Dimensional Fund Advisors Lp and if that institution has disclosed ownership in this security, then these positions will not be double counted when calculating total shares and total value | 7.244 | 0,00 | 261 | 30,65 | ||||
| 2026-02-13 | 13F | Lord, Abbett & Co. Llc | 208.443 | -2,65 | 9 | 0,00 | ||||
| 2026-02-11 | 13F | LPL Financial LLC | 4.667 | -0,02 | 208 | 1,46 | ||||
| 2025-11-14 | 13F | Cubist Systematic Strategies, LLC | 0 | -100,00 | 0 | -100,00 | ||||
| 2026-02-06 | 13F | IFP Advisors, Inc | 977 | -49,72 | 44 | -49,41 | ||||
| 2026-02-09 | 13F | Penn Capital Management Co Inc | 353.577 | -1,17 | 15.807 | 0,24 | ||||
| 2026-02-17 | 13F | Russell Investments Group, Ltd. | 258.153 | 71,19 | 11.529 | 73,66 | ||||
| 2026-02-06 | 13F | Pnc Financial Services Group, Inc. | 1.200 | 0,00 | 54 | 1,92 | ||||
| 2026-02-09 | 13F | Roubaix Capital, LLC | 0 | -100,00 | 0 | |||||
| 2026-02-13 | 13F | Y-Intercept (Hong Kong) Ltd | 11.019 | 47,39 | 492 | 49,54 | ||||
| 2026-02-17 | 13F | Trexquant Investment LP | 13.258 | -67,41 | 592 | -66,95 | ||||
| 2026-02-12 | 13F | Wasatch Advisors Inc | 710.764 | -13,77 | 31.743 | -12,53 | ||||
| 2026-02-17 | 13F | Bank Of America Corp /de/ | 31.028 | 23,55 | 1.386 | 25,34 | ||||
| 2026-02-11 | 13F | Janney Montgomery Scott LLC | 0 | -100,00 | 0 | |||||
| 2026-02-17 | 13F | Millennium Management Llc | 45.536 | 2.034 | ||||||
| 2026-02-13 | 13F | Diametric Capital, LP | 11.958 | 105,64 | 534 | 108,59 | ||||
| 2025-09-25 | NP | DFA INVESTMENT DIMENSIONS GROUP INC - International Sustainability Core 1 Portfolio Shares | 916 | 0,00 | 33 | 28,00 | ||||
| 2025-09-26 | NP | RMYAX - Multi-Strategy Income Fund Class A | 5.196 | 179 | ||||||
| 2026-02-17 | 13F | Two Sigma Investments, Lp | 27.727 | -38,42 | 1.238 | -37,54 | ||||
| 2025-11-05 | 13F | Anthracite Investment Company, Inc. | 0 | -100,00 | 0 | -100,00 | ||||
| 2025-09-29 | NP | LAMGX - Lord Abbett Micro-Cap Growth Fund Class A | 77.977 | 2.687 | ||||||
| 2026-02-11 | 13F | Gwn Securities Inc. | 0 | -100,00 | 0 | |||||
| 2026-02-11 | 13F | CenterBook Partners LP | 105.481 | 4.711 | ||||||
| 2026-02-03 | 13F | SBI Securities Co., Ltd. | 517 | -30,23 | 23 | -28,12 | ||||
| 2026-02-13 | 13F | Boston Partners | 223.498 | 38,83 | 9.984 | 40,86 | ||||
| 2025-09-25 | NP | DFA INVESTMENT DIMENSIONS GROUP INC - International Vector Equity Portfolio Shares | 1.157 | 0,00 | 42 | 32,26 | ||||
| 2026-01-29 | 13F | Huntleigh Advisors, Inc. | 40.166 | 5,42 | 1.794 | 6,92 | ||||
| 2026-02-03 | 13F | Navellier & Associates Inc | 12.010 | -53,22 | 536 | -52,57 | ||||
| 2026-02-05 | 13F | Phoenix Holdings Ltd. | 248.906 | -32,07 | 11.116 | -31,09 | ||||
| 2026-02-17 | 13F | Point72 Asset Management, L.P. | 8.612 | 385 | ||||||
| 2026-02-17 | 13F | Silvercrest Asset Management Group Llc | 139.373 | 6.224 | ||||||
| 2026-01-16 | 13F | Ellsworth Advisors, LLC | 26.489 | -2,04 | 1.366 | 19,63 | ||||
| 2026-02-17 | 13F | Boothbay Fund Management, Llc | 0 | -100,00 | 0 | |||||
| 2025-11-12 | 13F | Stifel Financial Corp | 0 | -100,00 | 0 | -100,00 | ||||
| 2026-02-17 | 13F | Apis Capital Advisors, LLC | 126.496 | 10,00 | 5.649 | 11,57 | ||||
| 2026-02-09 | 13F | Harbour Investments, Inc. | 195 | 0,00 | 9 | 0,00 | ||||
| 2025-09-25 | NP | DFA INVESTMENT DIMENSIONS GROUP INC - World ex U.S. Core Equity Portfolio Institutional Class Shares | 930 | 0,00 | 33 | 32,00 | ||||
| 2025-09-24 | NP | DASVX - Dunham Small Cap Value Fund Class A | 8.663 | 299 | ||||||
| 2026-02-17 | 13F | Fred Alger Management, Llc | 11.640 | 12,36 | 520 | 13,82 | ||||
| 2026-02-17 | 13F | PDT Partners, LLC | 7.454 | 0,00 | 333 | 1,22 | ||||
| 2026-02-13 | 13F | Wells Fargo & Company/mn | 681 | 9,66 | 30 | 11,11 | ||||
| 2026-02-13 | 13F | Toroso Investments, LLC | 14.070 | 11,76 | 628 | 13,36 | ||||
| 2026-02-13 | 13F | Morgan Stanley | 41.009 | -24,00 | 1.831 | -22,91 | ||||
| 2026-01-21 | 13F | Y.D. More Investments Ltd | 900.147 | -5,32 | 40.385 | 2,39 | ||||
| 2026-02-13 | 13F | Greenline Wealth Management LLC | 912 | 41 | ||||||
| 2026-01-20 | 13F | Signaturefd, Llc | 0 | -100,00 | 0 | |||||
| 2026-02-12 | 13F | Hrt Financial Lp | 5.269 | -30,51 | 0 | |||||
| 2026-01-23 | 13F | Tower View Investment Management & Research LLC | 35.102 | 1.568 | ||||||
| 2025-09-29 | NP | CTSIX - Calamos Timpani Small Cap Growth Fund Class I | 77.089 | 2.657 | ||||||
| 2026-01-29 | 13F | Calamos Advisors LLC | 94.695 | 288,89 | 4.229 | 294,50 | ||||
| 2026-02-17 | 13F | Royal Bank Of Canada | 1.122 | 978,85 | 50 | 900,00 | ||||
| 2026-02-13 | 13F | Formula Growth Ltd | 30.801 | 0,00 | 1.376 | 1,40 | ||||
| 2026-02-19 | 13F/A | Axxcess Wealth Management, Llc | 5.100 | 0,00 | 228 | 1,34 | ||||
| 2026-02-19 | 13F | CI Private Wealth, LLC | 4.750 | 0,00 | 212 | 1,44 | ||||
| 2026-02-02 | 13F | Principal Financial Group Inc | 11.127 | -71,87 | 497 | -71,51 | ||||
| 2026-02-10 | 13F | Goldman Sachs Group Inc | 29.249 | -20,68 | 1.306 | -19,53 | ||||
| 2026-02-12 | 13F | New York State Common Retirement Fund | 230.525 | 0,00 | 10.295 | 1,43 | ||||
| 2026-02-13 | 13F | Citigroup Inc | 25.789 | -19,83 | 1.152 | -18,71 | ||||
| 2026-02-04 | 13F | Colonial River Wealth Management, LLC | 5.100 | 0,00 | 228 | 1,34 | ||||
| 2025-09-26 | NP | RAZAX - Multi-Asset Growth Strategy Fund Class A | 11.864 | 409 | ||||||
| 2025-09-25 | NP | DFIC - Dimensional International Core Equity 2 ETF | 2.744 | 0,00 | 99 | 32,00 | ||||
| 2025-11-12 | 13F | BlackRock, Inc. | 0 | -100,00 | 0 | -100,00 | ||||
| 2026-01-14 | 13F | Legal Advantage Investments, Inc. | 12.000 | -2,44 | 536 | -1,11 | ||||
| 2026-02-06 | 13F | Gsa Capital Partners Llp | 13.834 | 16,70 | 1 | |||||
| 2026-02-11 | 13F | ARK Investment Management LLC | 50.488 | -19,61 | 2.269 | -11,27 | ||||
| 2026-02-10 | 13F | Quantbot Technologies LP | 1.130 | -58,76 | 50 | -58,33 | ||||
| 2026-02-03 | 13F | K.J. Harrison & Partners Inc | 51.143 | -26,94 | 2.284 | -24,67 | ||||
| 2025-09-26 | NP | REBYX - U.S. Small Cap Equity Fund Class Y | 16.172 | 557 |