Grundlæggende statistik
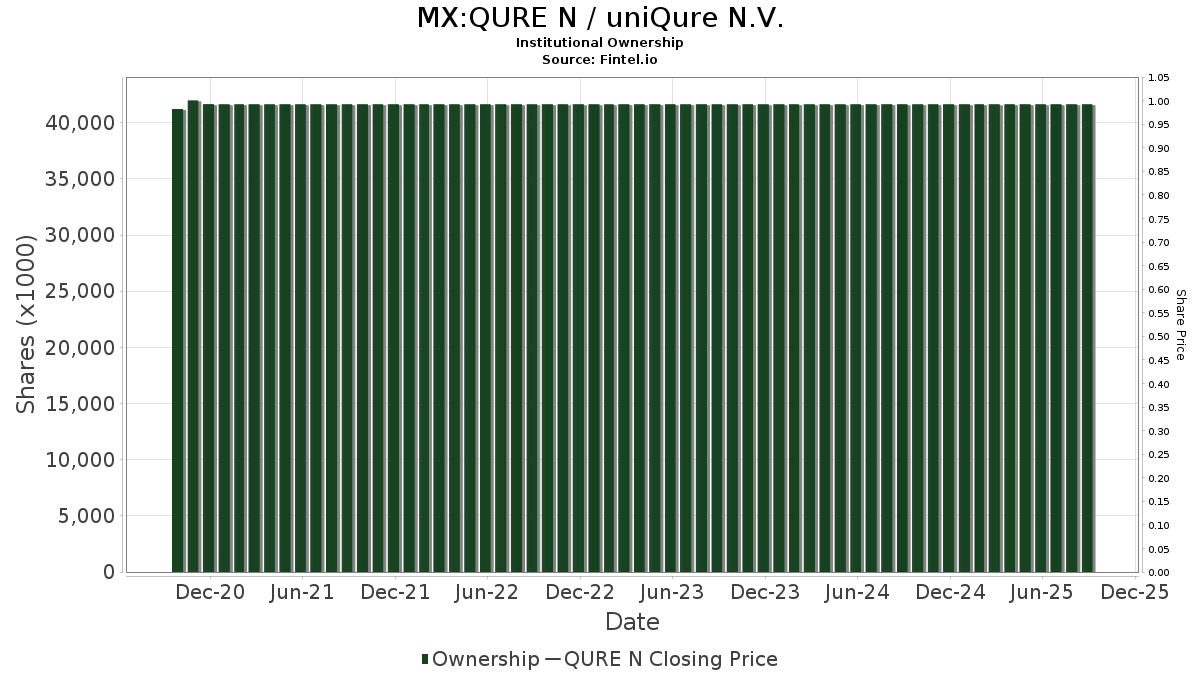
| Institutionelle aktier (lange) | 61.123.995 - 137,37% (ex 13D/G) - change of -0,11MM shares -0,25% MRQ |
| Institutionel værdi (lang) | $ 1.434.364 USD ($1000) |
Institutionelt ejerskab og aktionærer
uniQure N.V. (MX:QURE N) har 241 institutionelle ejere og aktionærer, der har indsendt 13D/G- eller 13F-formularer til Securities Exchange Commission (SEC). Disse institutioner har i alt 61,123,995 aktier. Største aktionærer omfatter Fmr Llc, Avoro Capital Advisors LLC, Rtw Investments, Lp, Standard Life Aberdeen plc, State Street Corp, Jpmorgan Chase & Co, Susquehanna International Group, Llp, BlackRock, Inc., Two Sigma Investments, Lp, and MPM Oncology Impact Management LP .
uniQure N.V. (BMV:QURE N) institutionel ejerskabsstruktur viser aktuelle positioner i virksomheden efter institutioner og fonde, samt seneste ændringer i positionsstørrelse. Større aktionærer kan omfatte individuelle investorer, investeringsforeninger, hedgefonde eller institutioner. Skema 13D angiver, at investoren besidder (eller besidder) mere end 5 % af virksomheden og har til hensigt (eller har til hensigt at) aktivt at forfølge en ændring i forretningsstrategi. Skema 13G indikerer en passiv investering på over 5%.
Fondens stemningsscore
Fund Sentiment Score (fka Ownership Accumulation Score) finder de aktier, der bliver mest købt af fonde. Det er resultatet af en sofistikeret, multi-faktor kvantitativ model, der identificerer virksomheder med de højeste niveauer af institutionel akkumulering. Scoringsmodellen bruger en kombination af den samlede stigning i oplyste ejere, ændringerne i porteføljeallokeringer i disse ejere og andre målinger. Tallet går fra 0 til 100, hvor højere tal indikerer et højere niveau af akkumulering for sine jævnaldrende, og 50 er gennemsnittet.
Opdateringsfrekvens: Dagligt
Se Ownership Explorer, som giver en liste over højest rangerende virksomheder.
AI+ Ask Fintel’s AI assistant about uniQure N.V..
Select a question to share a public post with an AI-crafted answer.
Thinking of good questions…
13F og NPORT arkivering
Detaljer om 13F-arkivering er gratis. Detaljer om NP-ansøgninger kræver et premium-medlemskab. Grønne rækker angiver nye positioner. Røde rækker angiver lukkede positioner. Klik på linket ikon for at se den fulde transaktionshistorik.
Opgrader
for at låse premium-data op og eksportere til Excel ![]() .
.
| Fil dato | Kilde | Investor | Type | Gennemsnitlig pris (Øst) |
Aktier | Δ Aktier (%) |
Rapporteret Værdi ($1000) |
Δ Værdi (%) |
Port Alloc (%) |
|
|---|---|---|---|---|---|---|---|---|---|---|
| 2026-02-12 | 13F | Quadrant Capital Group Llc | 187 | 0,00 | 4 | -60,00 | ||||
| 2026-02-13 | 13F | Eventide Asset Management, Llc | 498.212 | 11.922 | ||||||
| 2026-02-17 | 13F | Resolute Capital Asset Partners LLC | 0 | -100,00 | 0 | -100,00 | ||||
| 2026-02-17 | 13F | Freestone Grove Partners LP | 12.984 | 311 | ||||||
| 2026-02-17 | 13F | Boxer Capital Management, LLC | 290.000 | -63,75 | 6.940 | -85,14 | ||||
| 2025-11-14 | 13F | Point72 Europe (London) LLP | 1.552 | 91 | ||||||
| 2026-02-17 | 13F | Point72 Asset Management, L.P. | 24.439 | -90,38 | 585 | -96,06 | ||||
| 2026-02-12 | 13F | Rosalind Advisors, Inc. | 0 | -100,00 | 0 | -100,00 | ||||
| 2026-02-12 | 13F | Commonwealth Equity Services, Llc | 0 | -100,00 | 0 | |||||
| 2026-02-10 | 13F | Bank of New York Mellon Corp | 43.309 | 94,99 | 1.036 | -20,06 | ||||
| 2026-02-17 | 13F | J. Goldman & Co LP | Call | 20.300 | -69,93 | 486 | -87,69 | |||
| 2026-02-17 | 13F | Ameriprise Financial Inc | 70.796 | -55,46 | 1.694 | -81,74 | ||||
| 2026-02-12 | 13F | Rosalind Advisors, Inc. | Call | 100.000 | 95 | |||||
| 2026-02-12 | 13F | Aristides Capital LLC | 0 | -100,00 | 0 | |||||
| 2026-04-15 | 13F | Gf Fund Management Co. Ltd. | 1.389 | 13,57 | 23 | -24,14 | ||||
| 2026-02-13 | 13F | Centiva Capital, LP | Put | 0 | -100,00 | 0 | -100,00 | |||
| 2026-02-09 | 13F | Sectoral Asset Management Inc | 30.585 | -0,50 | 732 | -59,25 | ||||
| 2026-02-12 | 13F | Hrt Financial Lp | 156.000 | 4 | ||||||
| 2026-02-12 | 13F | Senvest Management, LLC | 50.000 | 1.196 | ||||||
| 2026-02-17 | 13F | Capital Fund Management S.a. | 82.978 | 1.986 | ||||||
| 2026-02-17 | 13F | Massar Capital Management, LP | 40.529 | 102,64 | 970 | -16,97 | ||||
| 2026-02-13 | 13F | Quinn Opportunity Partners LLC | 10.000 | -90,71 | 239 | -96,19 | ||||
| 2026-01-29 | 13F | Vanguard Group Inc | 1.051.379 | -6,55 | 25.160 | -61,69 | ||||
| 2026-01-30 | 13F | Jennison Associates Llc | 1.371.190 | 37,19 | 32.813 | -43,76 | ||||
| 2026-02-11 | 13F | Jpmorgan Chase & Co | 2.934.626 | 155,33 | 70.226 | 4,68 | ||||
| 2026-02-11 | 13F | Winton Capital Group Ltd | 48.185 | 17,59 | 1.153 | -51,78 | ||||
| 2026-04-06 | 13F | Versant Capital Management, Inc | 85 | 0,00 | 1 | -50,00 | ||||
| 2026-02-17 | 13F | Atom Investors LP | 78.209 | 65,38 | 1.872 | -32,21 | ||||
| 2026-02-11 | 13F | Deutsche Bank Ag\ | 4.621 | 98,33 | 111 | -19,12 | ||||
| 2026-02-17 | 13F | J. Goldman & Co LP | 20.250 | 485 | ||||||
| 2026-02-17 | 13F | Advisor Group Holdings, Inc. | 587 | 428,83 | 14 | 133,33 | ||||
| 2026-02-13 | 13F | State Street Corp | 3.231.043 | 123,75 | 77.319 | -8,27 | ||||
| 2026-02-17 | 13F | Tudor Investment Corp Et Al | Call | 23.800 | 29,35 | 570 | -47,02 | |||
| 2026-02-17 | 13F | Farallon Capital Management Llc | 14.000 | -97,52 | 335 | -98,98 | ||||
| 2026-02-17 | 13F | Tudor Investment Corp Et Al | Put | 102.100 | 470,39 | 2.443 | 134,00 | |||
| 2026-02-17 | 13F | Superstring Capital Management Lp | 0 | -100,00 | 0 | |||||
| 2026-02-17 | 13F | Tudor Investment Corp Et Al | 74.036 | 157,81 | 1.772 | 5,67 | ||||
| 2026-04-09 | 13F | Sanders Morris Harris Llc | 19.356 | 316 | ||||||
| 2026-02-10 | 13F | Envestnet Asset Management Inc | 99.593 | 762,35 | 2.383 | 253,56 | ||||
| 2026-02-17 | 13F | Suvretta Capital Management, Llc | 1.216.734 | 29.116 | ||||||
| 2026-02-17 | 13F/A | Militia Capital Partners, LP | 8.500 | -75,71 | 203 | -90,06 | ||||
| 2026-01-23 | 13F | Assetmark, Inc | 18.613 | 445 | ||||||
| 2026-02-13 | 13F | Charles Schwab Investment Management Inc | 362.878 | 1,45 | 8.684 | -58,41 | ||||
| 2026-03-09 | 13F | Flax Pond Capital, Llc | 146.498 | 3.506 | ||||||
| 2026-03-12 | 13F/A | Peak6 Llc | Put | 7.000 | 168 | |||||
| 2026-01-27 | 13F | First Horizon Corp | 3 | -99,22 | 0 | -100,00 | ||||
| 2026-02-17 | 13F | Scientech Research LLC | 10.203 | -65,17 | 244 | -85,72 | ||||
| 2026-03-12 | 13F/A | Peak6 Llc | Call | 179.500 | 1.517,12 | 4.295 | 563,83 | |||
| 2026-01-30 | 13F | Torren Management, LLC | 1.169 | 28 | ||||||
| 2026-02-03 | 13F | SBI Securities Co., Ltd. | 280 | -75,40 | 7 | -90,91 | ||||
| 2025-11-14 | 13F | 683 Capital Management, LLC | Put | 0 | -100,00 | 0 | -100,00 | |||
| 2026-02-17 | 13F | Woodline Partners LP | 0 | -100,00 | 0 | |||||
| 2026-02-06 | 13F | Handelsbanken Fonder AB | 14.900 | 0 | ||||||
| 2026-02-17 | 13F | Northern Trust Corp | 168.820 | 10,75 | 4.040 | -54,60 | ||||
| 2025-11-14 | 13F | Diadema Partners Lp | Call | 0 | -100,00 | 0 | -100,00 | |||
| 2026-02-17 | 13F | Eversept Partners, LP | 62.820 | -92,84 | 1.503 | -97,07 | ||||
| 2026-02-13 | 13F | Y-Intercept (Hong Kong) Ltd | 45.778 | 101,63 | 1.095 | -17,36 | ||||
| 2025-11-13 | 13F | Pale Fire Capital SE | 0 | -100,00 | 0 | -100,00 | ||||
| 2026-01-14 | 13F | ORG Partners LLC | 114 | 3 | ||||||
| 2025-11-14 | 13F | Centiva Capital, LP | 0 | -100,00 | 0 | -100,00 | ||||
| 2026-02-17 | 13F | Clearline Capital LP | 83.681 | 2.002 | ||||||
| 2025-11-14 | 13F | Avidity Partners Management LP | 0 | -100,00 | 0 | |||||
| 2026-02-13 | 13F | Lord, Abbett & Co. Llc | 0 | -100,00 | 0 | |||||
| 2026-02-17 | 13F | Jones Financial Companies Lllp | 418 | -31,36 | 10 | -69,70 | ||||
| 2026-04-15 | 13F | FNY Investment Advisers, LLC | Call | 30 | 30,43 | 0 | ||||
| 2026-02-17 | 13F | StemPoint Capital LP | 43.485 | -91,67 | 1.041 | -96,59 | ||||
| 2026-02-13 | 13F | Umb Bank N A/mo | 200 | 0,00 | 5 | -63,64 | ||||
| 2026-02-13 | 13F | Macquarie Group Ltd | 0 | -100,00 | 0 | |||||
| 2026-02-17 | 13F | Rangeley Capital, LLC | 8.500 | 203 | ||||||
| 2026-02-17 | 13F | Diadema Partners Lp | 45.000 | 1.077 | ||||||
| 2026-02-17 | 13F | Engineers Gate Manager LP | 43.356 | 1.038 | ||||||
| 2026-02-17 | 13F | Diadema Partners Lp | Put | 301.800 | 0,60 | 7.222 | -58,76 | |||
| 2026-02-06 | 13F | Cullen/frost Bankers, Inc. | 34 | 1 | ||||||
| 2026-04-06 | 13F | GAMMA Investing LLC | 8 | 0,00 | 0 | |||||
| 2026-01-28 | 13F | Klp Kapitalforvaltning As | 8.400 | 0,00 | 201 | -58,98 | ||||
| 2026-02-06 | 13F | Eagle Health Investments LP | 205.247 | 4.912 | ||||||
| 2026-02-17 | 13F | Moore Capital Management, Lp | 75.000 | 1.795 | ||||||
| 2026-02-17 | 13F | Susquehanna International Group, Llp | Put | 498.800 | -43,57 | 11.936 | -76,87 | |||
| 2026-02-17 | 13F | Cinctive Capital Management LP | Call | 35.000 | 838 | |||||
| 2026-01-28 | 13F | Teacher Retirement System Of Texas | 0 | -100,00 | 0 | |||||
| 2026-02-13 | 13F | DLD Asset Management, LP | Put | 0 | -100,00 | 0 | -100,00 | |||
| 2026-02-17 | 13F | Susquehanna International Group, Llp | Call | 2.251.400 | 147,84 | 53.876 | 1,61 | |||
| 2026-02-17 | 13F | Orbimed Advisors Llc | 737.400 | 60,83 | 17.646 | -34,07 | ||||
| 2026-02-17 | 13F | Susquehanna International Group, Llp | 1.218.350 | 440,19 | 29.155 | 121,48 | ||||
| 2026-04-07 | 13F | Signaturefd, Llc | 206 | -17,27 | 3 | -40,00 | ||||
| 2026-02-05 | 13F | Requisite Capital Management, LLC | 0 | -100,00 | 0 | |||||
| 2026-02-17 | 13F | Lion Point Capital, LP | 14.700 | 352 | ||||||
| 2026-02-17 | 13F | Longaeva Partners L.P. | 0 | -100,00 | 0 | |||||
| 2026-04-15 | 13F | FNY Investment Advisers, LLC | 1.371 | -34,09 | 0 | |||||
| 2026-02-17 | 13F | Freshford Capital Management, LLC | 229.613 | 5.495 | ||||||
| 2026-04-17 | 13F | AdvisorNet Financial, Inc | 214 | 3 | ||||||
| 2026-02-17 | 13F | T. Rowe Price Investment Management, Inc. | 0 | -100,00 | 0 | |||||
| 2026-02-11 | 13F | Group One Trading, L.p. | Put | 110.700 | -76,10 | 2.649 | -90,20 | |||
| 2026-02-13 | 13F | MAI Capital Management | 28 | 154,55 | 1 | |||||
| 2026-02-11 | 13F | Group One Trading, L.p. | Call | 845.800 | 95,33 | 20.240 | -19,92 | |||
| 2026-02-09 | 13F | Huntington National Bank | 2 | 0,00 | 0 | |||||
| 2026-02-12 | 13F | Patient Square Capital LP | 0 | -100,00 | 0 | |||||
| 2026-02-12 | 13F | BlackRock, Inc. | 1.974.988 | 36,57 | 47.261 | -44,01 | ||||
| 2026-02-12 | 13F | Campbell & CO Investment Adviser LLC | 0 | -100,00 | 0 | |||||
| 2026-02-12 | 13F | CIBC Private Wealth Group, LLC | 850 | 0,00 | 20 | -59,18 | ||||
| 2026-02-13 | 13F | Stifel Financial Corp | 45.987 | -21,09 | 1.100 | -67,66 | ||||
| 2026-02-17 | 13F | Monimus Capital Management, Lp | 25.878 | 619 | ||||||
| 2026-02-13 | 13F | Walleye Trading LLC | 7.657 | -83,82 | 183 | -93,37 | ||||
| 2026-02-13 | 13F | JustInvest LLC | 12.356 | -0,67 | 296 | -59,37 | ||||
| 2026-02-13 | 13F | Walleye Trading LLC | Put | 18.200 | 1.416,67 | 436 | 521,43 | |||
| 2026-02-12 | 13F | BRYN MAWR TRUST Co | 0 | -100,00 | 0 | -100,00 | ||||
| 2026-02-13 | 13F | Walleye Trading LLC | Call | 23.900 | 1,27 | 572 | -58,53 | |||
| 2026-02-13 | 13F | Walleye Capital LLC | 78.996 | -23,24 | 1.890 | -68,53 | ||||
| 2026-02-13 | 13F | Walleye Capital LLC | Call | 33.600 | 18,31 | 804 | -51,48 | |||
| 2026-03-09 | 13F/A | CI Private Wealth, LLC | 0 | -100,00 | 0 | -100,00 | ||||
| 2025-11-14 | 13F | Susquehanna Fundamental Investments, Llc | 0 | -100,00 | 0 | -100,00 | ||||
| 2026-02-17 | 13F | Bellevue Group AG | 4.763 | 0,00 | 114 | -59,35 | ||||
| 2026-01-30 | 13F | Us Bancorp \de\ | 6.171 | 775,32 | 148 | 258,54 | ||||
| 2026-02-17 | 13F | Sig Brokerage, Lp | 0 | -100,00 | 0 | -100,00 | ||||
| 2026-02-17 | 13F | California State Teachers Retirement System | 35.947 | 14,81 | 860 | -52,93 | ||||
| 2026-02-10 | 13F | Lido Advisors, LLC | 5.544 | 0,00 | 324 | 0,00 | ||||
| 2025-11-14 | 13F | Cubist Systematic Strategies, LLC | 62.365 | 3.640 | ||||||
| 2026-02-17 | 13F | Janus Henderson Group Plc | 16.900 | -15,08 | 404 | -65,20 | ||||
| 2026-02-12 | 13F | Ensign Peak Advisors, Inc | 3.650 | 21,67 | 87 | -50,29 | ||||
| 2026-02-17 | 13F | Shay Capital LLC | 41.073 | 17,36 | 983 | -51,91 | ||||
| 2026-02-03 | 13F | Mitsubishi UFJ Kokusai Asset Management Co., Ltd. | 8.098 | -47,59 | 189 | -79,02 | ||||
| 2026-01-08 | 13F | Grove Bank & Trust | 0 | -100,00 | 0 | -100,00 | ||||
| 2026-02-13 | 13F | Walleye Capital LLC | Put | 29.300 | 1.231,82 | 701 | 447,66 | |||
| 2026-02-10 | 13F | Quantbot Technologies LP | 5.444 | 130 | ||||||
| 2026-02-11 | 13F | LPL Financial LLC | 21.969 | -52,36 | 526 | -80,49 | ||||
| 2026-02-13 | 13F | Squarepoint Ops LLC | 176.000 | -3,24 | 4.212 | -60,34 | ||||
| 2026-02-12 | 13F | Jane Street Group, Llc | Put | 36.500 | -92,78 | 873 | -97,04 | |||
| 2026-02-13 | 13F | DLD Asset Management, LP | Call | 10.000 | -83,44 | 239 | -93,22 | |||
| 2026-02-13 | 13F | Wells Fargo & Company/mn | 70.236 | 547,75 | 1.681 | 165,82 | ||||
| 2026-02-12 | 13F | Jane Street Group, Llc | Call | 354.400 | -44,50 | 8.481 | -77,25 | |||
| 2026-02-12 | 13F | Monashee Investment Management LLC | 0 | -100,00 | 0 | |||||
| 2026-01-14 | 13F | Hennion & Walsh Asset Management, Inc. | 67.739 | 31,24 | 1.621 | -46,22 | ||||
| 2025-11-14 | 13F | Main Management ETF Advisors, LLC | 0 | -100,00 | 0 | |||||
| 2026-02-17 | 13F | Owl Creek Asset Management, L.P. | 0 | -100,00 | 0 | -100,00 | ||||
| 2026-02-17 | 13F | Delaware Management Holdings, Inc. | 258.211 | 6.179 | ||||||
| 2026-02-13 | 13F | Greenline Wealth Management LLC | 52 | 1 | ||||||
| 2025-11-14 | 13F | Goldman Sachs Group Inc | Call | 0 | -100,00 | 0 | -100,00 | |||
| 2026-02-17 | 13F | Ancora Advisors, LLC | 0 | -100,00 | 0 | |||||
| 2026-01-29 | 13F | Comerica Bank | 637 | 56,51 | 15 | -34,78 | ||||
| 2026-02-17 | 13F | Fred Alger Management, Llc | 344.878 | -73,27 | 8.253 | -89,04 | ||||
| 2026-02-10 | 13F | Daiwa Securities Group Inc. | 158 | 0,00 | 0 | |||||
| 2026-02-11 | 13F | Parallel Advisors, LLC | 848 | 20 | ||||||
| 2026-02-17 | 13F | SummitTX Capital, L.P. | 27.708 | 386,28 | 663 | 99,70 | ||||
| 2026-01-26 | 13F | Private Trust Co Na | 0 | -100,00 | 0 | |||||
| 2026-02-17 | 13F | Apis Capital Advisors, LLC | 0 | -100,00 | 0 | -100,00 | ||||
| 2026-02-17 | 13F | Two Sigma Advisers, Lp | 1.110.400 | 171,16 | 26.572 | 11,17 | ||||
| 2026-02-10 | 13F | Monaco Asset Management SAM | 25.000 | -37,36 | 598 | -74,32 | ||||
| 2026-04-07 | 13F | Farther Finance Advisors, LLC | 112 | -1,75 | 2 | -50,00 | ||||
| 2026-04-22 | 13F | Patriot Financial Group Insurance Agency, LLC | 16.800 | 275 | ||||||
| 2026-02-05 | 13F | Tejara Capital Ltd | 42.000 | 1.005 | ||||||
| 2026-02-17 | 13F | Ikarian Capital, LLC | Call | 105.400 | -80,32 | 2.522 | -91,93 | |||
| 2026-02-17 | 13F | Ikarian Capital, LLC | 91.060 | 55,37 | 2.179 | -36,31 | ||||
| 2025-11-14 | 13F | Skopos Labs, Inc. | 0 | -100,00 | 0 | |||||
| 2025-11-13 | 13F | UBS Group AG | Call | 0 | -100,00 | 0 | -100,00 | |||
| 2026-02-13 | 13F | Citigroup Inc | 184.765 | 1.496,24 | 4.421 | 554,96 | ||||
| 2026-02-12 | 13F | Ci Investments Inc. | 37.841 | -20,23 | 906 | 45.150,00 | ||||
| 2026-02-13 | 13F | Citigroup Inc | Call | 30.000 | 0,00 | 718 | -59,05 | |||
| 2026-02-17 | 13F | Tower Research Capital LLC (TRC) | 76 | -92,71 | 2 | -98,33 | ||||
| 2026-02-17 | 13F | Boothbay Fund Management, Llc | Call | 39.300 | -82,06 | 940 | -92,65 | |||
| 2026-02-11 | 13F | Nationale-Nederlanden Powszechne Towarzystwo Emerytalne S.A. | 521.677 | 0,00 | 12.484 | -59,00 | ||||
| 2026-02-13 | 13F | Citigroup Inc | Put | 30.000 | 0,00 | 718 | -59,05 | |||
| 2026-02-13 | 13F | Exome Asset Management LLC | 0 | -100,00 | 0 | |||||
| 2026-02-17 | 13F | Boothbay Fund Management, Llc | 30.448 | -22,73 | 729 | -68,33 | ||||
| 2026-02-10 | 13F | Td Asset Management Inc | 23.734 | -75,05 | 568 | -89,79 | ||||
| 2025-11-14 | 13F | Point72 Hong Kong Ltd | 0 | -100,00 | 0 | |||||
| 2026-04-20 | 13F | Assenagon Asset Management S.A. | 146.749 | -75,82 | 2.399 | -83,48 | ||||
| 2026-02-13 | 13F | Transamerica Financial Advisors, Inc. | 71 | 2 | ||||||
| 2026-02-12 | 13F | Principal Securities, Inc. | 0 | -100,00 | 0 | |||||
| 2026-02-13 | 13F | Sofinnova Investments, Inc. | Call | 0 | -100,00 | 0 | -100,00 | |||
| 2026-02-13 | 13F/A | Tyro Capital Management LLC | 663.929 | 15.888 | ||||||
| 2026-02-17 | 13F | D. E. Shaw & Co., Inc. | 131.956 | 305,56 | 3.158 | 66,25 | ||||
| 2026-02-12 | 13F | Soleus Capital Management, L.P. | 0 | -100,00 | 0 | |||||
| 2026-02-13 | 13F | Schroder Investment Management Group | 55.015 | 1.308 | ||||||
| 2026-02-17 | 13F | D. E. Shaw & Co., Inc. | Call | 11.200 | -92,07 | 268 | -96,75 | |||
| 2026-02-13 | 13F | Smartleaf Asset Management LLC | 2.000 | 48 | ||||||
| 2026-02-13 | 13F | Sofinnova Investments, Inc. | Put | 0 | -100,00 | 0 | -100,00 | |||
| 2026-02-18 | 13F/A | ADAR1 Capital Management, LLC | Call | 30.000 | -85,00 | 718 | -93,86 | |||
| 2026-02-18 | 13F/A | ADAR1 Capital Management, LLC | 235.155 | 76,39 | 5.627 | -27,68 | ||||
| 2026-02-23 | 13F | Virtu Financial LLC | 0 | -100,00 | 0 | -100,00 | ||||
| 2026-01-28 | 13F | WPG Advisers, LLC | 10 | -94,90 | 0 | -100,00 | ||||
| 2026-02-17 | 13F | Darwin Global Management, Ltd. | 0 | -100,00 | 0 | |||||
| 2026-02-19 | 13F | Invesco Ltd. | 0 | -100,00 | 0 | -100,00 | ||||
| 2026-02-17 | 13F | Catalio Capital Management, LP | 288.345 | 1,91 | 6.900 | -58,22 | ||||
| 2026-01-28 | 13F | Arizona State Retirement System | 11.141 | 5,96 | 267 | -56,61 | ||||
| 2025-11-14 | 13F | Jane Street Group, Llc | 0 | -100,00 | 0 | -100,00 | ||||
| 2026-02-03 | 13F | Privium Fund Management B.V. | 416.270 | 7,84 | 9.961 | -55,79 | ||||
| 2026-01-29 | 13F | UBS Group AG | 491.454 | 139,75 | 11.760 | -1,71 | ||||
| 2026-02-17 | 13F | Readystate Asset Management Lp | 361.560 | 8.652 | ||||||
| 2026-02-17 | 13F | Parkman Healthcare Partners LLC | 257.382 | -25,47 | 6.159 | -69,45 | ||||
| 2026-02-06 | 13F | Profund Advisors Llc | 59.463 | 248,06 | 1.423 | 42,63 | ||||
| 2026-02-13 | 13F | Marshall Wace, Llp | 21.159 | 506 | ||||||
| 2026-02-10 | 13F/A | Northwestern Mutual Wealth Management Co | 3 | 0 | ||||||
| 2026-02-11 | 13F | Fiera Capital Corp | 768.510 | 18.390 | ||||||
| 2026-02-06 | 13F | Larson Financial Group LLC | 8 | 0,00 | 0 | |||||
| 2026-02-13 | 13F | Caitong International Asset Management Co., Ltd | 0 | -100,00 | 0 | |||||
| 2026-02-17 | 13F | Voleon Capital Management Lp | 20.243 | 484 | ||||||
| 2026-02-17 | 13F | Polymer Capital Management (US) LLC | 0 | -100,00 | 0 | |||||
| 2026-02-17 | 13F | NEOS Investment Management LLC | 0 | -100,00 | 0 | |||||
| 2026-02-12 | 13F | New York State Common Retirement Fund | 147.549 | 3.531 | ||||||
| 2026-02-13 | 13F | Velan Capital Investment Management LP | 0 | -100,00 | 0 | |||||
| 2026-01-30 | 13F | Pekin Hardy Strauss, Inc. | 29.300 | 701 | ||||||
| 2026-02-17 | 13F | Virtus Investment Advisers, Inc. | 13.636 | 91,62 | 326 | -21,45 | ||||
| 2026-02-11 | 13F | BIT Capital GmbH | 31.614 | 757 | ||||||
| 2026-02-17 | 13F | Cresset Asset Management, LLC | 0 | -100,00 | 0 | -100,00 | ||||
| 2026-02-17 | 13F | Rtw Investments, Lp | 3.711.462 | -16,12 | 88.815 | -65,61 | ||||
| 2026-02-04 | 13F | NAN FUNG TRINITY (HK) Ltd | 115.494 | 2.764 | ||||||
| 2026-02-13 | 13F | Rafferty Asset Management, LLC | 164.937 | 99,06 | 3.947 | -18,40 | ||||
| 2026-02-11 | 13F | Havemeyer Place LP | 29.655 | 710 | ||||||
| 2026-04-07 | 13F | CoreCap Advisors, LLC | 19 | 0,00 | 0 | |||||
| 2026-02-05 | 13F | Qsemble Capital Management, LP | 15.931 | 381 | ||||||
| 2026-02-03 | 13F | Washington Trust Advisors, Inc. | 0 | -100,00 | 0 | |||||
| 2026-04-21 | 13F | Cannon Global Investment Management, LLC | 12.200 | 199 | ||||||
| 2025-11-14 | 13F | National Bank Of Canada /fi/ | 0 | -100,00 | 0 | -100,00 | ||||
| 2026-02-10 | 13F | Clear Harbor Asset Management, LLC | 16.900 | 141,43 | 404 | -0,98 | ||||
| 2026-02-17 | 13F | State Of Wisconsin Investment Board | 19.390 | 443,44 | 464 | 123,08 | ||||
| 2026-02-17 | 13F | Sig Brokerage, Lp | Put | 11.000 | 83,33 | 263 | -24,86 | |||
| 2025-11-12 | 13F/A | Norges Bank | 0 | -100,00 | 0 | |||||
| 2026-02-13 | 13F | Sofinnova Investments, Inc. | 176.513 | 28,97 | 4.224 | -47,13 | ||||
| 2026-02-17 | 13F | Sig Brokerage, Lp | Call | 31.000 | -39,22 | 742 | -75,10 | |||
| 2026-02-11 | 13F | Group One Trading, L.p. | 0 | -100,00 | 0 | -100,00 | ||||
| 2026-02-13 | 13F | SRS Capital Advisors, Inc. | 6 | -91,04 | 0 | -100,00 | ||||
| 2026-02-17 | 13F | Logos Global Management LP | 675.000 | 125,00 | 16.153 | -7,76 | ||||
| 2026-02-10 | 13F | Clear Harbor Asset Management, LLC | Put | 1.000 | 24 | |||||
| 2026-04-16 | 13F | Toth Financial Advisory Corp | 0 | -100,00 | 0 | |||||
| 2026-02-17 | 13F | Jump Financial, LLC | 306.131 | 7.326 | ||||||
| 2026-02-13 | 13F | Maverick Capital Ltd | 661.820 | 15.837 | ||||||
| 2026-02-13 | 13F | Sassicaia Capital Advisers Llc | 10.400 | -35,00 | 249 | -73,42 | ||||
| 2026-02-17 | 13F | Citadel Advisors Llc | Call | 812.400 | 200,89 | 19.441 | 23,36 | |||
| 2026-02-17 | 13F | Citadel Advisors Llc | 469.300 | 9,21 | 11.230 | -55,23 | ||||
| 2026-02-06 | 13F | Mraz, Amerine & Associates, Inc. | 8.495 | -8,84 | 203 | -62,62 | ||||
| 2026-02-17 | 13F | Citadel Advisors Llc | Put | 483.200 | -20,00 | 11.563 | -67,20 | |||
| 2026-02-17 | 13F | Royal Bank Of Canada | 85.640 | -59,49 | 2.050 | -83,39 | ||||
| 2026-02-17 | 13F | Graham Capital Management, L.P. | 9.013 | 216 | ||||||
| 2026-04-16 | 13F | SG Americas Securities, LLC | 776.604 | 1.107,29 | 13 | 1.100,00 | ||||
| 2026-02-09 | 13F | Legal & General Group Plc | 31.964 | -10,27 | 765 | -63,25 | ||||
| 2026-02-17 | 13F | Creative Planning | 0 | -100,00 | 0 | |||||
| 2026-02-05 | 13F | Allworth Financial LP | 174 | 0,00 | 4 | -60,00 | ||||
| 2026-02-13 | 13F | Sei Investments Co | 13.938 | -79,28 | 333 | -91,52 | ||||
| 2026-02-17 | 13F | Ally Bridge Group (NY) LLC | Call | 200.000 | 4.786 | |||||
| 2026-02-11 | 13F | Simplex Trading, Llc | 110.675 | 62,77 | 2.648 | 88.166,67 | ||||
| 2026-02-13 | 13F | First Turn Management, LLC | 321.655 | 7.697 | ||||||
| 2026-02-11 | 13F | Simplex Trading, Llc | Call | 475.300 | 104,34 | 11.374 | 87.384,62 | |||
| 2026-01-29 | 13F | Pictet Asset Management Holding SA | 0 | -100,00 | 0 | -100,00 | ||||
| 2026-02-11 | 13F | Simplex Trading, Llc | Put | 295.800 | -23,37 | 7.078 | 32.072,73 | |||
| 2026-02-17 | 13F | Creek Drive Management Group LLC | Call | 300.000 | 780 | |||||
| 2026-02-17 | 13F | Cetera Investment Advisers | 8.366 | 200 | ||||||
| 2026-02-12 | 13F | Silverarc Capital Management, Llc | 126.047 | -72,30 | 3.016 | -88,64 | ||||
| 2026-02-12 | 13F | Silverarc Capital Management, Llc | Call | 720.800 | 17.249 | |||||
| 2026-02-17 | 13F | Sphera Funds Management Ltd. | 0 | -100,00 | 0 | |||||
| 2026-02-13 | 13F | Centiva Capital, LP | Call | 268.300 | 14,85 | 6.420 | -52,92 | |||
| 2026-01-29 | 13F | IMC-Chicago, LLC | Put | 106.900 | 2.558 | |||||
| 2026-02-12 | 13F | Marex Group plc | 85.993 | -1,00 | 2.058 | -59,42 | ||||
| 2026-02-13 | 13F | Ubs Asset Management Americas Inc | 80.249 | 1.920 | ||||||
| 2026-01-23 | 13F | Bellevue Asset Management, Llc | 0 | -100,00 | 0 | |||||
| 2026-01-29 | 13F | IMC-Chicago, LLC | Call | 236.400 | 5.657 | |||||
| 2026-02-17 | 13F | Sphera Funds Management Ltd. | Put | 0 | -100,00 | 0 | ||||
| 2026-02-10 | 13F | State of Wyoming | 161 | 4 | ||||||
| 2026-02-13 | 13F | Siren, L.L.C. | 0 | -100,00 | 0 | |||||
| 2026-02-17 | 13F | Millennium Management Llc | Put | 30.000 | 0,00 | 718 | -59,05 | |||
| 2026-04-15 | 13F | Bayforest Capital Ltd | 9.499 | 155 | ||||||
| 2026-02-17 | 13F | Millennium Management Llc | 803.605 | 319,42 | 19.230 | 71,96 | ||||
| 2026-02-13 | 13F | Deep Track Capital, LP | 0 | -100,00 | 0 | -100,00 | ||||
| 2026-02-13 | 13F | Hudson Bay Capital Management LP | Put | 0 | -100,00 | 0 | -100,00 | |||
| 2026-02-17 | 13F | Vestal Point Capital, LP | 0 | -100,00 | 0 | -100,00 | ||||
| 2026-02-17 | 13F | Lighthouse Investment Partners, LLC | 12.500 | 299 | ||||||
| 2026-01-26 | 13F | Cwm, Llc | 247 | 0,00 | 0 | |||||
| 2026-02-12 | 13F | Voya Investment Management Llc | 28.850 | -71,75 | 690 | -88,42 | ||||
| 2026-03-13 | 13F/A | Avoro Capital Advisors LLC | 6.150.000 | 38,38 | 147.170 | -43,27 | ||||
| 2025-11-14 | 13F | Millennium Management Llc | Call | 0 | -100,00 | 0 | -100,00 | |||
| 2026-02-13 | 13F | Ashford Capital Management Inc | 10.000 | 239 | ||||||
| 2026-02-17 | 13F | MIRAE ASSET GLOBAL ETFS HOLDINGS Ltd. | 44.250 | 18,67 | 1.057 | -51,51 | ||||
| 2026-04-13 | 13F | IFP Advisors, Inc | 1.989 | 0,00 | 33 | -31,91 | ||||
| 2026-01-21 | 13F | Palumbo Wealth Management LLC | 0 | -100,00 | 0 | -100,00 | ||||
| 2026-02-17 | 13F | Artia Global Partners LP | 1.023.539 | 55,35 | 24.493 | -36,31 | ||||
| 2026-02-17 | 13F | Integral Health Asset Management, LLC | 0 | -100,00 | 0 | -100,00 | ||||
| 2026-01-27 | 13F | Zurcher Kantonalbank (Zurich Cantonalbank) | 19.007 | -4,47 | 455 | -60,90 | ||||
| 2026-02-06 | 13F | Entrust Financial Llc | 190 | 5 | ||||||
| 2026-02-13 | 13F | FORA Capital, LLC | 13.313 | 319 | ||||||
| 2026-02-13 | 13F | Nantahala Capital Management, LLC | 699.298 | -30,59 | 16.734 | -71,54 | ||||
| 2026-04-14 | 13F | Nbc Securities, Inc. | 2 | 0,00 | 0 | |||||
| 2026-02-06 | 13F | EverSource Wealth Advisors, LLC | 109 | 0,00 | 3 | -66,67 | ||||
| 2026-04-09 | 13F | Park Place Capital Corp | 17 | 0 | ||||||
| 2026-02-06 | 13F | Diamond Hill Capital Management Inc | 33.333 | 0,00 | 798 | -59,02 | ||||
| 2026-02-13 | 13F | Barclays Plc | Put | 162.500 | -14,61 | 3.889 | -65,00 | |||
| 2026-02-13 | 13F | Barclays Plc | Call | 287.500 | 208,48 | 6.880 | 26,45 | |||
| 2026-02-13 | 13F | Alyeska Investment Group, L.P. | 151.058 | 277,64 | 3.615 | 54,84 | ||||
| 2026-02-02 | 13F | Total Clarity Wealth Management, Inc. | 0 | -100,00 | 0 | |||||
| 2026-02-13 | 13F | Barclays Plc | 209.790 | 81,54 | 5.020 | -25,57 | ||||
| 2026-02-13 | 13F | Morgan Stanley | 716.927 | 122,99 | 17.156 | -8,58 | ||||
| 2026-02-17 | 13F | Raymond James Financial Inc | 0 | -100,00 | 0 | |||||
| 2025-10-30 | 13F | Covestor Ltd | 0 | -100,00 | 0 | |||||
| 2026-02-13 | 13F | Headlands Technologies LLC | 39.616 | -30,99 | 948 | -71,70 | ||||
| 2026-02-17 | 13F | Persistent Asset Partners Ltd | 11.014 | 264 | ||||||
| 2026-04-22 | 13F | Matauro, Llc | 26.118 | 427 | ||||||
| 2026-02-04 | 13F | LRI Investments, LLC | 0 | -100,00 | 0 | |||||
| 2026-02-17 | 13F | Perceptive Advisors Llc | 0 | -100,00 | 0 | -100,00 | ||||
| 2026-02-17 | 13F | Caption Management, LLC | Call | 635.000 | 66,67 | 15.196 | -31,67 | |||
| 2026-02-17 | 13F | Bank Of America Corp /de/ | 329.525 | 11,65 | 7.886 | -54,23 | ||||
| 2026-02-17 | 13F | Caption Management, LLC | 177.277 | -61,32 | 4.242 | -84,14 | ||||
| 2026-02-17 | 13F | Caption Management, LLC | Put | 217.400 | -58,02 | 5.202 | -82,79 | |||
| 2026-02-17 | 13F | 683 Capital Management, LLC | 384.950 | -64,02 | 9.212 | -85,25 | ||||
| 2026-02-17 | 13F | 683 Capital Management, LLC | Call | 750.100 | 17.950 | |||||
| 2026-01-29 | 13F | China Universal Asset Management Co., Ltd. | 10.150 | 5,54 | 243 | -56,86 | ||||
| 2026-02-17 | 13F | Fmr Llc | 6.240.936 | 2,99 | 149.346 | -57,78 | ||||
| 2026-04-02 | 13F/A | Seven Fleet Capital Management LP | 8.742 | 209 | ||||||
| 2026-02-17 | 13F | Ra Capital Management, L.p. | 0 | -100,00 | 0 | -100,00 | ||||
| 2026-02-11 | 13F | Gordian Capital Singapore Pte Ltd | 0 | -100,00 | 0 | |||||
| 2026-02-17 | 13F | Cape Investment Advisory, Inc. | 40 | 1 | ||||||
| 2026-02-13 | 13F/A | Virtus ETF Advisers LLC | 0 | -100,00 | 0 | -100,00 | ||||
| 2026-02-13 | 13F | Diametric Capital, LP | 11.822 | 119,62 | 283 | -10,19 | ||||
| 2026-02-13 | 13F | Voss Capital, LLC | 210.000 | 68,00 | 5.025 | -31,13 | ||||
| 2026-01-15 | 13F/A | Persistent Asset Partners Ltd | Call | 0 | -100,00 | 0 | -100,00 | |||
| 2026-02-17 | 13F | Price T Rowe Associates Inc /md/ | 208.646 | -77,15 | 5 | -92,45 | ||||
| 2026-02-13 | 13F | Manufacturers Life Insurance Company, The | 0 | -100,00 | 0 | |||||
| 2026-02-17 | 13F | Boone Capital Management Llc | 0 | -100,00 | 0 | |||||
| 2025-11-14 | 13F | Wolverine Trading, Llc | 20.098 | 45,73 | 1.194 | 524,61 | ||||
| 2026-02-14 | 13F | Rockefeller Capital Management L.P. | 247 | -75,30 | 6 | -91,38 | ||||
| 2025-11-14 | 13F | Wolverine Trading, Llc | Call | 111.100 | 105,36 | 6.599 | 781,04 | |||
| 2025-11-14 | 13F | Wolverine Trading, Llc | Put | 92.300 | 368,53 | 5.483 | 1.908,06 | |||
| 2026-02-17 | 13F | Gilder Gagnon Howe & Co Llc | 0 | -100,00 | 0 | |||||
| 2026-02-17 | 13F | Balyasny Asset Management Llc | 135.644 | -59,29 | 3.246 | -83,32 | ||||
| 2026-02-13 | 13F | Atika Capital Management LLC | 0 | -100,00 | 0 | |||||
| 2026-02-13 | 13F | Affinity Asset Advisors, LLC | Call | 800.000 | 19.144 | |||||
| 2026-02-13 | 13F | Affinity Asset Advisors, LLC | 50.000 | -83,33 | 1.196 | -93,17 | ||||
| 2026-04-13 | 13F | Salem Investment Counselors Inc | 300 | 5 | ||||||
| 2026-02-10 | 13F | Bnp Paribas Arbitrage, Sa | 221.343 | -42,60 | 5.297 | -76,47 | ||||
| 2026-02-12 | 13F | Swiss National Bank | 79.000 | 3,54 | 1.890 | -57,56 | ||||
| 2026-02-13 | 13F | Rhenman & Partners Asset Management AB | 79.375 | 1.899 | ||||||
| 2026-01-16 | 13F | Tema Etfs Llc | 0 | -100,00 | 0 | -100,00 | ||||
| 2026-02-10 | 13F | Goldman Sachs Group Inc | 1.167.608 | 76,32 | 27.941 | -27,72 | ||||
| 2026-02-12 | 13F | Brinker Capital Investments, LLC | 10.768 | 258 | ||||||
| 2026-02-17 | 13F | Burkehill Global Management, LP | 0 | -100,00 | 0 | |||||
| 2026-02-12 | 13F | Financial Engines Advisors L.L.C. | 0 | -100,00 | 0 | |||||
| 2026-02-13 | 13F | Verition Fund Management LLC | 0 | -100,00 | 0 | |||||
| 2026-03-26 | 13F/A | Peak6 Llc | 0 | -100,00 | 0 | -100,00 | ||||
| 2026-02-09 | 13F | Geode Capital Management, Llc | 776.071 | 7,54 | 18.578 | -55,91 | ||||
| 2026-02-17 | 13F | Whitefort Capital Management, LP | 459.000 | 10.984 | ||||||
| 2026-02-17 | 13F | Advisor Group Holdings, Inc. | Call | 1 | 1 | |||||
| 2026-02-13 | 13F | Mml Investors Services, Llc | 33.937 | 812 | ||||||
| 2026-02-17 | 13F | Coppell Advisory Solutions LLC | 0 | -100,00 | 0 | |||||
| 2026-02-11 | 13F | Franklin Resources Inc | 746.602 | -62,46 | 17.866 | -84,61 | ||||
| 2026-01-16 | 13F | Standard Life Aberdeen plc | 3.678.640 | 25,13 | 88.030 | -48,70 | ||||
| 2026-02-12 | 13F | Knott David M Jr | 4.000 | 100,00 | 96 | -18,10 | ||||
| 2026-02-17 | 13F | Nomura Holdings Inc | 15.584 | 373 | ||||||
| 2026-02-17 | 13F | Nomura Holdings Inc | Call | 25.200 | 603 | |||||
| 2026-02-17 | 13F | Nomura Holdings Inc | Put | 47.200 | -52,75 | 1.129 | -80,64 | |||
| 2025-11-14 | 13F | Toronto Dominion Bank | 0 | -100,00 | 0 | |||||
| 2026-02-17 | 13F | Prelude Capital Management, Llc | 15.739 | 29,43 | 377 | -46,97 | ||||
| 2026-04-15 | 13F | Activest Wealth Management | 5.000 | 0,00 | 82 | -31,93 | ||||
| 2026-02-17 | 13F | PFM Health Sciences, LP | 39.499 | -14,79 | 945 | -65,06 | ||||
| 2026-02-13 | 13F | Vontobel Holding Ltd. | 11.933 | 286 | ||||||
| 2026-02-13 | 13F | Motiv8 Investments LLC | 45 | 0 | ||||||
| 2026-02-05 | 13F | DnB Asset Management AS | 27.342 | 131,67 | 654 | -4,94 | ||||
| 2026-04-24 | 13F | Root Financial Partners, LLC | 14 | 0 | ||||||
| 2026-02-17 | 13F | EcoR1 Capital, LLC | 0 | -100,00 | 0 | -100,00 | ||||
| 2026-02-17 | 13F | Schonfeld Strategic Advisors LLC | 122.529 | -34,89 | 2.932 | -73,31 | ||||
| 2026-02-03 | 13F | Ballentine Partners, LLC | 0 | -100,00 | 0 | |||||
| 2026-02-06 | 13F | Global Retirement Partners, LLC | 67 | -77,67 | 2 | -94,12 | ||||
| 2026-02-10 | 13F | SCS Capital Management LLC | 0 | -100,00 | 0 | |||||
| 2026-02-17 | 13F | Russell Investments Group, Ltd. | 23.707 | -84,18 | 567 | -93,52 | ||||
| 2026-02-02 | 13F | Montag A & Associates Inc | 5 | 0 | ||||||
| 2026-01-30 | 13F | Sigma Planning Corp | 0 | -100,00 | 0 | |||||
| 2026-04-13 | 13F | E Fund Management Co., Ltd. | 11.348 | 186 | ||||||
| 2026-02-17 | 13F | Persistent Asset Partners Ltd | Put | 688 | 0,00 | 180 | 22,45 | |||
| 2026-02-12 | 13F | Steward Partners Investment Advisory, Llc | 250 | 0,00 | 6 | -64,29 | ||||
| 2026-02-17 | 13F | MPM Oncology Impact Management LP | 1.381.628 | 33.062 | ||||||
| 2026-02-17 | 13F | Algert Global Llc | 72.150 | 216,31 | 2 | 0,00 | ||||
| 2026-02-13 | 13F | Birchview Capital, LP | 30.789 | -60,89 | 737 | -83,98 | ||||
| 2026-02-13 | 13F | Hudson Bay Capital Management LP | 125.500 | 2.806,44 | 3.003 | 1.091,67 | ||||
| 2026-01-26 | 13F | Mirae Asset Global Investments Co., Ltd. | 3.027 | 42,72 | 72 | -41,46 | ||||
| 2026-02-17 | 13F | Aquatic Capital Management LLC | 0 | -100,00 | 0 | |||||
| 2026-02-11 | 13F | Westfield Capital Management Co Lp | 0 | -100,00 | 0 | |||||
| 2025-11-14 | 13F | EcoR1 Capital, LLC | Call | 0 | -100,00 | 0 | -100,00 | |||
| 2026-02-09 | 13F | Jefferies Financial Group Inc. | 90.542 | 0,00 | 2.167 | -59,01 | ||||
| 2026-02-17 | 13F | Susquehanna Portfolio Strategies, LLC | 28.708 | -2,84 | 687 | -60,21 | ||||
| 2026-02-17 | 13F | Two Sigma Investments, Lp | 1.451.284 | 61,70 | 34.729 | -33,71 |