Grundlæggende statistik
| Institutionelle ejere | 87 total, 81 long only, 1 short only, 5 long/short - change of -11,24% MRQ |
| Gennemsnitlig porteføljeallokering | 0.4462 % - change of 26,61% MRQ |
| Institutionelle aktier (lange) | 4.865.828 (ex 13D/G) - change of -1,31MM shares -11,13% MRQ |
| Institutionel værdi (lang) | $ 429.654 USD ($1000) |
Institutionelt ejerskab og aktionærer
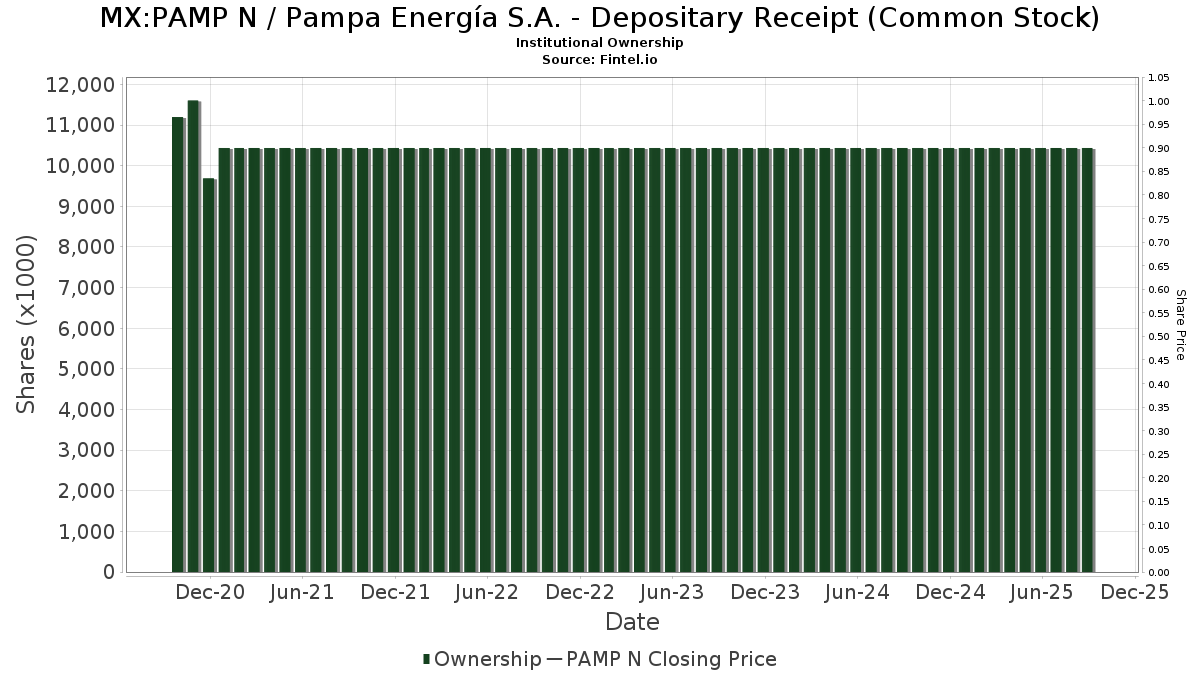
Pampa Energía S.A. - Depositary Receipt (Common Stock) (MX:PAMP N) har 87 institutionelle ejere og aktionærer, der har indsendt 13D/G- eller 13F-formularer til Securities Exchange Commission (SEC). Disse institutioner har i alt 4,865,828 aktier. Største aktionærer omfatter Helikon Investments Ltd, MIRAE ASSET GLOBAL ETFS HOLDINGS Ltd., TT International Asset Management LTD, Ping Capital Management, Inc., Jpmorgan Chase & Co, PointState Capital LP, Fundamenta Capital S.A., Morgan Stanley, VR Advisory Services Ltd, and Millennium Management Llc .
Pampa Energía S.A. - Depositary Receipt (Common Stock) (BMV:PAMP N) institutionel ejerskabsstruktur viser aktuelle positioner i virksomheden efter institutioner og fonde, samt seneste ændringer i positionsstørrelse. Større aktionærer kan omfatte individuelle investorer, investeringsforeninger, hedgefonde eller institutioner. Skema 13D angiver, at investoren besidder (eller besidder) mere end 5 % af virksomheden og har til hensigt (eller har til hensigt at) aktivt at forfølge en ændring i forretningsstrategi. Skema 13G indikerer en passiv investering på over 5%.
Fondens stemningsscore
Fund Sentiment Score (fka Ownership Accumulation Score) finder de aktier, der bliver mest købt af fonde. Det er resultatet af en sofistikeret, multi-faktor kvantitativ model, der identificerer virksomheder med de højeste niveauer af institutionel akkumulering. Scoringsmodellen bruger en kombination af den samlede stigning i oplyste ejere, ændringerne i porteføljeallokeringer i disse ejere og andre målinger. Tallet går fra 0 til 100, hvor højere tal indikerer et højere niveau af akkumulering for sine jævnaldrende, og 50 er gennemsnittet.
Opdateringsfrekvens: Dagligt
Se Ownership Explorer, som giver en liste over højest rangerende virksomheder.
AI+ Ask Fintel’s AI assistant about Pampa Energía S.A. - Depositary Receipt (Common Stock).
Select a question to share a public post with an AI-crafted answer.
Thinking of good questions…
13F og NPORT arkivering
Detaljer om 13F-arkivering er gratis. Detaljer om NP-ansøgninger kræver et premium-medlemskab. Grønne rækker angiver nye positioner. Røde rækker angiver lukkede positioner. Klik på linket ikon for at se den fulde transaktionshistorik.
Opgrader
for at låse premium-data op og eksportere til Excel ![]() .
.
| Fil dato | Kilde | Investor | Type | Gennemsnitlig pris (Øst) |
Aktier | Δ Aktier (%) |
Rapporteret Værdi ($1000) |
Δ Værdi (%) |
Port Alloc (%) |
|
|---|---|---|---|---|---|---|---|---|---|---|
| 2026-02-14 | 13F | Rockefeller Capital Management L.P. | 215 | 19 | ||||||
| 2026-02-03 | 13F | SBI Securities Co., Ltd. | 147 | 15,75 | 13 | 85,71 | ||||
| 2025-11-10 | 13F | Beverly Hills Private Wealth, LLC | 0 | -100,00 | 0 | |||||
| 2026-02-17 | 13F | Aquatic Capital Management LLC | 3.649 | 323 | ||||||
| 2026-02-05 | 13F | Helikon Investments Ltd | 565.449 | -19,08 | 50.048 | 19,25 | ||||
| 2026-01-08 | 13F | Chesapeake Asset Management Llc | 11.202 | 0,00 | 991 | 47,47 | ||||
| 2025-11-14 | 13F | Hrt Financial Lp | 0 | -100,00 | 0 | |||||
| 2026-02-17 | 13F | MIRAE ASSET GLOBAL ETFS HOLDINGS Ltd. | 379.981 | -16,64 | 33.632 | 22,86 | ||||
| 2026-02-17 | 13F | Point72 Asset Management, L.P. | 34.467 | 121,38 | 3.051 | 226,20 | ||||
| 2026-04-16 | 13F | Connective Portfolio Management, LLC | 7.000 | 620 | ||||||
| 2026-02-19 | 13F | Invesco Ltd. | 110.000 | 9.736 | ||||||
| 2026-02-13 | 13F | Van Eck Associates Corp | 4.933 | 113,73 | 0 | |||||
| 2026-01-07 | 13F | Qp Wealth Management, Llc | 0 | -100,00 | 0 | |||||
| 2026-02-17 | 13F | State Of Wisconsin Investment Board | 4.799 | 425 | ||||||
| 2025-11-12 | 13F | LPL Financial LLC | 0 | -100,00 | 0 | |||||
| 2026-02-10 | 13F | Quantbot Technologies LP | 1.050 | -66,26 | 93 | -50,54 | ||||
| 2026-02-17 | 13F | VR Advisory Services Ltd | 232.138 | -14,66 | 20.547 | 25,76 | ||||
| 2025-11-10 | 13F | Wrapmanager Inc | 0 | -100,00 | 0 | |||||
| 2025-11-12 | 13F | SPX Equities Gestao de Recursos Ltda | 0 | 0 | ||||||
| 2026-01-26 | 13F | Mirae Asset Global Investments Co., Ltd. | 546 | 5,81 | 48 | 60,00 | ||||
| 2026-02-12 | 13F | Marex Group plc | 12.320 | 1.090 | ||||||
| 2026-02-13 | 13F | Dynamic Technology Lab Private Ltd | 6.724 | -48,65 | 595 | -24,30 | ||||
| 2026-02-17 | 13F | Jones Financial Companies Lllp | 3 | 0 | ||||||
| 2026-02-06 | 13F | Pnc Financial Services Group, Inc. | 2 | -77,78 | 0 | |||||
| 2025-11-14 | 13F | Centiva Capital, LP | 0 | -100,00 | 0 | |||||
| 2026-02-20 | 13F | Sunbelt Securities, Inc. | 60 | 0,00 | 5 | 66,67 | ||||
| 2026-04-22 | 13F | Spire Wealth Management | 42 | 0,00 | 4 | 0,00 | ||||
| 2026-02-13 | 13F | Citigroup Inc | 36.422 | 3.224 | ||||||
| 2026-02-13 | 13F | Barclays Plc | 572 | -57,63 | 51 | -38,27 | ||||
| 2026-04-24 | 13F | Deltec Asset Management Llc | 11.738 | 134,76 | 1.039 | 134,84 | ||||
| 2026-02-17 | 13F | Engineers Gate Manager LP | 8.656 | 89,45 | 766 | 179,56 | ||||
| 2026-04-20 | 13F | Yorktown Management & Research Co Inc | 7.200 | 0,00 | 637 | 0,00 | ||||
| 2026-02-10 | 13F | Titan Global Capital Management Usa Llc | 12.792 | 44,18 | 1.132 | 112,78 | ||||
| 2025-11-07 | 13F | Gsa Capital Partners Llp | 0 | -100,00 | 0 | |||||
| 2026-02-13 | 13F | Mml Investors Services, Llc | 0 | -100,00 | 0 | |||||
| 2026-02-18 | 13F | Vident Advisory, LLC | 5.011 | 444 | ||||||
| 2026-04-20 | 13F | Assenagon Asset Management S.A. | 55.324 | 4.896 | ||||||
| 2025-11-14 | 13F | Two Sigma Advisers, Lp | 0 | -100,00 | 0 | |||||
| 2025-11-14 | 13F | Squarepoint Ops LLC | 0 | -100,00 | 0 | |||||
| 2026-03-06 | 13F | Hsbc Holdings Plc | 46.788 | 77,56 | 4.058 | 156,51 | ||||
| 2026-01-29 | 13F | UBS Group AG | 51.425 | -10,53 | 4.552 | 31,84 | ||||
| 2026-02-24 | 13F | DGS Capital Management, LLC | 2.645 | 234 | ||||||
| 2026-04-07 | 13F | Farther Finance Advisors, LLC | 191 | 0,00 | 17 | 0,00 | ||||
| 2026-02-10 | 13F | Goldman Sachs Group Inc | 79.706 | 133,04 | 7.055 | 243,43 | ||||
| 2025-11-14 | 13F | Tower Research Capital LLC (TRC) | 0 | -100,00 | 0 | |||||
| 2025-11-10 | 13F | Personal Cfo Solutions, Llc | 0 | -100,00 | 0 | |||||
| 2026-02-13 | 13F | Morgan Stanley | 236.359 | 34,92 | 20.920 | 98,84 | ||||
| 2026-02-17 | 13F | Advisory Services Network, LLC | 0 | -100,00 | 0 | |||||
| 2026-04-27 | 13F | Ping Capital Management, Inc. | 329.500 | 54,62 | 29.161 | 54,60 | ||||
| 2025-11-14 | 13F | Cubist Systematic Strategies, LLC | 0 | -100,00 | 0 | -100,00 | ||||
| 2026-02-17 | 13F | Bank Of America Corp /de/ | 6.598 | -32,67 | 584 | -0,85 | ||||
| 2026-02-17 | 13F | Northern Trust Corp | 6.197 | -0,26 | 548 | 46,92 | ||||
| 2026-02-17 | 13F | Voloridge Investment Management, Llc | 99.666 | -2,04 | 8.821 | 44,37 | ||||
| 2026-02-17 | 13F | Balyasny Asset Management Llc | 89.856 | -48,38 | 7.953 | -23,93 | ||||
| 2025-11-14 | 13F | Cetera Investment Advisers | 0 | -100,00 | 0 | |||||
| 2026-02-12 | 13F | Federation des caisses Desjardins du Quebec | 200 | 0,00 | 18 | 41,67 | ||||
| 2026-02-17 | 13F | Susquehanna International Group, Llp | Call | 111.500 | 194,20 | 9.869 | 333,57 | |||
| 2026-02-17 | 13F | Susquehanna International Group, Llp | 12.106 | -28,01 | 1.072 | 6,14 | ||||
| 2026-02-17 | 13F | Susquehanna International Group, Llp | Put | 55.200 | 47,99 | 4.886 | 118,08 | |||
| 2026-02-12 | 13F | Banco BTG Pactual S.A. | 88.217 | 3,83 | 7.808 | 53,01 | ||||
| 2026-02-17 | 13F | Driehaus Capital Management Llc | 21.253 | 0,00 | 1.881 | 47,41 | ||||
| 2026-02-10 | 13F | Bnp Paribas Arbitrage, Sa | 10.642 | -22,16 | 942 | 14,62 | ||||
| 2026-02-11 | 13F | Jpmorgan Chase & Co | 274.758 | 20,49 | 24.319 | 77,56 | ||||
| 2026-02-17 | 13F | PointState Capital LP | 271.221 | 24.006 | ||||||
| 2026-02-13 | 13F | Verition Fund Management LLC | 2.522 | -30,90 | 223 | 1,83 | ||||
| 2026-04-24 | 13F | TT International Asset Management LTD | 336.388 | 4,04 | 29.770 | 106.221,43 | ||||
| 2026-01-27 | 13F | Fundamenta Capital S.A. | 265.464 | 23.496 | ||||||
| 2026-02-18 | 13F | GWM Advisors LLC | 0 | -100,00 | 0 | |||||
| 2025-11-12 | 13F | William Blair Investment Management, Llc | 0 | -100,00 | 0 | -100,00 | ||||
| 2025-11-03 | 13F | Federated Hermes, Inc. | 0 | -100,00 | 0 | |||||
| 2025-11-12 | 13F | Stifel Financial Corp | 0 | -100,00 | 0 | |||||
| 2026-02-13 | 13F | Absolute Gestao de Investimentos Ltda. | 96.420 | -7,81 | 8.534 | 35,87 | ||||
| 2026-02-17 | 13F | Schonfeld Strategic Advisors LLC | 4.668 | -66,89 | 413 | 179,05 | ||||
| 2026-04-06 | 13F | GAMMA Investing LLC | 1.724 | -7,01 | 153 | -7,32 | ||||
| 2025-10-31 | 13F | Whittier Trust Co Of Nevada Inc | 0 | -100,00 | 0 | |||||
| 2025-11-14 | 13F | Credit Agricole S A | 0 | -100,00 | 0 | |||||
| 2025-10-30 | 13F | Ridgewood Investments LLC | 0 | -100,00 | 0 | -100,00 | ||||
| 2025-11-12 | 13F | Group One Trading, L.p. | 0 | -100,00 | 0 | -100,00 | ||||
| 2025-11-14 | 13F | Integrated Wealth Concepts LLC | 0 | -100,00 | 0 | |||||
| 2026-04-22 | 13F | Pictet Asset Management Holding SA | 6.202 | -62,48 | 549 | -62,54 | ||||
| 2026-02-13 | 13F | Wells Fargo & Company/mn | 84 | -39,57 | 7 | -12,50 | ||||
| 2026-02-17 | 13F | Royal Bank Of Canada | 692 | 0,00 | 61 | 48,78 | ||||
| 2026-02-17 | 13F | Seldon Capital Lp | 142.151 | 12.582 | ||||||
| 2026-04-27 | 13F | Y-Intercept (Hong Kong) Ltd | 17.728 | 1.569 | ||||||
| 2025-11-14 | 13F | D. E. Shaw & Co., Inc. | 0 | -100,00 | 0 | -100,00 | ||||
| 2026-04-20 | 13F | Ronald Blue Trust, Inc. | 167 | 3.240,00 | 15 | |||||
| 2026-02-12 | 13F | Barometer Capital Management Inc. | 0 | -100,00 | 0 | |||||
| 2026-02-17 | 13F | Advisor Group Holdings, Inc. | 1.739 | -58,58 | 154 | -44,57 | ||||
| 2026-02-17 | 13F | Brevan Howard Capital Management LP | 165.940 | 63,40 | 14.555 | 138,63 | ||||
| 2026-02-03 | 13F | Diversify Wealth Management, Llc | 0 | -100,00 | 0 | |||||
| 2026-01-30 | 13F | Wealth High Governance Capital Ltda | 54.924 | 4.861 | ||||||
| 2026-02-13 | 13F | Rhumbline Advisers | 624 | 1.055,56 | 55 | 1.733,33 | ||||
| 2025-11-13 | 13F | Fore Capital, LLC | 0 | -100,00 | 0 | |||||
| 2026-02-17 | 13F | Sig Brokerage, Lp | Put | 7.500 | 0,00 | 664 | 47,33 | |||
| 2026-02-10 | 13F | BW Gestao de Investimentos Ltda. | 35.076 | 3.105 | ||||||
| 2026-02-13 | 13F | Arete Wealth Advisors, LLC | 2.398 | 0 | ||||||
| 2026-02-13 | 13F/A | Alberta Investment Management Corp | 0 | -100,00 | 0 | |||||
| 2025-11-13 | 13F | Diversify Advisory Services, LLC | 0 | -100,00 | 0 | -100,00 | ||||
| 2025-11-13 | 13F | Marshall Wace, Llp | 0 | -100,00 | 0 | |||||
| 2026-02-13 | 13F | Banco Santander, S.A. | 6.248 | 76,10 | 553 | 159,62 | ||||
| 2026-02-17 | 13F | Turim 21 Investimentos Ltda. | 0 | -100,00 | 0 | |||||
| 2026-02-13 | 13F | Nfj Investment Group, Llc | 1.179 | 104 | ||||||
| 2026-02-06 | 13F | Verde Servicos Internacionais S.A. | 0 | -100,00 | 0 | |||||
| 2026-02-11 | 13F | Group One Trading, L.p. | Put | 6.200 | 287,50 | 549 | 470,83 | |||
| 2026-04-22 | 13F | Janney Montgomery Scott LLC | 0 | -100,00 | 0 | |||||
| 2026-02-11 | 13F | Group One Trading, L.p. | Call | 200 | -98,06 | 18 | -97,25 | |||
| 2026-02-17 | 13F | Millennium Management Llc | 212.796 | -32,18 | 18.835 | -0,05 | ||||
| 2026-02-17 | 13F | Mirabella Financial Services Llp | 9.686 | 857 | ||||||
| 2026-02-13 | 13F | Itau Unibanco Holding S.A. | 120.557 | 160,22 | 10.560 | 279,55 | ||||
| 2026-02-11 | 13F | Simplex Trading, Llc | Put | 9.400 | 3.033,33 | 832 | ||||
| 2025-11-14 | 13F | Qube Research & Technologies Ltd | 0 | -100,00 | 0 | |||||
| 2026-02-11 | 13F | Simplex Trading, Llc | 1 | 0 | ||||||
| 2026-02-17 | 13F | Citadel Advisors Llc | Put | 16.800 | -90,94 | 1.487 | -86,66 | |||
| 2026-02-12 | 13F | Principal Securities, Inc. | 0 | -100,00 | 0 | |||||
| 2026-02-11 | 13F | Simplex Trading, Llc | Call | 400 | -92,59 | 35 | ||||
| 2026-02-17 | 13F | Citadel Advisors Llc | Call | 15.900 | -46,46 | 1.407 | -21,09 | |||
| 2026-04-27 | 13F | PFG Investments, LLC | 2.500 | -21,88 | 221 | -21,91 | ||||
| 2026-02-17 | 13F | Citadel Advisors Llc | 21.128 | 134,76 | 1.870 | 246,30 | ||||
| 2026-02-13 | 13F | Wexford Capital Lp | 37.749 | 3.341 | ||||||
| 2026-02-12 | 13F | Jane Street Group, Llc | Call | 9.400 | -7,84 | 832 | 35,78 | |||
| 2026-02-17 | 13F | Moneda S.A. Administradora General de Fondos | 48.259 | -3,31 | 4.271 | -0,26 | ||||
| 2026-01-28 | 13F | Financial Perspectives, Inc | 114 | 0,00 | 10 | 66,67 | ||||
| 2026-02-12 | 13F | Jane Street Group, Llc | 16.108 | -73,67 | 1.426 | -61,20 | ||||
| 2026-02-12 | 13F | Jane Street Group, Llc | Put | 76.200 | -67,83 | 6.744 | -52,60 | |||
| 2025-11-13 | 13F | Acadian Asset Management Llc | 0 | -100,00 | 0 | |||||
| 2026-04-07 | 13F | Estate Planners Group, LLC | 104 | 9 | ||||||
| 2025-11-05 | 13F | AdvisorShares Investments LLC | 0 | -100,00 | 0 | -100,00 | ||||
| 2026-01-20 | 13F | Toth Financial Advisory Corp | 0 | -100,00 | 0 | |||||
| 2025-11-05 | 13F | Envestnet Asset Management Inc | 0 | -100,00 | 0 | |||||
| 2026-01-30 | 13F | ABS Direct Equity Fund LLC | 26.105 | 11,80 | 2.311 | 64,76 | ||||
| 2026-01-30 | 13F | Glenorchy Capital Ltd | 61.823 | -4,52 | 5.472 | 40,72 | ||||
| 2026-02-13 | 13F | Caitong International Asset Management Co., Ltd | 0 | -100,00 | 0 | |||||
| 2025-11-14 | 13F | Raymond James Financial Inc | 0 | -100,00 | 0 | |||||
| 2025-11-18 | 13F | Dorsey Wright & Associates | 0 | -100,00 | 0 | |||||
| 2026-04-27 | 13F | Truist Financial Corp | 8.772 | 0,05 | 776 | 0,00 | ||||
| 2026-04-24 | 13F | UMA Financial Services, Inc. | 1 | 0,00 | 0 | |||||
| 2026-02-10 | 13F | Eurizon Capital SGR S.p.A. | 7.745 | 686 | ||||||
| 2026-02-12 | 13F | Insigneo Advisory Services, Llc | 5.781 | -66,78 | 512 | -51,10 | ||||
| 2025-11-06 | 13F | Atria Investments Llc | 0 | -100,00 | 0 | |||||
| 2026-02-12 | 13F | LWM Advisory Services, LLC | 4.218 | -3,54 | 373 | 42,37 | ||||
| 2026-02-06 | 13F | EverSource Wealth Advisors, LLC | 273 | -58,82 | 24 | -38,46 | ||||
| 2025-10-31 | 13F | Whittier Trust Co | 0 | -100,00 | 0 |