Grundlæggende statistik
| Institutionelle aktier (lange) | 219.939.183 - 77,78% (ex 13D/G) - change of 9,01MM shares 5,10% MRQ |
| Institutionel værdi (lang) | $ 6.468.738 USD ($1000) |
Institutionelt ejerskab og aktionærer
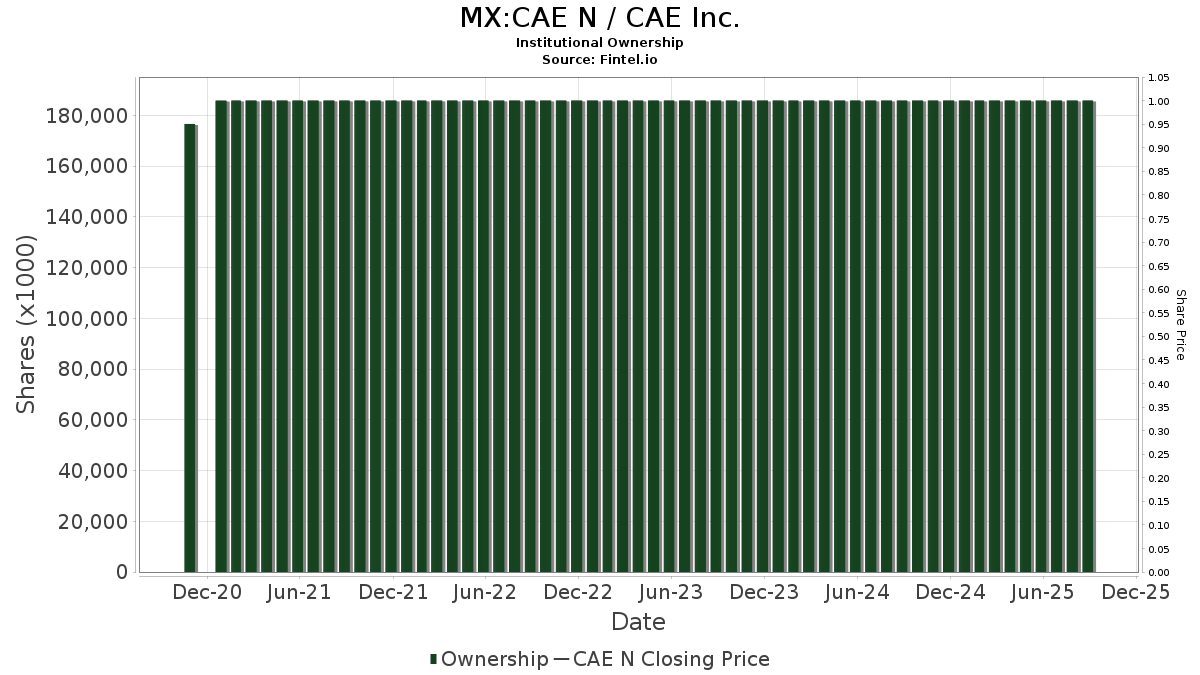
CAE Inc. (MX:CAE N) har 267 institutionelle ejere og aktionærer, der har indsendt 13D/G- eller 13F-formularer til Securities Exchange Commission (SEC). Disse institutioner har i alt 219,939,183 aktier. Største aktionærer omfatter Caisse De Depot Et Placement Du Quebec, 1832 Asset Management L.P., Brandes Investment Partners, Lp, Mackenzie Financial Corp, Vanguard Group Inc, Browning West Lp, FIL Ltd, Select Equity Group, L.P., Beutel, Goodman & Co Ltd., and Royal Bank Of Canada .
CAE Inc. (BMV:CAE N) institutionel ejerskabsstruktur viser aktuelle positioner i virksomheden efter institutioner og fonde, samt seneste ændringer i positionsstørrelse. Større aktionærer kan omfatte individuelle investorer, investeringsforeninger, hedgefonde eller institutioner. Skema 13D angiver, at investoren besidder (eller besidder) mere end 5 % af virksomheden og har til hensigt (eller har til hensigt at) aktivt at forfølge en ændring i forretningsstrategi. Skema 13G indikerer en passiv investering på over 5%.
Fondens stemningsscore
Fund Sentiment Score (fka Ownership Accumulation Score) finder de aktier, der bliver mest købt af fonde. Det er resultatet af en sofistikeret, multi-faktor kvantitativ model, der identificerer virksomheder med de højeste niveauer af institutionel akkumulering. Scoringsmodellen bruger en kombination af den samlede stigning i oplyste ejere, ændringerne i porteføljeallokeringer i disse ejere og andre målinger. Tallet går fra 0 til 100, hvor højere tal indikerer et højere niveau af akkumulering for sine jævnaldrende, og 50 er gennemsnittet.
Opdateringsfrekvens: Dagligt
Se Ownership Explorer, som giver en liste over højest rangerende virksomheder.
AI+ Ask Fintel’s AI assistant about CAE Inc..
Select a question to share a public post with an AI-crafted answer.
Thinking of good questions…
13F og NPORT arkivering
Detaljer om 13F-arkivering er gratis. Detaljer om NP-ansøgninger kræver et premium-medlemskab. Grønne rækker angiver nye positioner. Røde rækker angiver lukkede positioner. Klik på linket ikon for at se den fulde transaktionshistorik.
Opgrader
for at låse premium-data op og eksportere til Excel ![]() .
.
| Fil dato | Kilde | Investor | Type | Gennemsnitlig pris (Øst) |
Aktier | Δ Aktier (%) |
Rapporteret Værdi ($1000) |
Δ Værdi (%) |
Port Alloc (%) |
|
|---|---|---|---|---|---|---|---|---|---|---|
| 2026-02-13 | 13F | Prudential Financial Inc | 0 | -100,00 | 0 | |||||
| 2026-01-23 | 13F | Assetmark, Inc | 692 | 0,00 | 21 | 5,00 | ||||
| 2026-02-17 | 13F | IHT Wealth Management, LLC | 21.888 | -3,65 | 666 | -1,19 | ||||
| 2026-02-09 | 13F | Bleakley Financial Group, LLC | 17.418 | 40,90 | 530 | 44,54 | ||||
| 2026-02-10 | 13F | Quantbot Technologies LP | 0 | -100,00 | 0 | |||||
| 2026-04-24 | 13F | Root Financial Partners, LLC | 8 | 0 | ||||||
| 2026-04-07 | 13F | Farther Finance Advisors, LLC | 597 | -1,81 | 16 | -16,67 | ||||
| 2026-02-13 | 13F | Osmosis Investment Management UK Ltd | 9.324 | 284 | ||||||
| 2026-04-22 | 13F | Spire Wealth Management | 1.862 | 0,00 | 49 | -14,29 | ||||
| 2025-11-10 | 13F | Vestmark Advisory Solutions, Inc. | 0 | -100,00 | 0 | |||||
| 2026-02-17 | 13F | 683 Capital Management, LLC | 25.000 | 0,00 | 760 | 2,56 | ||||
| 2026-02-04 | 13F | Swiss Life Asset Management Ltd | 67.880 | 8,31 | 2.064 | 11,03 | ||||
| 2026-02-11 | 13F | Clearbridge Investments, LLC | 2.363.866 | -3,07 | 71.909 | -0,52 | ||||
| 2026-02-11 | 13F | Syon Capital Llc | 8.102 | 246 | ||||||
| 2026-02-05 | 13F | Allworth Financial LP | 6.309 | -8,66 | 192 | -6,37 | ||||
| 2026-02-05 | 13F | Atria Investments Llc | 22.389 | 0,47 | 681 | 3,18 | ||||
| 2026-02-11 | 13F | Jpmorgan Chase & Co | 1.124.546 | -8,43 | 34.209 | -6,02 | ||||
| 2026-02-17 | 13F | XTX Topco Ltd | 19.182 | -37,72 | 584 | -36,07 | ||||
| 2026-02-12 | 13F | UniSuper Management Pty Ltd | 5.400 | 0,00 | 225 | 1,35 | ||||
| 2026-02-17 | 13F | Tower Research Capital LLC (TRC) | 2.822 | -83,03 | 86 | -82,76 | ||||
| 2026-04-06 | 13F | Versant Capital Management, Inc | 3.387 | 48,68 | 88 | 27,54 | ||||
| 2026-01-22 | 13F | Massachusetts Financial Services Co /ma/ | 1.112.505 | -1,79 | 33.842 | 0,79 | ||||
| 2026-02-06 | 13F | Addison Advisors LLC | 3.060 | 0,00 | 93 | 3,33 | ||||
| 2026-02-10 | 13F | State of Wyoming | 13.007 | 2,78 | 396 | 5,61 | ||||
| 2026-02-11 | 13F | Brandes Investment Partners, Lp | 15.157.988 | 1,12 | 461.107 | 3,78 | ||||
| 2026-03-06 | 13F | Hsbc Holdings Plc | 0 | -100,00 | 0 | |||||
| 2026-02-17 | 13F | Russell Investments Group, Ltd. | 135.889 | 8,97 | 4.141 | 12,16 | ||||
| 2026-01-28 | 13F | CAPROCK Group, Inc. | 16.305 | 72,78 | 496 | 94,88 | ||||
| 2026-02-13 | 13F | Public Sector Pension Investment Board | 0 | -100,00 | 0 | |||||
| 2026-02-17 | 13F | Driehaus Capital Management Llc | 1.207.400 | -2,03 | 36.734 | 0,65 | ||||
| 2025-11-07 | 13F | Atticus Wealth Management, Llc | 0 | -100,00 | 0 | |||||
| 2026-02-10 | 13F | Intech Investment Management Llc | 11.636 | -93,01 | 354 | -92,82 | ||||
| 2026-02-06 | 13F | Pnc Financial Services Group, Inc. | 9.427 | -6,04 | 287 | -3,70 | ||||
| 2026-02-13 | 13F | Great West Life Assurance Co /can/ | 103.686 | 17,76 | 3 | 50,00 | ||||
| 2025-11-12 | 13F | Bellwether Advisors, LLC | 0 | -100,00 | 0 | |||||
| 2025-11-13 | 13F | Employees Retirement System of Texas | 0 | -100,00 | 0 | |||||
| 2026-02-13 | 13F | Ossiam | 0 | -100,00 | 0 | -100,00 | ||||
| 2026-04-24 | 13F | Triasima Portfolio Management inc. | 99.009 | 338,09 | 2.570 | 273,40 | ||||
| 2026-02-13 | 13F | Korea Investment CORP | 285.651 | -23,55 | 8.698 | -21,39 | ||||
| 2026-04-22 | 13F | Pinnacle Bancorp, Inc. | 438 | 0,00 | 11 | -15,38 | ||||
| 2026-02-17 | 13F | Qube Research & Technologies Ltd | 28.000 | -25,93 | 852 | -23,95 | ||||
| 2026-02-17 | 13F | Voloridge Investment Management, Llc | 0 | -100,00 | 0 | |||||
| 2026-02-09 | 13F | Rit Capital Partners Plc | 30.409 | -96,02 | 924 | -95,84 | ||||
| 2026-02-17 | 13F | Creative Planning | 14.279 | -13,05 | 434 | -10,70 | ||||
| 2026-02-02 | 13F | Intact Investment Management Inc. | 1.202.355 | 2,67 | 36.563 | 5,42 | ||||
| 2026-02-17 | 13F | State Of Wisconsin Investment Board | 520.684 | 15.855 | ||||||
| 2026-02-11 | 13F | Manchester Capital Management LLC | 685 | 21 | ||||||
| 2026-02-17 | 13F | Engineers Gate Manager LP | 14.136 | 429 | ||||||
| 2026-02-09 | 13F | Royce & Associates Lp | 152.442 | 22,04 | 4.636 | 25,34 | ||||
| 2026-02-12 | 13F | Steward Partners Investment Advisory, Llc | 35 | 0,00 | 1 | 0,00 | ||||
| 2026-02-13 | 13F | Integrated Wealth Concepts LLC | 0 | -100,00 | 0 | -100,00 | ||||
| 2026-04-20 | 13F | Ritholtz Wealth Management | 41.072 | -27,73 | 1.070 | -38,14 | ||||
| 2026-02-06 | 13F | Bare Financial Services, Inc | 66 | 0,00 | 2 | 100,00 | ||||
| 2026-02-13 | 13F | Parkside Financial Bank & Trust | 180 | 0,00 | 5 | 0,00 | ||||
| 2026-02-17 | 13F | Advisor Group Holdings, Inc. | 1.043 | -12,65 | 32 | -11,43 | ||||
| 2026-04-22 | 13F | Summerhill Capital Management lnc. | 123.302 | 0,06 | 3.204 | -14,56 | ||||
| 2026-02-12 | 13F | Dimensional Fund Advisors Lp | 1.855.167 | 44,90 | 56.438 | 48,73 | ||||
| 2026-02-10 | 13F | Bnp Paribas Arbitrage, Sa | 5.801 | -3,93 | 176 | -1,12 | ||||
| 2026-02-05 | 13F | Bessemer Group Inc | 1.031 | -81,41 | 0 | |||||
| 2026-01-14 | 13F | Clarius Group, LLC | 9.723 | 0,00 | 296 | 2,43 | ||||
| 2026-02-13 | 13F | Royal London Asset Management Ltd | 14.011 | 0,00 | 426 | 2,65 | ||||
| 2026-02-13 | 13F | OMERS ADMINISTRATION Corp | 14.160 | 431 | ||||||
| 2026-02-17 | 13F | Quantinno Capital Management LP | 107.699 | 65,98 | 3.276 | 70,36 | ||||
| 2026-02-12 | 13F | New York State Common Retirement Fund | 1.033.504 | 0,00 | 31.439 | 2,63 | ||||
| 2025-11-14 | 13F | Trexquant Investment LP | 0 | -100,00 | 0 | -100,00 | ||||
| 2026-02-17 | 13F | Boothbay Fund Management, Llc | 0 | -100,00 | 0 | |||||
| 2026-04-20 | 13F | Assenagon Asset Management S.A. | 29.851 | -43,85 | 776 | -52,07 | ||||
| 2026-01-29 | 13F | UBS Group AG | 509.112 | -22,27 | 15.487 | -20,22 | ||||
| 2025-10-30 | 13F | Twin Peaks Wealth Advisors, LLC | 0 | -100,00 | 0 | |||||
| 2026-02-12 | 13F | Bank Of Nova Scotia Trust Co | 117.602 | 206,33 | 3.577 | 214,60 | ||||
| 2026-02-11 | 13F | LPL Financial LLC | 64.023 | 18,52 | 1.948 | 21,61 | ||||
| 2026-04-20 | 13F | Jfs Wealth Advisors, Llc | 76 | 0,00 | 2 | -50,00 | ||||
| 2026-03-20 | 13F | Purpose Unlimited Inc. | 2.433 | 74 | ||||||
| 2026-02-13 | 13F | Manufacturers Life Insurance Company, The | 0 | -100,00 | 0 | |||||
| 2026-02-12 | 13F | Swiss National Bank | 807.500 | -7,85 | 24.607 | -5,21 | ||||
| 2026-02-17 | 13F | Wiley Bros.-aintree Capital, Llc | 0 | -100,00 | 0 | |||||
| 2026-02-13 | 13F | JustInvest LLC | 20.658 | -4,28 | 628 | -1,72 | ||||
| 2026-02-17 | 13F | Browning West Lp | 12.620.233 | -8,12 | 383.907 | -5,70 | ||||
| 2026-02-04 | 13F | Dogwood Wealth Management LLC | 64 | 0,00 | 2 | 0,00 | ||||
| 2026-02-11 | 13F | Westerkirk Capital Inc. | 900 | -93,28 | 27 | -93,20 | ||||
| 2026-02-12 | 13F | Northwest & Ethical Investments L.P. | 248.024 | 47,49 | 7.549 | 51,57 | ||||
| 2026-02-13 | 13F | Macquarie Group Ltd | 0 | -100,00 | 0 | |||||
| 2026-02-13 | 13F | SRS Capital Advisors, Inc. | 1.102 | 7,93 | 34 | 10,00 | ||||
| 2026-04-16 | 13F | Stanley-Laman Group, Ltd. | 197.404 | 1,43 | 5.142 | -13,14 | ||||
| 2026-04-15 | 13F | Addenda Capital Inc. | 366.816 | 1,12 | 13.286 | -12,25 | ||||
| 2026-02-09 | 13F | Hantz Financial Services, Inc. | 84.143 | -5,22 | 3 | 0,00 | ||||
| 2026-02-12 | 13F | BlackRock, Inc. | 411.879 | 4,29 | 12.529 | 7,04 | ||||
| 2026-02-05 | 13F | Td Private Client Wealth Llc | 24 | 1 | ||||||
| 2026-02-13 | 13F | Verition Fund Management LLC | 53.860 | -15,25 | 1.638 | -13,01 | ||||
| 2026-02-13 | 13F | Smartleaf Asset Management LLC | 150 | 0,00 | 5 | 0,00 | ||||
| 2026-02-17 | 13F | Gotham Asset Management, LLC | 0 | -100,00 | 0 | |||||
| 2026-01-26 | 13F | Cwm, Llc | 1.926 | 1,85 | 0 | |||||
| 2026-02-09 | 13F | Geode Capital Management, Llc | 2.777.070 | 6,45 | 84.082 | 9,55 | ||||
| 2026-02-10 | 13F | Goldman Sachs Group Inc | 2.182.384 | -27,73 | 66.388 | -25,82 | ||||
| 2026-02-17 | 13F | Holocene Advisors, LP | 0 | -100,00 | 0 | |||||
| 2026-02-12 | 13F | CIBC Private Wealth Group, LLC | 0 | -100,00 | 0 | -100,00 | ||||
| 2025-10-28 | 13F | Arlington Trust Co LLC | 0 | -100,00 | 0 | |||||
| 2026-02-17 | 13F | Susquehanna International Group, Llp | Put | 0 | -100,00 | 0 | ||||
| 2025-10-28 | 13F | BRYN MAWR TRUST Co | 764 | 45,52 | 23 | 46,67 | ||||
| 2026-04-17 | 13F | Stephenson National Bank & Trust | 1.034 | -31,57 | 27 | -42,22 | ||||
| 2026-02-13 | 13F | Storgate, LLC | 16.497 | 502 | ||||||
| 2026-02-17 | 13F | Citadel Advisors Llc | Put | 0 | -100,00 | 0 | ||||
| 2026-02-17 | 13F | AYAL Capital Advisors Ltd | 13.500 | 411 | ||||||
| 2026-02-17 | 13F | Susquehanna International Group, Llp | 47.533 | -69,88 | 1.446 | -69,10 | ||||
| 2026-02-12 | 13F | Skopos Labs, Inc. | 16.477 | 514 | ||||||
| 2026-02-12 | 13F | Nuveen, LLC | 212.662 | 0,00 | 6.476 | 2,81 | ||||
| 2026-04-20 | 13F | Cardinal Point Capital Management, ULC | 55.261 | 138,34 | 1.436 | 103,26 | ||||
| 2026-04-07 | 13F | Signaturefd, Llc | 12.319 | 3,45 | 321 | -11,60 | ||||
| 2026-02-10 | 13F | Bank of New York Mellon Corp | 286.239 | -3,01 | 8.707 | -0,46 | ||||
| 2026-02-17 | 13F | Aqr Capital Management Llc | 42.077 | 378,96 | 1.280 | 391,92 | ||||
| 2026-04-13 | 13F | Massmutual Trust Co Fsb/adv | 455 | 4,84 | 12 | -15,38 | ||||
| 2026-01-30 | 13F | Us Bancorp \de\ | 10.774 | 4,61 | 328 | 7,21 | ||||
| 2026-02-18 | 13F | Vident Advisory, LLC | 33.283 | 6,26 | 1.013 | 9,28 | ||||
| 2025-11-13 | 13F | Magnetar Financial LLC | 0 | -100,00 | 0 | |||||
| 2026-02-18 | 13F | Mackenzie Financial Corp | 13.390.611 | -0,43 | 409.700 | 2,90 | ||||
| 2026-02-17 | 13F | SIG North Trading, ULC | Put | 10.100 | -22,31 | 307 | -20,26 | |||
| 2026-02-13 | 13F | Transamerica Financial Advisors, Inc. | 1.267 | 170,73 | 39 | 192,31 | ||||
| 2026-02-17 | 13F | SIG North Trading, ULC | Call | 22.800 | -26,21 | 694 | -24,26 | |||
| 2025-11-14 | 13F | Credit Agricole S A | 0 | -100,00 | 0 | |||||
| 2026-02-10 | 13F | Td Asset Management Inc | 2.704.860 | 82,48 | 82.364 | 87,61 | ||||
| 2026-02-17 | 13F | SIG North Trading, ULC | 39.498 | 1.202 | ||||||
| 2026-02-04 | 13F | First Eagle Investment Management, LLC | 935.036 | -0,24 | 28.436 | 2,48 | ||||
| 2026-02-13 | 13F | Aviso Financial Inc. | 0 | -100,00 | 0 | |||||
| 2026-02-17 | 13F | Caisse De Depot Et Placement Du Quebec | 30.917.402 | 0,00 | 941.450 | 2,81 | ||||
| 2026-02-17 | 13F | Investment Management Corp of Ontario | 39.419 | 230,25 | 1.199 | 239,66 | ||||
| 2026-01-29 | 13F | Montrusco Bolton Investments Inc. | 565.500 | 0,00 | 17.220 | 2,81 | ||||
| 2026-02-04 | 13F | Asahi Life Asset Management Co., Ltd. | 7.390 | 225 | ||||||
| 2026-04-20 | 13F | Ronald Blue Trust, Inc. | 152 | -1,94 | 4 | -25,00 | ||||
| 2026-02-12 | 13F | Quadrant Capital Group Llc | 23.299 | 0,00 | 709 | 2,61 | ||||
| 2026-02-12 | 13F | Wealthspire Advisors, LLC | 0 | -100,00 | 0 | |||||
| 2026-04-17 | 13F | Bell Investment Advisors, Inc | 116 | 0,00 | 3 | 0,00 | ||||
| 2026-02-11 | 13F | Group One Trading, L.p. | Call | 1.000 | 30 | |||||
| 2026-04-22 | 13F | Pictet Asset Management Holding SA | 173.882 | -1,94 | 4.513 | -16,43 | ||||
| 2026-02-11 | 13F | Group One Trading, L.p. | 500 | -70,59 | 15 | -70,00 | ||||
| 2026-02-11 | 13F | Picton Mahoney Asset Management | 957.687 | 29.165 | ||||||
| 2026-02-10 | 13F | Natixis Advisors, L.p. | 154.909 | -30,34 | 5 | -33,33 | ||||
| 2026-02-11 | 13F | CLARET ASSET MANAGEMENT Corp | 81.305 | -0,42 | 2 | 0,00 | ||||
| 2026-04-06 | 13F | GAMMA Investing LLC | 72 | 2 | ||||||
| 2026-01-28 | 13F | DekaBank Deutsche Girozentrale | 32.840 | 0,00 | 1 | |||||
| 2026-02-13 | 13F | Ubs Asset Management Americas Inc | 803 | 24 | ||||||
| 2026-02-13 | 13F | Barclays Plc | 13.385 | -94,03 | 407 | -93,87 | ||||
| 2025-11-14 | 13F | Jain Global LLC | 0 | -100,00 | 0 | -100,00 | ||||
| 2025-11-14 | 13F | Balyasny Asset Management Llc | 0 | -100,00 | 0 | -100,00 | ||||
| 2026-04-13 | 13F | Mather Group, Llc. | 584 | 15 | ||||||
| 2025-11-12 | 13F | Simplex Trading, Llc | Call | 0 | -100,00 | 0 | ||||
| 2026-02-11 | 13F | Global Alpha Capital Management Ltd. | 720.900 | 21.923 | ||||||
| 2026-04-10 | 13F | Henry James International Management Inc. | 182.218 | 0,00 | 4.747 | -14,38 | ||||
| 2026-02-02 | 13F | Truist Financial Corp | 15.064 | 4,81 | 458 | 7,51 | ||||
| 2026-02-17 | 13F | Susquehanna Portfolio Strategies, LLC | 19.600 | 0,00 | 596 | 2,76 | ||||
| 2026-02-17 | 13F | Citadel Advisors Llc | Call | 8.900 | -23,28 | 271 | -21,28 | |||
| 2026-01-27 | 13F | Zurcher Kantonalbank (Zurich Cantonalbank) | 168.702 | -3,13 | 5.137 | -0,41 | ||||
| 2026-02-17 | 13F | Millennium Management Llc | 48.283 | -86,39 | 1.469 | -86,04 | ||||
| 2026-02-17 | 13F | Citadel Advisors Llc | 245.770 | 64,21 | 7.476 | 68,53 | ||||
| 2026-02-13 | 13F | Citigroup Inc | 108.588 | -66,33 | 3.307 | -65,39 | ||||
| 2026-02-10 | 13F | Dynasty Wealth Management, Llc | 8.201 | 3,11 | 249 | 5,96 | ||||
| 2026-02-17 | 13F | Laird Norton Trust Company, Llc | 16.076 | 489 | ||||||
| 2025-11-13 | 13F | Renaissance Technologies Llc | 0 | -100,00 | 0 | |||||
| 2026-02-02 | 13F | Principal Financial Group Inc | 24.000 | -6,98 | 731 | -4,45 | ||||
| 2026-02-11 | 13F | Metis Global Partners, LLC | 18.345 | 11,26 | 558 | 14,14 | ||||
| 2026-01-20 | 13F | Cromwell Holdings LLC | 2.120 | 0,00 | 64 | 3,23 | ||||
| 2026-02-10 | 13F | Jupiter Asset Management Ltd | 176.669 | -30,64 | 5.380 | -28,70 | ||||
| 2026-02-04 | 13F | Pacer Advisors, Inc. | 24.385 | 2.742,07 | 4.675 | 18.600,00 | ||||
| 2026-02-02 | 13F | Montag A & Associates Inc | 408 | 0,00 | 12 | 0,00 | ||||
| 2026-02-05 | 13F | Heathbridge Capital Management Ltd. | 377.600 | -1,53 | 11.499 | 1,34 | ||||
| 2026-02-12 | 13F | Federation des caisses Desjardins du Quebec | 1.804.400 | 58,36 | 54.819 | 65,37 | ||||
| 2026-02-02 | 13F | Cornerstone Planning Group LLC | 41 | 0,00 | 1 | 0,00 | ||||
| 2026-01-29 | 13F | Vanguard Group Inc | 13.380.797 | 1,74 | 406.923 | 4,49 | ||||
| 2026-02-17 | 13F | Public Employees Retirement System Of Ohio | 19.033 | 3,54 | 579 | 6,25 | ||||
| 2026-02-18 | 13F | GWM Advisors LLC | 795 | 0,00 | 24 | 4,35 | ||||
| 2026-02-06 | 13F | Cullen/frost Bankers, Inc. | 456 | 24,59 | 14 | 30,00 | ||||
| 2025-11-14 | 13F | Eqis Capital Management, Inc. | 0 | -100,00 | 0 | |||||
| 2026-03-26 | 13F | Leonteq Securities AG | 0 | -100,00 | 0 | |||||
| 2026-02-10 | 13F | Hillsdale Investment Management Inc. | 104.185 | 49,64 | 3.174 | 53,95 | ||||
| 2025-11-19 | 13F | Caitong International Asset Management Co., Ltd | 0 | -100,00 | 0 | |||||
| 2026-02-12 | 13F | Jane Street Group, Llc | 14.053 | -50,47 | 427 | -49,23 | ||||
| 2026-04-13 | 13F | Creative Financial Designs Inc /adv | 0 | -100,00 | 0 | |||||
| 2026-02-12 | 13F | Brown Brothers Harriman & Co | 1.554 | 47 | ||||||
| 2026-02-11 | 13F | Capital International Investors | 964.743 | -26,48 | 29.338 | -24,50 | ||||
| 2026-02-13 | 13F | Natixis | 2.576 | -1,00 | 78 | 1,30 | ||||
| 2026-04-15 | 13F | Avanza Fonder AB | 129.526 | 0,00 | 4.691 | -13,23 | ||||
| 2026-02-17 | 13F | Utah Retirement Systems | 35.728 | 0,00 | 1.088 | 2,74 | ||||
| 2026-02-13 | 13F | Morgan Stanley | 2.059.644 | 114,00 | 62.654 | 119,63 | ||||
| 2026-02-11 | 13F | Cerity Partners LLC | 13.374 | 14,05 | 407 | 17,00 | ||||
| 2026-02-13 | 13F | Umb Bank N A/mo | 70 | 0,00 | 2 | 0,00 | ||||
| 2025-11-14 | 13F | Susquehanna Advisors Group, Inc. | 0 | -100,00 | 0 | |||||
| 2026-02-03 | 13F | Sequoia Financial Advisors, LLC | 49.872 | -0,41 | 1.517 | 2,22 | ||||
| 2026-02-13 | 13F | Arrowstreet Capital, Limited Partnership | 59.246 | -89,63 | 1.802 | -89,35 | ||||
| 2026-02-17 | 13F/A | Militia Capital Partners, LP | 0 | -100,00 | 0 | -100,00 | ||||
| 2026-02-17 | 13F | Caption Management, LLC | 0 | -100,00 | 0 | |||||
| 2026-04-13 | 13F | IFP Advisors, Inc | 0 | -100,00 | 0 | |||||
| 2026-02-03 | 13F | SBI Securities Co., Ltd. | 29 | 0,00 | 1 | |||||
| 2025-11-12 | 13F | NewSquare Capital LLC | 0 | -100,00 | 0 | |||||
| 2026-04-16 | 13F | Capital Advisors, Ltd. LLC | 625 | 0,00 | 0 | |||||
| 2026-02-12 | 13F | Snyder Capital Management L P | 5.441.338 | 0,56 | 165.526 | 3,20 | ||||
| 2026-04-14 | 13F | Tradewinds Capital Management, LLC | 60 | 2 | ||||||
| 2025-11-14 | 13F | Susquehanna International Group, Llp | Call | 0 | -100,00 | 0 | -100,00 | |||
| 2026-02-06 | 13F | Global Retirement Partners, LLC | 0 | -100,00 | 0 | |||||
| 2026-02-13 | 13F | Sycale Advisors (NY) LLC | Call | 0 | -100,00 | 0 | -100,00 | |||
| 2026-02-17 | 13F | Jones Financial Companies Lllp | 73.208 | 6,20 | 2.227 | 13,28 | ||||
| 2025-11-13 | 13F | Dynamic Technology Lab Private Ltd | 0 | -100,00 | 0 | -100,00 | ||||
| 2026-02-11 | 13F | Deutsche Bank Ag\ | 278.277 | -0,65 | 8.465 | 1,96 | ||||
| 2026-02-12 | 13F | APG Asset Management N.V. | 166.216 | -4,53 | 4.309 | -1,80 | ||||
| 2026-01-29 | 13F | D.a. Davidson & Co. | 52.456 | 32,69 | 1.596 | 36,21 | ||||
| 2026-02-17 | 13F | FIL Ltd | 10.422.522 | 21,93 | 316.955 | 25,22 | ||||
| 2026-04-14 | 13F | Nbc Securities, Inc. | 16.953 | -0,97 | 442 | -15,19 | ||||
| 2026-02-09 | 13F | Legal & General Group Plc | 2.160.185 | 14,96 | 65.779 | 18,19 | ||||
| 2026-02-11 | 13F | Parallel Advisors, LLC | 1.712 | 2,70 | 52 | 6,12 | ||||
| 2026-02-17 | 13F | Northern Trust Corp | 256.116 | 0,05 | 7.791 | 2,69 | ||||
| 2025-11-13 | 13F | Marshall Wace, Llp | 261.968 | 109,77 | 7.765 | 112,42 | ||||
| 2025-11-14 | 13F | AXA Investment Managers S.A. | 1.983 | 59 | ||||||
| 2026-01-27 | 13F | TD Waterhouse Canada Inc. | 192.636 | 61,18 | 5.849 | 69,16 | ||||
| 2026-02-05 | 13F | S&co Inc | 10.000 | 0,00 | 0 | |||||
| 2026-02-13 | 13F | Pinnacle Wealth Planning Services, Inc. | 49 | 1 | ||||||
| 2025-10-27 | 13F | First Horizon Corp | 0 | -100,00 | 0 | |||||
| 2025-11-14 | 13F | Cooper Creek Partners Management Llc | 0 | -100,00 | 0 | -100,00 | ||||
| 2025-11-07 | 13F | Shell Asset Management Co | 20.258 | -68,78 | 1 | -100,00 | ||||
| 2026-02-17 | 13F | Auxier Asset Management | 51.330 | -0,96 | 1.561 | 1,63 | ||||
| 2026-02-13 | 13F | Alberta Investment Management Corp | 0 | -100,00 | 0 | |||||
| 2026-04-13 | 13F | Salem Investment Counselors Inc | 12 | 0 | ||||||
| 2025-11-14 | 13F | Graham Capital Management, L.P. | 0 | -100,00 | 0 | |||||
| 2026-04-09 | 13F | Pacifica Partners Inc. | 0 | -100,00 | 0 | |||||
| 2026-02-12 | 13F | Pembroke Management, LTD | 61.864 | 43,00 | 1.882 | 46,72 | ||||
| 2026-02-10 | 13F | Sittner & Nelson, Llc | 500 | 16 | ||||||
| 2025-10-28 | 13F | Campbell & CO Investment Adviser LLC | 0 | -100,00 | 0 | -100,00 | ||||
| 2026-02-11 | 13F | Franklin Resources Inc | 120.285 | -5,32 | 3.658 | -2,74 | ||||
| 2026-02-17 | 13F | Numerai GP LLC | 0 | -100,00 | 0 | |||||
| 2026-02-13 | 13F | American Century Companies Inc | 151.611 | -11,74 | 4.611 | -9,36 | ||||
| 2026-02-17 | 13F | Cetera Investment Advisers | 19.062 | 10,31 | 580 | 13,09 | ||||
| 2026-02-17 | 13F | Wellington Management Group Llp | 67.892 | 5,01 | 2.067 | 7,99 | ||||
| 2026-02-17 | 13F | Royal Bank Of Canada | Put | 100.000 | 3.042 | |||||
| 2026-02-06 | 13F | Intrust Bank Na | 0 | -100,00 | 0 | |||||
| 2026-02-17 | 13F | J. Goldman & Co LP | 0 | -100,00 | 0 | |||||
| 2026-02-17 | 13F | Royal Bank Of Canada | 6.246.058 | -16,74 | 190.004 | -14,55 | ||||
| 2025-11-21 | 13F | Nebula Research & Development LLC | 0 | -100,00 | 0 | -100,00 | ||||
| 2026-03-16 | 13F/A | Rockefeller Capital Management L.P. | 310 | 1.140,00 | 9 | |||||
| 2026-02-06 | 13F | Principle Wealth Partners Llc | 13.152 | 0,00 | 400 | 2,83 | ||||
| 2026-02-10 | 13F | Transatlantique Private Wealth Llc | 33.641 | -0,32 | 1.023 | 2,30 | ||||
| 2026-02-17 | 13F | Raymond James Financial Inc | 102.491 | 2,24 | 3.118 | 4,91 | ||||
| 2026-02-10 | 13F | Acadian Asset Management Llc | 0 | -100,00 | 0 | |||||
| 2026-02-11 | 13F | Capital World Investors | 0 | -100,00 | 0 | -100,00 | ||||
| 2026-02-03 | 13F | Crossmark Global Holdings, Inc. | 11.218 | -27,53 | 341 | -25,55 | ||||
| 2026-02-13 | 13F | Neuberger Berman Group LLC | 12.798 | -62,74 | 390 | -61,75 | ||||
| 2026-01-15 | 13F | Mn Services Vermogensbeheer B.V. | 116.311 | 2,85 | 4 | 0,00 | ||||
| 2026-01-21 | 13F | Sound Income Strategies, LLC | 48 | 0,00 | 2 | 0,00 | ||||
| 2026-01-30 | 13F | Bogart Wealth, LLC | 42 | 0,00 | 1 | 0,00 | ||||
| 2026-02-12 | 13F | Hrt Financial Lp | 28.756 | 208,64 | 1 | |||||
| 2026-02-12 | 13F | Scotia Capital Inc. | 160.749 | 15,58 | 4.880 | 20,73 | ||||
| 2026-02-12 | 13F | Aviva Plc | 825.868 | 5,89 | 25.135 | 8,93 | ||||
| 2026-02-17 | 13F | Two Sigma Advisers, Lp | 34.556 | -86,11 | 1.051 | -85,75 | ||||
| 2026-02-12 | 13F | Bank Of Montreal /can/ | 3.789.904 | -12,83 | 115.255 | -10,45 | ||||
| 2026-02-13 | 13F | BNP Paribas Asset Management Holding S.A. | 6.203 | 0 | ||||||
| 2026-02-03 | 13F | K.J. Harrison & Partners Inc | 40.131 | 1.222 | ||||||
| 2026-02-10 | 13F | Rothschild Investment Llc | 260 | 0,00 | 8 | 0,00 | ||||
| 2026-02-19 | 13F | CI Private Wealth, LLC | 16.134 | -2,40 | 488 | -0,41 | ||||
| 2026-02-13 | 13F | MAI Capital Management | 48 | 1 | ||||||
| 2026-02-17 | 13F | Scopia Capital Management Lp | 0 | -100,00 | 0 | -100,00 | ||||
| 2026-02-19 | 13F | Invesco Ltd. | 2.432.117 | -0,28 | 73.985 | 2,35 | ||||
| 2026-04-06 | 13F | Washington Trust Advisors, Inc. | 209 | -8,73 | 5 | -16,67 | ||||
| 2026-02-06 | 13F | Larson Financial Group LLC | 116 | 4 | ||||||
| 2026-02-10 | 13F | CIBC World Markets Inc. | 1.526.360 | -21,17 | 46.417 | -19,02 | ||||
| 2026-02-11 | 13F | Letko, Brosseau & Associates Inc | 3.219.140 | -0,98 | 98.024 | 1,80 | ||||
| 2026-04-24 | 13F | Abacus Wealth Partners, LLC | 12.613 | 2,30 | 329 | -12,53 | ||||
| 2026-02-11 | 13F | Simplex Trading, Llc | 642 | -94,64 | 20 | |||||
| 2026-02-17 | 13F | Two Sigma Investments, Lp | 315.150 | -29,91 | 9.587 | -28,07 | ||||
| 2025-11-13 | 13F | Riggs Asset Managment Co. Inc. | 0 | -100,00 | 0 | |||||
| 2025-11-14 | 13F | Wetherby Asset Management Inc | 11.707 | 0,30 | 347 | 1,47 | ||||
| 2026-02-11 | 13F | Simplex Trading, Llc | Put | 6.100 | -1,61 | 186 | ||||
| 2026-02-13 | 13F | Rhumbline Advisers | 70 | 0,00 | 2 | 0,00 | ||||
| 2026-02-13 | 13F | Pathstone Holdings, LLC | 20.919 | -7,47 | 636 | -5,07 | ||||
| 2026-02-17 | 13F | Artisan Partners Limited Partnership | 2.694.232 | -7,07 | 81.935 | -4,54 | ||||
| 2026-01-29 | 13F | Sanctuary Advisors, LLC | 12.596 | 3,03 | 383 | 5,80 | ||||
| 2026-02-17 | 13F | Bank Of America Corp /de/ | 1.393.737 | -22,04 | 42.397 | -19,99 | ||||
| 2026-02-13 | 13F/A | Ontario Teachers Pension Plan Board | 0 | -100,00 | 0 | |||||
| 2026-02-10 | 13F | Godfrey Financial Associates, Inc. | 19 | 1 | ||||||
| 2026-02-13 | 13F | Beutel, Goodman & Co Ltd. | 6.679.818 | -7,18 | 203 | -4,69 | ||||
| 2026-02-11 | 13F | Ramirez Asset Management, Inc. | 96 | 3 | ||||||
| 2026-02-09 | 13F | Waratah Capital Advisors Ltd. | 312.748 | 9.514 | ||||||
| 2026-02-09 | 13F | Waratah Capital Advisors Ltd. | Call | 100.000 | 3.042 | |||||
| 2026-01-08 | 13F | True Wealth Design, LLC | 0 | -100,00 | 0 | |||||
| 2026-02-12 | 13F | Callan Family Office, LLC | 39.115 | 1.190 | ||||||
| 2025-11-14 | 13F | Lazard Asset Management Llc | 0 | -100,00 | 0 | -100,00 | ||||
| 2026-02-03 | 13F | Generali Asset Management SPA SGR | 0 | -100,00 | 0 | |||||
| 2026-02-13 | 13F | Bank Of Nova Scotia | 2.005.841 | -12,13 | 60.997 | -9,77 | ||||
| 2026-02-09 | 13F | Frazier Financial Advisors, LLC | 0 | -100,00 | 0 | |||||
| 2026-02-13 | 13F | Mufg Securities (canada), Ltd. | 489.597 | -7,72 | 14.892 | -5,19 | ||||
| 2026-02-17 | 13F | Toronto Dominion Bank | 865.811 | 31,24 | 26.331 | 34,88 | ||||
| 2026-02-23 | 13F | Mv Capital Management, Inc. | 2 | 0 | ||||||
| 2026-04-16 | 13F | BI Asset Management Fondsmaeglerselskab A/S | 119.058 | 458,28 | 3 | |||||
| 2026-02-10 | 13F | Norges Bank | 3.234.907 | 98.377 | ||||||
| 2026-02-10 | 13F | Envestnet Asset Management Inc | 216.513 | 2,76 | 6.586 | 5,46 | ||||
| 2026-02-11 | 13F | Tacita Capital Inc | 1.500 | 0,00 | 46 | 2,27 | ||||
| 2026-02-17 | 13F | Janus Henderson Group Plc | 49.104 | 5,14 | 1.501 | 9,56 | ||||
| 2026-02-02 | 13F | Danske Bank A/s | 16.820 | -7,24 | 512 | -3,40 | ||||
| 2025-11-03 | 13F | Phoenix Holdings Ltd. | 0 | -100,00 | 0 | |||||
| 2026-04-23 | 13F | Lansforsakringar Fondforvaltning AB (publ) | 63.822 | 1,81 | 1.656 | -13,21 | ||||
| 2026-02-13 | 13F | Kestra Advisory Services, LLC | 1.357 | 41 | ||||||
| 2026-02-04 | 13F | Plato Investment Management Ltd | 18.052 | -52,37 | 552 | -50,54 | ||||
| 2025-11-14 | 13F | ExodusPoint Capital Management, LP | 0 | -100,00 | 0 | |||||
| 2026-02-17 | 13F | D. E. Shaw & Co., Inc. | 140.099 | -14,71 | 4.261 | -12,40 | ||||
| 2026-02-13 | 13F | BRITISH COLUMBIA INVESTMENT MANAGEMENT Corp | 168.540 | -8,66 | 5.125 | -6,17 | ||||
| 2026-04-08 | 13F | Legacy Wealth Asset Management, LLC | 30.721 | -0,45 | 800 | -14,71 | ||||
| 2026-02-17 | 13F | Toronto Dominion Bank | Call | 2.000 | 33,33 | 61 | 36,36 | |||
| 2026-02-17 | 13F | Anson Funds Management LP | 145.000 | -6,45 | 4.406 | -3,99 | ||||
| 2025-11-12 | 13F | First Trust Advisors Lp | 0 | -100,00 | 0 | -100,00 | ||||
| 2025-11-14 | 13F | Aigen Investment Management, Lp | 0 | -100,00 | 0 | |||||
| 2025-10-30 | 13F | Ridgewood Investments LLC | 0 | -100,00 | 0 | -100,00 | ||||
| 2026-02-12 | 13F | Xponance, Inc. | 12.370 | 377 | ||||||
| 2026-02-13 | 13F | Wells Fargo & Company/mn | 419.403 | 4,06 | 12.750 | 6,84 | ||||
| 2026-02-18 | 13F | State of Tennessee, Treasury Department | 168.854 | -8,30 | 5.442 | -0,22 | ||||
| 2026-02-13 | 13F | Sycale Advisors (NY) LLC | 1.240.182 | -20,32 | 37.726 | -18,22 | ||||
| 2026-02-17 | 13F | Select Equity Group, L.P. | 7.586.679 | 9,45 | 231.018 | 12,53 | ||||
| 2026-02-17 | 13F | Canada Pension Plan Investment Board | 2.172.978 | -0,17 | 66.083 | 2,55 | ||||
| 2025-11-12 | 13F | Forge First Asset Management Inc. | 191.700 | 5.673 | ||||||
| 2026-02-10 | 13F | Connor, Clark & Lunn Investment Management Ltd. | 0 | -100,00 | 0 | |||||
| 2026-01-27 | 13F | WealthCollab, LLC | 24 | 0,00 | 1 | |||||
| 2026-02-13 | 13F | Stifel Financial Corp | 112.093 | 21,91 | 3.410 | 25,10 | ||||
| 2026-02-11 | 13F | O'shaughnessy Asset Management, Llc | 134.701 | -23,46 | 4.097 | -21,42 | ||||
| 2026-02-11 | 13F | Fiera Capital Corp | 974.295 | 5.035,71 | 29.610 | 5.178,07 | ||||
| 2026-02-17 | 13F | Amundi | 370.808 | -9,97 | 11.280 | -5,27 | ||||
| 2026-02-17 | 13F | Man Group plc | 85.181 | -0,23 | 2.594 | 2,57 | ||||
| 2026-02-13 | 13F | Charles Schwab Investment Management Inc | 824.092 | -0,23 | 25.094 | 2,58 | ||||
| 2026-02-17 | 13F | Cresset Asset Management, LLC | 717.855 | 17,79 | 21.837 | 20,89 | ||||
| 2026-02-11 | 13F | Zions Bancorporation, National Association /ut/ | 82 | 0,00 | 2 | 0,00 | ||||
| 2026-02-17 | 13F | Fmr Llc | 85.053 | -9,83 | 2.587 | -7,41 | ||||
| 2026-02-12 | 13F | Triumph Capital Management | 15 | 0,00 | 0 | |||||
| 2025-11-07 | 13F | Sierra Ocean, Llc | 0 | -100,00 | 0 | -100,00 | ||||
| 2026-04-23 | 13F | Oppenheimer Asset Management Inc. | 21.112 | 9,77 | 550 | -6,15 | ||||
| 2026-02-17 | 13F | Ameriprise Financial Inc | 14.383 | 67,87 | 590 | 71,01 | ||||
| 2026-02-17 | 13F | Atom Investors LP | 0 | -100,00 | 0 | -100,00 | ||||
| 2026-02-10 | 13F | PCJ Investment Counsel Ltd. | 760.585 | 42,50 | 23.131 | 46,36 | ||||
| 2026-01-30 | 13F/A | M&t Bank Corp | 63.573 | 0,19 | 1.934 | 2,82 | ||||
| 2026-04-21 | 13F | Financial Consulate, Inc | 8 | -20,00 | 0 | |||||
| 2026-02-17 | 13F | Toronto Dominion Bank | Put | 0 | -100,00 | 0 | ||||
| 2026-02-11 | 13F | OneAscent Investment Solutions LLC | 29.006 | 0,00 | 882 | 2,68 | ||||
| 2026-02-17 | 13F | Alliancebernstein L.p. | 28.643 | -0,07 | 871 | 2,59 | ||||
| 2026-02-13 | 13F | 1832 Asset Management L.P. | 22.201.969 | 1.343,83 | 675.384 | 1.381,85 | ||||
| 2026-02-03 | 13F | Ballentine Partners, LLC | 6.822 | -27,84 | 208 | -26,07 | ||||
| 2026-02-13 | 13F | Kilter Group LLC | 8 | 0,00 | 0 | |||||
| 2026-02-13 | 13F | Bridgewater Associates, LP | 0 | -100,00 | 0 | |||||
| 2026-02-10 | 13F | CIBC Asset Management Inc | 1.107.936 | 243,93 | 34.376 | 260,83 | ||||
| 2026-02-13 | 13F | Mariner, LLC | 11.199 | 46,09 | 341 | 49,78 | ||||
| 2026-02-06 | 13F/A | Rathbone Brothers plc | 52.000 | 0,00 | 1.583 | 2,79 | ||||
| 2026-02-10 | 13F | Gulf International Bank (UK) Ltd | 17.801 | 0,00 | 1 | |||||
| 2025-11-12 | 13F | Nomura Asset Management Co Ltd | 0 | 0 | ||||||
| 2026-04-23 | 13F | Oppenheimer & Co Inc | 7.750 | 3,33 | 202 | -11,84 | ||||
| 2026-02-10 | 13F/A | Northwestern Mutual Wealth Management Co | 229 | -32,25 | 7 | -40,00 | ||||
| 2026-02-10 | 13F | Forsta Ap-fonden | 196.200 | -0,20 | 5.974 | 2,61 | ||||
| 2026-02-12 | 13F | Principal Securities, Inc. | 0 | -100,00 | 0 | |||||
| 2026-02-13 | 13F | National Bank Of Canada /fi/ | 3.706.305 | -10,37 | 112.528 | -7,39 | ||||
| 2026-02-06 | 13F | EverSource Wealth Advisors, LLC | 1.211 | -34,79 | 37 | -34,55 |