Grundlæggende statistik
| Institutionelle aktier (lange) | 133.033.048 - 93,05% (ex 13D/G) - change of -39,50MM shares -22,90% MRQ |
| Institutionel værdi (lang) | $ 2.097.447 USD ($1000) |
Institutionelt ejerskab og aktionærer
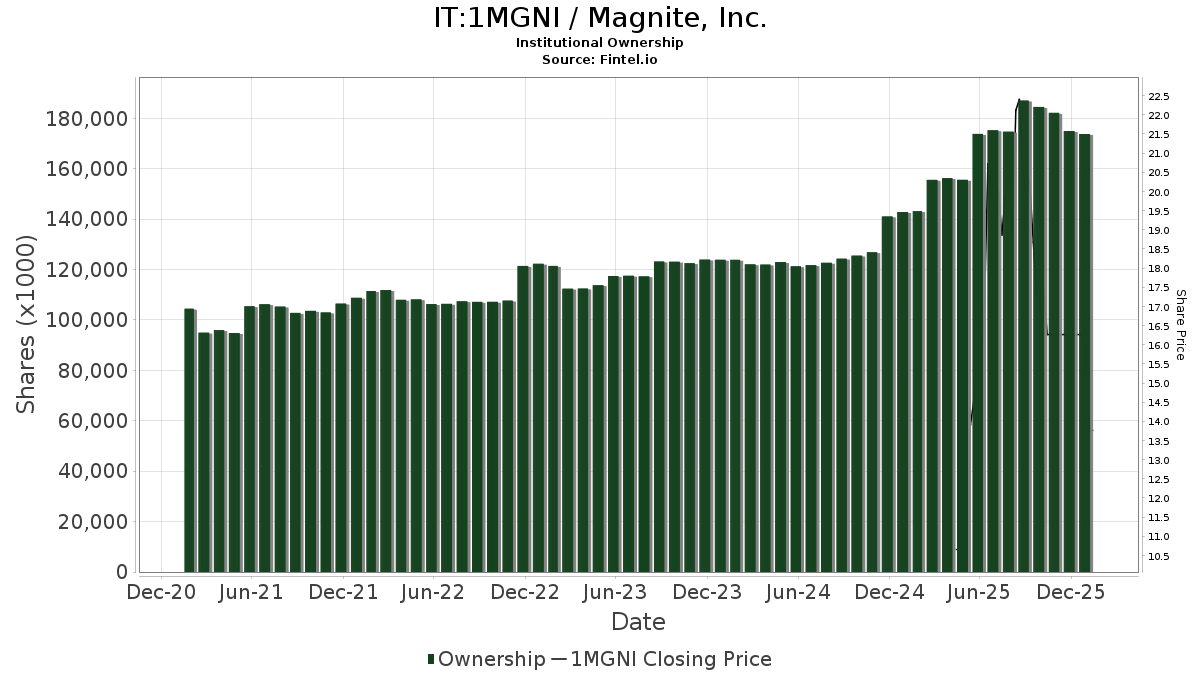
Magnite, Inc. (IT:1MGNI) har 307 institutionelle ejere og aktionærer, der har indsendt 13D/G- eller 13F-formularer til Securities Exchange Commission (SEC). Disse institutioner har i alt 133,033,048 aktier. Største aktionærer omfatter Vanguard Group Inc, Capital Research Global Investors, BlackRock, Inc., Wellington Management Group Llp, Fmr Llc, American Century Companies Inc, Boston Partners, Dimensional Fund Advisors Lp, Nuveen, LLC, and Geode Capital Management, Llc .
Magnite, Inc. (BIT:1MGNI) institutionel ejerskabsstruktur viser aktuelle positioner i virksomheden efter institutioner og fonde, samt seneste ændringer i positionsstørrelse. Større aktionærer kan omfatte individuelle investorer, investeringsforeninger, hedgefonde eller institutioner. Skema 13D angiver, at investoren besidder (eller besidder) mere end 5 % af virksomheden og har til hensigt (eller har til hensigt at) aktivt at forfølge en ændring i forretningsstrategi. Skema 13G indikerer en passiv investering på over 5%.
The share price as of April 30, 2026 is 10,95 / share. Previously, on May 2, 2025, the share price was 10,66 / share. This represents an increase of 2,77% over that period.
Fondens stemningsscore
Fund Sentiment Score (fka Ownership Accumulation Score) finder de aktier, der bliver mest købt af fonde. Det er resultatet af en sofistikeret, multi-faktor kvantitativ model, der identificerer virksomheder med de højeste niveauer af institutionel akkumulering. Scoringsmodellen bruger en kombination af den samlede stigning i oplyste ejere, ændringerne i porteføljeallokeringer i disse ejere og andre målinger. Tallet går fra 0 til 100, hvor højere tal indikerer et højere niveau af akkumulering for sine jævnaldrende, og 50 er gennemsnittet.
Opdateringsfrekvens: Dagligt
Se Ownership Explorer, som giver en liste over højest rangerende virksomheder.
AI+ Ask Fintel’s AI assistant about Magnite, Inc..
Select a question to share a public post with an AI-crafted answer.
Thinking of good questions…
13F og NPORT arkivering
Detaljer om 13F-arkivering er gratis. Detaljer om NP-ansøgninger kræver et premium-medlemskab. Grønne rækker angiver nye positioner. Røde rækker angiver lukkede positioner. Klik på linket ikon for at se den fulde transaktionshistorik.
Opgrader
for at låse premium-data op og eksportere til Excel ![]() .
.
| Fil dato | Kilde | Investor | Type | Gennemsnitlig pris (Øst) |
Aktier | Δ Aktier (%) |
Rapporteret Værdi ($1000) |
Δ Værdi (%) |
Port Alloc (%) |
|
|---|---|---|---|---|---|---|---|---|---|---|
| 2025-11-14 | 13F | Mairs & Power Inc | 0 | -100,00 | 0 | |||||
| 2026-04-24 | 13F | Strs Ohio | 18.500 | -47,44 | 220 | -61,65 | ||||
| 2026-04-09 | 13F | Moody National Bank Trust Division | 53.315 | -44,57 | 633 | -59,45 | ||||
| 2026-04-29 | 13F | Police & Firemen's Retirement System of New Jersey | 40.290 | 8,58 | 479 | -20,60 | ||||
| 2026-02-13 | 13F | Edenbrook Capital, LLC | Call | 1.500.000 | 24.345 | |||||
| 2026-02-12 | 13F | Counterpoint Mutual Funds LLC | 0 | -100,00 | 0 | |||||
| 2026-02-13 | 13F | Edenbrook Capital, LLC | 2.788.036 | 32,11 | 45.250 | -1,55 | ||||
| 2026-02-17 | 13F | EFG International AG | 1.500 | 24 | ||||||
| 2026-02-17 | 13F | Susquehanna International Group, Llp | 307.607 | -49,82 | 4.992 | -62,61 | ||||
| 2026-02-17 | 13F | Susquehanna International Group, Llp | Put | 262.700 | 30,24 | 4.264 | -2,96 | |||
| 2026-02-04 | 13F | Bailard, Inc. | 0 | -100,00 | 0 | |||||
| 2026-02-12 | 13F | Federated Hermes, Inc. | 172.947 | 648,69 | 2.807 | 457,85 | ||||
| 2026-02-17 | 13F | Buckland Partners Management Co LLC | 31.446 | 510 | ||||||
| 2026-02-05 | 13F | Bessemer Group Inc | 462 | 0,00 | 0 | |||||
| 2026-04-23 | 13F | Perkins Capital Management Inc | 119.275 | -2,05 | 1.417 | -28,34 | ||||
| 2025-11-13 | 13F | Capital Fund Management S.a. | Put | 0 | -100,00 | 0 | -100,00 | |||
| 2026-01-23 | 13F | Assetmark, Inc | 18 | -95,32 | 0 | -100,00 | ||||
| 2026-02-11 | 13F | Franklin Resources Inc | 108.970 | -7,25 | 1.769 | -30,88 | ||||
| 2026-02-13 | 13F | State Street Corp | 3.141.991 | 0,49 | 50.995 | -25,12 | ||||
| 2026-01-21 | 13F | Westfuller Advisors, LLC | 0 | -100,00 | 0 | |||||
| 2026-02-17 | 13F | State Of Wisconsin Investment Board | 219.559 | 6,12 | 3.563 | -20,93 | ||||
| 2026-04-29 | 13F | Duncker Streett & Co Inc | 52 | 0,00 | 1 | |||||
| 2026-02-13 | 13F | Kennedy Capital Management, Inc. | 1.435.970 | 18,32 | 23.306 | -11,83 | ||||
| 2026-01-14 | 13F | ORG Partners LLC | 65 | 0,00 | 1 | 0,00 | ||||
| 2026-01-29 | 13F | UBS Group AG | Put | 15.000 | 0,00 | 243 | -25,46 | |||
| 2026-01-29 | 13F | Calamos Advisors LLC | 113.457 | 119,09 | 1.841 | 63,35 | ||||
| 2026-01-29 | 13F | UBS Group AG | Call | 159.000 | 0,00 | 2.581 | -25,50 | |||
| 2026-01-29 | 13F | UBS Group AG | 404.014 | -5,00 | 6.557 | -29,21 | ||||
| 2026-02-17 | 13F | Fmr Llc | 6.701.174 | -60,91 | 108.760 | -70,87 | ||||
| 2026-04-13 | 13F | Ledgewood Wealth Advisors, LLC | 12.577 | -10,78 | 149 | -34,65 | ||||
| 2026-02-13 | 13F | Squarepoint Ops LLC | Call | 12.600 | -38,24 | 204 | -54,05 | |||
| 2026-02-17 | 13F | No Street GP LP | 1.475.000 | 23.939 | ||||||
| 2026-02-09 | 13F | MTM Investment Management, LLC | 275 | -83,29 | 4 | -88,57 | ||||
| 2026-02-13 | 13F | Squarepoint Ops LLC | Put | 1.711.300 | -2,60 | 27.774 | -27,42 | |||
| 2026-02-13 | 13F | Squarepoint Ops LLC | 45.438 | -72,70 | 737 | -79,67 | ||||
| 2026-02-13 | 13F | Prudential Financial Inc | 0 | -100,00 | 0 | |||||
| 2025-11-06 | 13F | Abich Financial Wealth Management LLC | 9 | 0 | ||||||
| 2026-01-12 | 13F | AllSquare Wealth Management LLC | 2.540 | -51,91 | 55 | -56,69 | ||||
| 2026-04-21 | 13F | Pinnacle Wealth Management Advisory Group, LLC | 22.577 | -7,63 | 268 | -32,32 | ||||
| 2026-04-15 | 13F | FNY Investment Advisers, LLC | 0 | -100,00 | 0 | |||||
| 2026-04-28 | 13F | Handelsbanken Fonder AB | 34.300 | 0,00 | 0 | |||||
| 2026-02-13 | 13F | Diametric Capital, LP | 49.704 | 129,88 | 807 | 71,49 | ||||
| 2026-01-23 | 13F | Westside Investment Management, Inc. | 45 | 1 | ||||||
| 2026-04-13 | 13F | True Wealth Design, LLC | 32 | -51,52 | 0 | -100,00 | ||||
| 2026-02-10 | 13F | Nomura Asset Management Co Ltd | 622.700 | -53,52 | 10.106 | -65,37 | ||||
| 2026-02-13 | 13F | Sei Investments Co | 211.537 | 182,11 | 3.433 | 110,23 | ||||
| 2026-02-17 | 13F | Wellington Management Group Llp | 8.629.238 | 67,74 | 140.053 | 24,99 | ||||
| 2026-02-17 | 13F | Bank Of America Corp /de/ | 651.953 | -18,12 | 10.581 | -38,99 | ||||
| 2026-05-01 | 13F | Fifth Third Bancorp | 58.823 | 699 | ||||||
| 2026-02-12 | 13F | Wealthspire Advisors, LLC | 0 | -100,00 | 0 | |||||
| 2026-04-15 | 13F | FNY Investment Advisers, LLC | Call | 0 | -100,00 | 0 | ||||
| 2026-01-21 | 13F | Woodmont Investment Counsel Llc | 14.250 | 0,00 | 231 | -25,48 | ||||
| 2025-11-14 | 13F | Point72 Asia (Singapore) Pte. Ltd. | 1.210 | 26 | ||||||
| 2026-04-09 | 13F | DHJJ Financial Advisors, Ltd. | 13 | 0,00 | 0 | |||||
| 2026-04-14 | 13F | Bay Harbor Wealth Management, LLC | 0 | -100,00 | 0 | |||||
| 2025-11-04 | 13F | Pineridge Advisors LLC | 137 | -33,50 | 3 | -50,00 | ||||
| 2026-04-28 | 13F | SBI Securities Co., Ltd. | 679 | -19,64 | 8 | -38,46 | ||||
| 2026-04-14 | 13F | Nbc Securities, Inc. | 1.440 | -7,16 | 17 | -32,00 | ||||
| 2026-02-11 | 13F | MCF Advisors LLC | 1.500 | 0,00 | 24 | -25,00 | ||||
| 2026-02-17 | 13F | Northern Trust Corp | 1.272.068 | -6,81 | 20.646 | -30,56 | ||||
| 2026-03-12 | 13F | Nalls Sherbakoff Group, Llc | 0 | -100,00 | 0 | |||||
| 2026-02-23 | 13F | Virtu Financial LLC | 0 | -100,00 | 0 | |||||
| 2026-02-13 | 13F | Barclays Plc | 366.390 | 73,93 | 5.947 | 29,60 | ||||
| 2026-02-09 | 13F | Dilation Capital Management LP | 0 | -100,00 | 0 | |||||
| 2026-02-13 | 13F | Caitong International Asset Management Co., Ltd | 686 | 9.700,00 | 11 | |||||
| 2026-02-11 | 13F | Capital Research Global Investors | 12.920.289 | 85,03 | 209.696 | 37,88 | ||||
| 2026-04-22 | 13F | Sterling Capital Management LLC | 922 | 2,33 | 11 | -28,57 | ||||
| 2026-02-12 | 13F | MetLife Investment Management, LLC | 78.025 | -4,26 | 1.266 | -28,68 | ||||
| 2025-11-14 | 13F | Two Sigma Securities, Llc | 0 | -100,00 | 0 | |||||
| 2026-04-10 | 13F | Linden Thomas Advisory Services, LLC | 26.421 | 314 | ||||||
| 2026-02-12 | 13F | Commonwealth Equity Services, Llc | 254.318 | 19,78 | 4.128 | 103.075,00 | ||||
| 2026-02-17 | 13F | Oberweis Asset Management Inc/ | 635.800 | 23,70 | 10.319 | -7,82 | ||||
| 2026-02-17 | 13F | 325 Capital Llc | 2.005.387 | 208,49 | 32.547 | 129,88 | ||||
| 2026-02-17 | 13F | Schonfeld Strategic Advisors LLC | 779.681 | 12.654 | ||||||
| 2026-04-13 | 13F | Massmutual Trust Co Fsb/adv | 11 | 0 | ||||||
| 2026-02-13 | 13F | Manufacturers Life Insurance Company, The | 0 | -100,00 | 0 | |||||
| 2026-02-17 | 13F | Ardsley Advisory Partners Lp | 0 | -100,00 | 0 | |||||
| 2026-04-28 | 13F | Stephens Investment Management Group LLC | 0 | -100,00 | 0 | |||||
| 2026-02-13 | 13F | Victory Capital Management Inc | 151.084 | 226,31 | 2.452 | 143,25 | ||||
| 2026-02-17 | 13F | Ardsley Advisory Partners Lp | Call | 0 | -100,00 | 0 | ||||
| 2026-02-13 | 13F | Pinnacle Wealth Planning Services, Inc. | 1.476 | 24 | ||||||
| 2026-02-17 | 13F | Point72 Asset Management, L.P. | 0 | -100,00 | 0 | |||||
| 2026-04-21 | 13F | Penbrook Management LLC | 112.190 | 260,57 | 1.333 | 164,29 | ||||
| 2026-04-29 | 13F | Klp Kapitalforvaltning As | 32.400 | 6,23 | 385 | -22,42 | ||||
| 2026-01-27 | 13F | Zurcher Kantonalbank (Zurich Cantonalbank) | 53.368 | 9,20 | 866 | -18,61 | ||||
| 2025-11-14 | 13F | 1858 Wealth Management, Llc | 9.212 | -34,53 | 201 | -41,00 | ||||
| 2026-02-09 | 13F | Smithfield Trust Co | 3.240 | -21,74 | 0 | |||||
| 2026-04-15 | 13F | Bayforest Capital Ltd | 13.225 | 106,16 | 157 | 50,96 | ||||
| 2026-04-15 | 13F | Exchange Traded Concepts, Llc | 1.964 | 23 | ||||||
| 2026-02-13 | 13F | Ubs Oconnor Llc | Call | 0 | -100,00 | 0 | ||||
| 2026-02-17 | 13F | Radcliffe Capital Management, L.P. | 87.400 | 118,50 | 1.419 | 62,80 | ||||
| 2026-04-24 | 13F | UMA Financial Services, Inc. | 0 | -100,00 | 0 | |||||
| 2026-02-10 | 13F | Bruce G. Allen Investments, LLC | 96 | -2,04 | 2 | -50,00 | ||||
| 2026-02-13 | 13F | Blue Grotto Capital, LLC | 1.628.782 | 5,16 | 26.435 | -21,63 | ||||
| 2026-02-17 | 13F | Advisory Services Network, LLC | 56.527 | -11,14 | 917 | -33,79 | ||||
| 2026-02-05 | 13F | Gamco Investors, Inc. Et Al | 44.479 | -21,23 | 722 | -41,33 | ||||
| 2026-02-17 | 13F/A | Northwest & Ethical Investments L.P. | 17.639 | -9,82 | 290 | -33,33 | ||||
| 2026-02-17 | 13F | Apis Capital Advisors, LLC | 604.000 | -28,04 | 9.803 | -46,38 | ||||
| 2026-02-17 | 13F | Point72 Asset Management, L.P. | Call | 23.500 | 381 | |||||
| 2026-02-09 | 13F | Keating Financial Advisory Services, Inc. | 19 | 0 | ||||||
| 2026-02-17 | 13F | Alta Park Capital, LP | 0 | -100,00 | 0 | |||||
| 2025-11-14 | 13F | Strategic Wealth Partners, Ltd. | 2.422 | 0,00 | 53 | -10,34 | ||||
| 2026-02-06 | 13F | Covestor Ltd | 90 | 0,00 | 0 | |||||
| 2026-04-27 | 13F | Truist Financial Corp | 12.076 | -43,26 | 143 | -58,55 | ||||
| 2026-02-17 | 13F | Aqr Capital Management Llc | 97.535 | 102,90 | 1.583 | 51,24 | ||||
| 2026-02-12 | 13F | Swiss National Bank | 280.700 | 2,97 | 4.556 | -23,28 | ||||
| 2026-02-17 | 13F | Two Sigma Investments, Lp | 363.412 | 20,96 | 5.898 | -9,86 | ||||
| 2026-02-06 | 13F | Leonteq Securities AG | 0 | -100,00 | 0 | |||||
| 2026-02-17 | 13F | Tudor Investment Corp Et Al | Put | 89.400 | 603,94 | 1.451 | 425,36 | |||
| 2026-04-13 | 13F | Winthrop Advisory Group LLC | 14.520 | 0,00 | 172 | -26,81 | ||||
| 2026-02-13 | 13F | Centiva Capital, LP | 17.000 | 276 | ||||||
| 2026-02-14 | 13F | Rockefeller Capital Management L.P. | 8.402 | 563,67 | 136 | 403,70 | ||||
| 2026-02-17 | 13F | Tudor Investment Corp Et Al | 34.674 | -92,28 | 563 | -94,25 | ||||
| 2026-02-17 | 13F | Tudor Investment Corp Et Al | Call | 177.100 | 941,76 | 2.874 | 676,76 | |||
| 2026-02-12 | 13F | Johnson Financial Group, Inc. | 0 | -100,00 | 0 | |||||
| 2026-02-13 | 13F | Verition Fund Management LLC | 62.277 | -29,47 | 1.011 | -47,48 | ||||
| 2026-04-15 | 13F | Steinberganna Wealth Management | 69.024 | 0,00 | 820 | -26,79 | ||||
| 2026-01-12 | 13F | National Wealth Management Group, LLC | 0 | -100,00 | 0 | |||||
| 2026-02-17 | 13F | J. Goldman & Co LP | 782.837 | -23,90 | 12.705 | -43,29 | ||||
| 2026-04-27 | 13F | Mount Yale Investment Advisors, LLC | 23.648 | 281 | ||||||
| 2026-02-13 | 13F | SRS Capital Advisors, Inc. | 111 | -20,14 | 2 | -66,67 | ||||
| 2026-04-30 | 13F | Torren Management, LLC | 0 | -100,00 | 0 | |||||
| 2026-04-28 | 13F | Stephens Inc /ar/ | 85.537 | -2,15 | 1.016 | -28,35 | ||||
| 2026-02-06 | 13F | Lloyd Advisory Services, LLC. | 301 | 5 | ||||||
| 2026-05-01 | 13F | Avion Wealth | 49 | 0,00 | 0 | |||||
| 2025-11-14 | 13F | ExodusPoint Capital Management, LP | 0 | -100,00 | 0 | |||||
| 2026-02-17 | 13F | Jain Global LLC | 0 | -100,00 | 0 | |||||
| 2026-02-17 | 13F | Alliancebernstein L.p. | 125.345 | -13,34 | 2.034 | -35,43 | ||||
| 2026-02-10 | 13F | Re Advisers Corp | 43.900 | 0,00 | 712 | -25,52 | ||||
| 2026-01-23 | 13F | Clear Creek Financial Management, LLC | 0 | -100,00 | 0 | |||||
| 2026-04-30 | 13F | Verdence Capital Advisors LLC | 20.891 | 22,94 | 248 | -9,82 | ||||
| 2026-02-13 | 13F | First Trust Advisors Lp | 199.872 | -34,44 | 3.244 | -51,16 | ||||
| 2026-02-13 | 13F | Blackhill Capital Inc | 5.991 | -48,45 | 97 | -61,66 | ||||
| 2026-02-17 | 13F | Quantinno Capital Management LP | 52.447 | 122,46 | 851 | 65,89 | ||||
| 2026-02-18 | 13F | Pillsbury Lake Capital LLC | 583.644 | 9.473 | ||||||
| 2026-02-13 | 13F | Stifel Financial Corp | 58.782 | -0,59 | 954 | -25,87 | ||||
| 2026-02-12 | 13F | Bank Of Montreal /can/ | 276.273 | 14,48 | 4.484 | -14,71 | ||||
| 2026-01-30 | 13F/A | M&t Bank Corp | 17.241 | 35,22 | 279 | 0,36 | ||||
| 2026-04-30 | 13F | Nippon Life Global Investors Americas, Inc. | 0 | -100,00 | 0 | |||||
| 2026-02-12 | 13F | Jane Street Group, Llc | 380.253 | -65,13 | 6.172 | -74,02 | ||||
| 2026-02-12 | 13F | Jane Street Group, Llc | Call | 220.500 | -26,43 | 3.579 | -45,18 | |||
| 2026-02-12 | 13F | Jane Street Group, Llc | Put | 130.500 | 1,71 | 2.118 | -24,19 | |||
| 2026-02-02 | 13F | Benjamin Edwards Inc | 0 | -100,00 | 0 | |||||
| 2026-02-17 | 13F | Engineers Gate Manager LP | 41.137 | 668 | ||||||
| 2026-04-30 | 13F | Nuveen, LLC | 3.590.025 | 1,67 | 42.649 | -25,58 | ||||
| 2026-02-05 | 13F | Amalgamated Bank | 4.400 | 1,48 | 0 | |||||
| 2026-04-20 | 13F | Jfs Wealth Advisors, Llc | 23 | 64,29 | 0 | |||||
| 2026-02-10 | 13F | Envestnet Asset Management Inc | 163.954 | -3,64 | 2.661 | -28,21 | ||||
| 2026-02-11 | 13F | Deutsche Bank Ag\ | 128.468 | -0,91 | 2.085 | -26,14 | ||||
| 2026-02-13 | 13F | Evelyn Partners Investment Management Services Ltd | 703 | 0,00 | 11 | -26,67 | ||||
| 2026-04-23 | 13F | Cornerstone Wealth Management, LLC | 10.920 | 0,00 | 130 | -27,12 | ||||
| 2026-02-11 | 13F | Picton Mahoney Asset Management | 388.131 | 0,21 | 6.299 | 78.637,50 | ||||
| 2026-02-17 | 13F | Caption Management, LLC | 16.200 | 263 | ||||||
| 2026-02-12 | 13F | State Board Of Administration Of Florida Retirement System | 38.231 | 0,00 | 620 | -25,48 | ||||
| 2026-02-12 | 13F | BlackRock, Inc. | 11.593.249 | 1,58 | 188.158 | -24,31 | ||||
| 2026-02-17 | 13F | Caption Management, LLC | Put | 162.500 | -59,38 | 2.637 | -69,73 | |||
| 2026-02-17 | 13F | Russell Investments Group, Ltd. | 451.021 | 45,68 | 7.320 | 8,56 | ||||
| 2026-02-17 | 13F | Caption Management, LLC | Call | 1.182.000 | -29,21 | 19.184 | -47,25 | |||
| 2026-01-29 | 13F | IMC-Chicago, LLC | 133.096 | 2.160 | ||||||
| 2026-01-29 | 13F | IMC-Chicago, LLC | Put | 125.200 | 10,70 | 2.032 | -17,54 | |||
| 2026-01-29 | 13F | IMC-Chicago, LLC | Call | 376.000 | -9,79 | 6.102 | -32,78 | |||
| 2026-02-13 | 13F | Great West Life Assurance Co /can/ | 15.140 | -66,02 | 0 | |||||
| 2026-02-12 | 13F | Castleark Management Llc | 0 | -100,00 | 0 | |||||
| 2026-02-12 | 13F | Hilton Capital Management, LLC | 180.473 | 27,94 | 2.929 | -4,65 | ||||
| 2026-02-12 | 13F | Dimensional Fund Advisors Lp | 3.615.820 | 1,36 | 58.687 | -24,47 | ||||
| 2026-04-10 | 13F | Kopion Asset Management, LLC | 855.904 | 39,29 | 10.168 | 1,97 | ||||
| 2026-02-13 | 13F | Umb Bank N A/mo | 849 | 0,47 | 14 | -27,78 | ||||
| 2026-01-29 | 13F | Vanguard Group Inc | 14.802.630 | 1,01 | 240.247 | -24,73 | ||||
| 2026-04-29 | 13F | Harbour Capital Advisors, LLC | 0 | -100,00 | 0 | |||||
| 2026-02-11 | 13F | Rise Advisors, LLC | 0 | -100,00 | 0 | |||||
| 2025-11-14 | 13F | Mml Investors Services, Llc | 0 | -100,00 | 0 | |||||
| 2026-01-22 | 13F | Advantage Alpha Capital Partners LP | 0 | -100,00 | 0 | |||||
| 2026-02-04 | 13F | Versor Investments LP | 10.800 | 175 | ||||||
| 2026-02-13 | 13F | Ubs Asset Management Americas Inc | 328.260 | 2,20 | 5.328 | -23,85 | ||||
| 2026-02-17 | 13F | Prelude Capital Management, Llc | 152.200 | 33,92 | 2.470 | -0,20 | ||||
| 2026-04-22 | 13F | 1492 Capital Management LLC | 340.542 | -0,25 | 4.046 | -26,99 | ||||
| 2026-02-17 | 13F | Magnetar Financial LLC | 96.163 | 533,11 | 1.561 | 372,73 | ||||
| 2026-02-02 | 13F | Principal Financial Group Inc | 237.220 | 46,04 | 3.850 | 8,85 | ||||
| 2026-02-10 | 13F | State of Wyoming | 4.600 | 159,30 | 75 | 94,74 | ||||
| 2026-05-01 | 13F | Thrivent Financial For Lutherans | 0 | -100,00 | 0 | |||||
| 2026-02-17 | 13F | Numerai GP LLC | 0 | -100,00 | 0 | |||||
| 2026-01-30 | 13F | Us Bancorp \de\ | 1.134 | -28,95 | 18 | -47,06 | ||||
| 2026-02-06 | 13F | Larson Financial Group LLC | 1.030 | 10,75 | 17 | -20,00 | ||||
| 2025-11-14 | 13F/A | Skopos Labs, Inc. | 0 | -100,00 | 0 | -100,00 | ||||
| 2026-04-10 | 13F/A | OP Asset Management Ltd | 12.621 | 0,00 | 150 | -26,96 | ||||
| 2026-04-07 | 13F | Farther Finance Advisors, LLC | 246 | 61,84 | 3 | 0,00 | ||||
| 2026-02-17 | 13F | Driehaus Capital Management Llc | 0 | -100,00 | 0 | |||||
| 2026-02-17 | 13F | Ophir Asset Management Pty Ltd | 2.384.187 | 38.695 | ||||||
| 2026-02-17 | 13F | Canada Pension Plan Investment Board | 18.452 | 559,00 | 299 | 398,33 | ||||
| 2026-02-17 | 13F | Raymond James Financial Inc | 297.716 | -4,16 | 4.832 | -28,60 | ||||
| 2026-02-12 | 13F | Cloud Capital Management, LLC | 0 | -100,00 | 0 | |||||
| 2026-04-29 | 13F | Hughes Financial Services, LLC | 3 | -94,12 | 0 | |||||
| 2026-02-11 | 13F | LPL Financial LLC | 116.450 | 5,99 | 1.890 | -21,03 | ||||
| 2026-02-17 | 13F | MIRAE ASSET GLOBAL ETFS HOLDINGS Ltd. | 65.003 | -0,09 | 1.055 | -25,62 | ||||
| 2026-01-26 | 13F | KBC Group NV | 4.480 | 0,00 | 0 | |||||
| 2026-02-17 | 13F | Frontier Capital Management Co Llc | 944.701 | -13,59 | 15.332 | -35,61 | ||||
| 2026-02-17 | 13F | XTX Topco Ltd | 46.663 | -42,71 | 757 | -57,30 | ||||
| 2026-02-13 | 13F | Citigroup Inc | 51.424 | -68,52 | 835 | -76,55 | ||||
| 2026-02-11 | 13F | Fox Run Management, L.l.c. | 0 | -100,00 | 0 | |||||
| 2026-02-10 | 13F | Intech Investment Management Llc | 66.235 | 11,88 | 1.075 | -16,68 | ||||
| 2026-02-17 | 13F | J. Goldman & Co LP | Call | 0 | -100,00 | 0 | ||||
| 2026-02-17 | 13F | Captrust Financial Advisors | 15.329 | 15,71 | 249 | -13,89 | ||||
| 2026-02-12 | 13F | EAM Investors, LLC | 0 | -100,00 | 0 | |||||
| 2025-11-14 | 13F | Federation des caisses Desjardins du Quebec | 0 | -100,00 | 0 | |||||
| 2026-02-10 | 13F | Goldman Sachs Group Inc | 1.761.037 | -26,18 | 28.582 | -44,99 | ||||
| 2026-02-12 | 13F | Colonial Trust Co / SC | 308 | 66,49 | 5 | 25,00 | ||||
| 2026-02-04 | 13F | First Eagle Investment Management, LLC | 296.443 | -48,48 | 4.811 | -61,61 | ||||
| 2026-02-17 | 13F | Jones Financial Companies Lllp | 5.491 | -10,03 | 89 | -34,07 | ||||
| 2026-01-28 | 13F | Teacher Retirement System Of Texas | 0 | -100,00 | 0 | |||||
| 2026-02-09 | 13F | Legal & General Group Plc | 148.841 | -7,23 | 2.416 | -30,88 | ||||
| 2026-02-17 | 13F | Parallax Volatility Advisers, L.P. | Call | 9.000 | -35,71 | 146 | -51,97 | |||
| 2026-02-17 | 13F | Susquehanna International Group, Llp | Call | 760.500 | -37,00 | 12.343 | -53,05 | |||
| 2026-02-17 | 13F | Janus Henderson Group Plc | 58.423 | 0,00 | 948 | -25,47 | ||||
| 2026-02-17 | 13F | Parallax Volatility Advisers, L.P. | 54.658 | -58,18 | 887 | -68,83 | ||||
| 2025-11-14 | 13F | Cubist Systematic Strategies, LLC | Put | 22.100 | 481 | |||||
| 2026-04-06 | 13F | Versant Capital Management, Inc | 5.529 | 300,36 | 66 | 195,45 | ||||
| 2026-02-12 | 13F | Pitcairn Co | 0 | -100,00 | 0 | |||||
| 2026-01-05 | 13F | Chesapeake Asset Management Llc | 0 | -100,00 | 0 | -100,00 | ||||
| 2025-11-14 | 13F | Cubist Systematic Strategies, LLC | Call | 31.000 | 675 | |||||
| 2026-02-10 | 13F | Bnp Paribas Arbitrage, Sa | 31.632 | -12,72 | 513 | -34,98 | ||||
| 2026-02-17 | 13F | Balyasny Asset Management Llc | 873.208 | 14.172 | ||||||
| 2025-11-14 | 13F | Cubist Systematic Strategies, LLC | 71.251 | 1.552 | ||||||
| 2026-03-26 | 13F/A | Peak6 Llc | 0 | -100,00 | 0 | -100,00 | ||||
| 2026-04-24 | 13F | ProShare Advisors LLC | 20.628 | -19,37 | 245 | -40,96 | ||||
| 2026-02-12 | 13F | Rossby Financial, LCC | 500 | 0,00 | 8 | -20,00 | ||||
| 2026-02-13 | 13F | S Squared Technology, LLC | 402.862 | 50,40 | 6.538 | 12,07 | ||||
| 2026-03-12 | 13F/A | Peak6 Llc | Put | 256.800 | -46,13 | 4.168 | -59,86 | |||
| 2026-02-12 | 13F | Brinker Capital Investments, LLC | 29.372 | 477 | ||||||
| 2026-04-17 | 13F | Outlook Wealth Advisors, LLC | 0 | -100,00 | 0 | |||||
| 2026-02-11 | 13F | CenterBook Partners LP | 172.546 | 2.800 | ||||||
| 2026-02-12 | 13F | Campbell & CO Investment Adviser LLC | 0 | -100,00 | 0 | |||||
| 2026-02-13 | 13F | Meros Investment Management, LP | 825.595 | 34,50 | 13.399 | 0,22 | ||||
| 2026-04-06 | 13F | GAMMA Investing LLC | 2.554 | 22,49 | 30 | -9,09 | ||||
| 2026-02-11 | 13F | Cerity Partners LLC | 100.788 | 0,23 | 1.636 | -25,34 | ||||
| 2026-02-17 | 13F | Creative Planning | 30.735 | 40,39 | 499 | 4,62 | ||||
| 2026-04-16 | 13F | SG Americas Securities, LLC | 57.237 | -3,39 | 1 | |||||
| 2026-02-18 | 13F | Vident Advisory, LLC | 16.723 | 0,61 | 271 | -25,14 | ||||
| 2026-02-11 | 13F | Group One Trading, L.p. | Put | 106.600 | 39,35 | 1.730 | 3,84 | |||
| 2026-03-12 | 13F/A | Peak6 Llc | Call | 7.500 | -96,68 | 122 | -97,54 | |||
| 2026-04-30 | 13F | Money Concepts Capital Corp | 11.659 | 139 | ||||||
| 2025-11-14 | 13F | Marex Group plc | 0 | -100,00 | 0 | -100,00 | ||||
| 2026-05-01 | 13F | Arizona State Retirement System | 39.456 | -0,41 | 469 | -27,10 | ||||
| 2026-02-09 | 13F | King Luther Capital Management Corp | 515.635 | 14,60 | 8.369 | -14,61 | ||||
| 2026-05-01 | 13F | Anchor Investment Management, LLC | 150 | 0,00 | 2 | -50,00 | ||||
| 2026-04-20 | 13F | Cardinal Point Capital Management, ULC | 94.950 | 38,56 | 1.128 | 1,44 | ||||
| 2026-02-10 | 13F/A | Northwestern Mutual Wealth Management Co | 3.201 | 6,70 | 52 | -21,54 | ||||
| 2026-02-17 | 13F | Holocene Advisors, LP | 15.562 | 253 | ||||||
| 2025-11-04 | 13F | FDx Advisors, Inc. | 0 | -100,00 | 0 | |||||
| 2025-11-14 | 13F | Point72 Hong Kong Ltd | 3.639 | 79 | ||||||
| 2026-02-17 | 13F | Manatuck Hill Partners, LLC | 350.000 | 0,20 | 5.680 | -25,33 | ||||
| 2026-02-13 | 13F | Bridgewater Associates, LP | 145.187 | -0,33 | 2.356 | -25,73 | ||||
| 2026-02-17 | 13F | Panoramic Capital, LLC | 0 | -100,00 | 0 | |||||
| 2026-02-13 | 13F | Quarry LP | 0 | -100,00 | 0 | |||||
| 2025-11-14 | 13F | Lazard Asset Management Llc | 0 | -100,00 | 0 | |||||
| 2026-02-09 | 13F | Hartland & Co., LLC | 6.531 | 193,26 | 106 | 118,75 | ||||
| 2025-11-05 | 13F | SOUTH STATE Corp | 0 | -100,00 | 0 | |||||
| 2026-04-07 | 13F | CoreCap Advisors, LLC | 524 | 37,53 | 6 | 0,00 | ||||
| 2026-04-20 | 13F | Concurrent Investment Advisors, LLC | 0 | -100,00 | 0 | -100,00 | ||||
| 2025-11-14 | 13F | Point72 (DIFC) Ltd | 11.770 | 256 | ||||||
| 2026-01-29 | 13F | Dunhill Financial, LLC | 4 | 0 | ||||||
| 2026-01-30 | 13F | State of New Jersey Common Pension Fund D | 0 | -100,00 | 0 | |||||
| 2026-04-13 | 13F | Gill Capital Partners, Llc | 75 | 1 | ||||||
| 2026-02-17 | 13F | Cetera Investment Advisers | 34.297 | 1,86 | 557 | -24,15 | ||||
| 2026-02-13 | 13F | Cetera Trust Company, N.A | 3.110 | -68,46 | 50 | -76,64 | ||||
| 2026-02-12 | 13F | Cibc World Markets Corp | 0 | -100,00 | 0 | |||||
| 2026-02-13 | 13F | Citigroup Inc | Call | 0 | -100,00 | 0 | -100,00 | |||
| 2026-02-12 | 13F | Senvest Management, LLC | 224.100 | 3.637 | ||||||
| 2026-02-17 | 13F | Qube Research & Technologies Ltd | 202.936 | -2,87 | 3.294 | -27,63 | ||||
| 2026-02-13 | 13F | Walleye Trading LLC | Put | 165.600 | 120,21 | 2.688 | 64,14 | |||
| 2026-02-13 | 13F | Walleye Trading LLC | Call | 441.300 | 57,44 | 7.162 | 17,33 | |||
| 2026-02-13 | 13F | Edgestream Partners, L.P. | 28.194 | 458 | ||||||
| 2026-02-13 | 13F | Glen Eagle Advisors, LLC | 49 | 0,00 | 1 | -100,00 | ||||
| 2026-02-17 | 13F | Man Group plc | 311.536 | 5.056 | ||||||
| 2025-11-13 | 13F | Connor, Clark & Lunn Investment Management Ltd. | 0 | -100,00 | 0 | |||||
| 2026-02-13 | 13F | Walleye Trading LLC | 52.867 | 205,94 | 858 | 128,19 | ||||
| 2026-02-13 | 13F | Toroso Investments, LLC | 123.908 | 25,05 | 2.011 | -6,81 | ||||
| 2026-02-11 | 13F | Group One Trading, L.p. | Call | 224.100 | 28,42 | 3.637 | -4,29 | |||
| 2026-02-11 | 13F | Group One Trading, L.p. | 5.347 | -95,15 | 87 | -96,42 | ||||
| 2026-02-11 | 13F | Los Angeles Capital Management Llc | 40.084 | 694 | ||||||
| 2026-04-20 | 13F | Ritholtz Wealth Management | 10.334 | 123 | ||||||
| 2026-02-17 | 13F | Nine Ten Capital Management LLC | 3.003.583 | 5,07 | 48.748 | -21,70 | ||||
| 2026-04-08 | 13F | DiNuzzo Private Wealth, Inc. | 1 | -93,33 | 0 | |||||
| 2026-02-17 | 13F | T. Rowe Price Investment Management, Inc. | 0 | -100,00 | 0 | |||||
| 2025-11-14 | 13F | Massar Capital Management, LP | 0 | -100,00 | 0 | -100,00 | ||||
| 2026-02-10 | 13F | Rothschild Investment Llc | 181 | -17,73 | 3 | -50,00 | ||||
| 2026-02-17 | 13F | AYAL Capital Advisors Ltd | 200.000 | 0,50 | 3.246 | -25,10 | ||||
| 2026-04-17 | 13F | Bell Investment Advisors, Inc | 0 | -100,00 | 0 | |||||
| 2026-02-09 | 13F | Huntington National Bank | 2.268 | 3,61 | 37 | -23,40 | ||||
| 2026-01-30 | 13F | Rachor Investment Advisory Services, LLC | 4.164 | 68 | ||||||
| 2025-11-13 | 13F | Norges Bank | 0 | -100,00 | 0 | -100,00 | ||||
| 2026-02-11 | 13F | Simplex Trading, Llc | 263.362 | 125,01 | 4.274 | 213.600,00 | ||||
| 2026-02-06 | 13F | Legato Capital Management LLC | 0 | -100,00 | 0 | -100,00 | ||||
| 2026-02-11 | 13F | Simplex Trading, Llc | Call | 277.100 | -24,31 | 4.497 | 64.142,86 | |||
| 2026-02-13 | 13F | Morgan Stanley | 1.862.538 | -8,98 | 30.229 | -32,17 | ||||
| 2026-02-11 | 13F | Simplex Trading, Llc | Put | 169.100 | -8,45 | 2.744 | 68.500,00 | |||
| 2026-05-01 | 13F | HFM Investment Advisors, LLC | 0 | -100,00 | 0 | |||||
| 2026-04-16 | 13F | Maestria Partners LLC | 1.363.505 | 0,00 | 16.198 | -26,80 | ||||
| 2026-02-17 | 13F | Aster Capital Management (DIFC) Ltd | 0 | -100,00 | 0 | |||||
| 2026-02-11 | 13F | O'shaughnessy Asset Management, Llc | 0 | -100,00 | 0 | |||||
| 2026-02-12 | 13F | Voya Investment Management Llc | 220.440 | 17,20 | 3.578 | -12,67 | ||||
| 2026-02-06 | 13F | Banque Cantonale Vaudoise | 0 | -100,00 | 0 | |||||
| 2026-02-17 | 13F | Voloridge Investment Management, Llc | 0 | -100,00 | 0 | |||||
| 2026-02-13 | 13F | Marshall Wace, Llp | 28.763 | 467 | ||||||
| 2026-04-17 | 13F | AdvisorNet Financial, Inc | 0 | -100,00 | 0 | |||||
| 2026-04-21 | 13F | Pinnacle Associates Ltd | 65.756 | 27,14 | 781 | -6,91 | ||||
| 2026-02-13 | 13F | Parkside Financial Bank & Trust | 9.412 | -0,55 | 153 | -26,21 | ||||
| 2026-02-17 | 13F | Cannell Capital Llc | 0 | -100,00 | 0 | |||||
| 2026-02-17 | 13F | Amundi | 13.053 | 212 | ||||||
| 2026-02-12 | 13F | CIBC Private Wealth Group, LLC | 131 | 156,86 | 2 | 100,00 | ||||
| 2026-04-28 | 13F | Harbor Capital Advisors, Inc. | 325.261 | 51,81 | 4 | 0,00 | ||||
| 2026-02-12 | 13F | Steward Partners Investment Advisory, Llc | 7.460 | 18.550,00 | 121 | |||||
| 2026-04-30 | 13F | Griffin Asset Management, Inc. | 0 | -100,00 | 0 | |||||
| 2026-01-30 | 13F | Jennison Associates Llc | 0 | -100,00 | 0 | |||||
| 2026-02-17 | 13F | Advisor Group Holdings, Inc. | 16.529 | -64,99 | 268 | -77,61 | ||||
| 2026-02-13 | 13F | Rhumbline Advisers | 183.945 | -15,35 | 2.985 | -36,92 | ||||
| 2026-04-20 | 13F | State of Alaska, Department of Revenue | 30.334 | 0,00 | 0 | |||||
| 2025-11-07 | 13F | Shell Asset Management Co | 4.609 | -54,76 | 0 | |||||
| 2026-02-13 | 13F | American Century Companies Inc | 5.286.928 | 15,08 | 85.807 | -14,24 | ||||
| 2026-04-21 | 13F | P.a.w. Capital Corp | Call | 0 | -100,00 | 0 | -100,00 | |||
| 2026-02-05 | 13F | Gabelli Funds Llc | 30.820 | 184,84 | 500 | 112,77 | ||||
| 2026-04-07 | 13F | Signaturefd, Llc | 1.372 | 17,16 | 16 | -15,79 | ||||
| 2026-04-29 | 13F | Greenwood Capital Associates Llc | 36.804 | -4,70 | 437 | -30,19 | ||||
| 2026-04-21 | 13F | P.a.w. Capital Corp | 170.000 | 21,43 | 2.020 | -11,14 | ||||
| 2026-05-01 | 13F | International Assets Investment Management, Llc | 110 | 0,00 | 1 | 0,00 | ||||
| 2026-02-06 | 13F | EverSource Wealth Advisors, LLC | 384 | -4,24 | 6 | -25,00 | ||||
| 2026-02-06 | 13F | Pnc Financial Services Group, Inc. | 1.834 | -24,46 | 30 | -44,23 | ||||
| 2026-02-13 | 13F | Smartleaf Asset Management LLC | 3.678 | 98,38 | 61 | 46,34 | ||||
| 2026-01-28 | 13F | Universal- Beteiligungs- und Servicegesellschaft mbH | 129.787 | -68,59 | 2.106 | -76,59 | ||||
| 2026-02-13 | 13F | Public Employees Retirement Association Of Colorado | 14.986 | 0,00 | 0 | |||||
| 2026-02-14 | 13F | Norwood Investment Partners, LP | 330.000 | -23,26 | 5.356 | -42,82 | ||||
| 2026-02-17 | 13F | Ancora Advisors, LLC | 11 | 0,00 | 0 | |||||
| 2026-02-10 | 13F | Td Asset Management Inc | 0 | -100,00 | 0 | |||||
| 2026-02-17 | 13F | Granahan Investment Management Inc/ma | 0 | -100,00 | 0 | |||||
| 2026-02-06 | 13F | Nano Cap New Millennium Growth Fund L P | 50.000 | 812 | ||||||
| 2026-02-11 | 13F | Parallel Advisors, LLC | 284 | -22,40 | 5 | -42,86 | ||||
| 2026-02-17 | 13F | Freestone Grove Partners LP | 27.761 | 451 | ||||||
| 2025-11-13 | 13F | Mackenzie Financial Corp | 0 | -100,00 | 0 | |||||
| 2025-11-03 | 13F | TD Waterhouse Canada Inc. | 0 | -100,00 | 0 | |||||
| 2026-02-17 | 13F | Price T Rowe Associates Inc /md/ | 711.495 | -72,07 | 12 | -80,00 | ||||
| 2025-11-14 | 13F | Wolverine Trading, Llc | 10.259 | -28,13 | 229 | -24,25 | ||||
| 2026-04-15 | 13F | Fortitude Family Office, LLC | 130 | -75,19 | 2 | -87,50 | ||||
| 2025-11-14 | 13F | Wolverine Trading, Llc | Call | 192.100 | -5,46 | 4.280 | -0,19 | |||
| 2025-11-14 | 13F | Wolverine Trading, Llc | Put | 52.200 | -22,78 | 1.163 | -18,44 | |||
| 2026-02-13 | 13F | Walleye Capital LLC | Put | 62.300 | -3,26 | 1.011 | -27,89 | |||
| 2026-02-06 | 13F | Gsa Capital Partners Llp | 16.523 | 0 | ||||||
| 2026-02-13 | 13F | Walleye Capital LLC | 25.557 | 415 | ||||||
| 2026-02-17 | 13F | Dark Forest Capital Management Lp | 0 | -100,00 | 0 | |||||
| 2025-11-17 | 13F | PDT Partners, LLC | 0 | -100,00 | 0 | -100,00 | ||||
| 2026-04-29 | 13F | CVA Family Office, LLC | 70 | 1 | ||||||
| 2026-02-13 | 13F | Walleye Capital LLC | Call | 56.800 | 5,38 | 922 | -21,48 | |||
| 2026-02-13 | 13F | Neo Ivy Capital Management | 0 | -100,00 | 0 | |||||
| 2026-01-29 | 13F | Comerica Bank | 94.556 | -3,67 | 1.535 | -28,22 | ||||
| 2026-02-12 | 13F | Ensign Peak Advisors, Inc | 13.658 | -59,72 | 222 | -70,05 | ||||
| 2026-02-17 | 13F | Bayesian Capital Management, LP | 11.987 | 195 | ||||||
| 2026-04-30 | 13F | Hsbc Holdings Plc | 38.399 | -27,25 | 460 | -46,44 | ||||
| 2026-04-30 | 13F | Hsbc Holdings Plc | Call | 50.000 | 0,00 | 599 | -26,23 | |||
| 2026-02-17 | 13F | Weiss Asset Management LP | 58.484 | 949 | ||||||
| 2026-04-16 | 13F | ARS Investment Partners, LLC | 0 | -100,00 | 0 | |||||
| 2026-04-30 | 13F | Hsbc Holdings Plc | Put | 20.000 | 0,00 | 240 | -26,23 | |||
| 2025-11-12 | 13F | Principal Securities, Inc. | 0 | -100,00 | 0 | -100,00 | ||||
| 2026-04-30 | 13F | Cambridge Investment Research Advisors, Inc. | 15.022 | 6,87 | 0 | |||||
| 2026-02-13 | 13F | QVT Financial LP | 61.293 | 995 | ||||||
| 2025-11-12 | 13F | Roubaix Capital, LLC | 0 | -100,00 | 0 | -100,00 | ||||
| 2026-01-14 | 13F | USA Financial Portformulas Corp | 0 | -100,00 | 0 | |||||
| 2026-02-17 | 13F | Optiver Holding B.V. | 196 | -53,77 | 3 | -66,67 | ||||
| 2026-02-11 | 13F | Strategic Advocates LLC | 1.920 | -0,10 | 32 | -24,39 | ||||
| 2026-04-21 | 13F | HCR Wealth Advisors | 13.000 | 0,00 | 154 | -26,67 | ||||
| 2026-04-15 | 13F | Sarver Vrooman Wealth Advisors | 0 | -100,00 | 0 | |||||
| 2026-01-15 | 13F | Allspring Global Investments Holdings, LLC | 37.462 | 9,58 | 602 | -19,22 | ||||
| 2026-04-30 | 13F | Nisa Investment Advisors, Llc | 4.578 | 144,94 | 54 | 80,00 | ||||
| 2025-11-14 | 13F | Parallax Volatility Advisers, L.P. | Put | 0 | -100,00 | 0 | -100,00 | |||
| 2026-04-13 | 13F | Wedge Capital Management L L P/nc | 189.767 | -0,07 | 2.254 | -26,87 | ||||
| 2026-02-12 | 13F | Quadrant Capital Group Llc | 33 | 1 | ||||||
| 2026-02-17 | 13F | Clough Capital Partners L P | 0 | -100,00 | 0 | |||||
| 2026-04-24 | 13F | Fulton Bank, N.a. | 30.740 | -2,09 | 365 | -28,29 | ||||
| 2026-02-11 | 13F | Ameritas Investment Partners, Inc. | 11.700 | 190 | ||||||
| 2026-02-13 | 13F | Brown Advisory Inc | 21.263 | -67,13 | 345 | -75,50 | ||||
| 2026-02-17 | 13F/A | Laurion Capital Management LP | 50.869 | 826 | ||||||
| 2026-02-17 | 13F | Royal Bank Of Canada | 62.313 | 42,63 | 1.011 | 6,31 | ||||
| 2026-01-29 | 13F | Sanctuary Advisors, LLC | 0 | -100,00 | 0 | -100,00 | ||||
| 2026-02-06 | 13F | Global Retirement Partners, LLC | 80 | -97,56 | 1 | -98,59 | ||||
| 2026-02-06 | 13F | Intrust Bank Na | 0 | -100,00 | 0 | |||||
| 2025-11-14 | 13F/A | Atlas Merchant Capital LLC | 0 | -100,00 | 0 | |||||
| 2026-02-13 | 13F | Rice Hall James & Associates, Llc | 198.828 | 49,25 | 3.227 | 11,20 | ||||
| 2026-04-07 | 13F | Central Pacific Bank - Trust Division | 2.500 | 0,00 | 30 | -27,50 | ||||
| 2026-01-26 | 13F | Cwm, Llc | 2.581 | 24,75 | 0 | |||||
| 2026-02-09 | 13F | Quest Partners LLC | 19.153 | 41,97 | 311 | 5,80 | ||||
| 2026-02-09 | 13F | Lisanti Capital Growth, LLC | 0 | -100,00 | 0 | |||||
| 2026-02-05 | 13F | HighMark Wealth Management LLC | 0 | -100,00 | 0 | |||||
| 2026-01-26 | 13F | Moran Wealth Management, LLC | 0 | -100,00 | 0 | |||||
| 2026-02-10 | 13F | Florida Financial Advisors, Llc | 12.686 | 206 | ||||||
| 2026-02-11 | 13F | Jpmorgan Chase & Co | 506.393 | -58,13 | 8.219 | -68,80 | ||||
| 2026-02-05 | 13F | 1620 Investment Advisors, Inc. | 8.953 | 1,70 | 145 | -24,08 | ||||
| 2026-04-13 | 13F | IFP Advisors, Inc | 49 | 0,00 | 1 | |||||
| 2026-02-17 | 13F | Algert Global Llc | 509.860 | 978,61 | 8 | 700,00 | ||||
| 2026-02-06 | 13F | HighTower Advisors, LLC | 0 | -100,00 | 0 | |||||
| 2026-02-17 | 13F | Grizzlyrock Capital, Llc | 571.906 | 46,30 | 9.282 | 9,03 | ||||
| 2026-02-05 | 13F | Dana Investment Advisors, Inc. | 254.935 | -37,69 | 4.138 | -53,57 | ||||
| 2026-02-17 | 13F | Tower Research Capital LLC (TRC) | 7.072 | -34,24 | 115 | -51,28 | ||||
| 2026-02-17 | 13F | Capital Fund Management S.a. | Call | 37.900 | 29,79 | 615 | -3,15 | |||
| 2026-02-17 | 13F | Boothbay Fund Management, Llc | 117.842 | 100,15 | 1.913 | 49,14 | ||||
| 2026-02-05 | 13F | Allworth Financial LP | 444 | -21,42 | 7 | -41,67 | ||||
| 2026-04-28 | 13F | Raleigh Capital Management Inc. | 0 | -100,00 | 0 | |||||
| 2026-02-09 | 13F | Royce & Associates Lp | 1.166.469 | 19,50 | 18.932 | -10,95 | ||||
| 2026-02-13 | 13F | Wells Fargo & Company/mn | 193.619 | 40,59 | 3.142 | 4,77 | ||||
| 2026-04-24 | 13F | Root Financial Partners, LLC | 228 | 178,05 | 3 | 100,00 | ||||
| 2026-04-22 | 13F | Pictet Asset Management Holding SA | 25.755 | 13,75 | 306 | -16,89 | ||||
| 2026-02-13 | 13F | Boston Partners | 4.108.893 | -7,64 | 66.596 | -30,05 | ||||
| 2025-11-17 | 13F | Kestra Private Wealth Services, Llc | 0 | -100,00 | 0 | -100,00 | ||||
| 2026-02-17 | 13F | Silvercrest Asset Management Group Llc | 685.259 | 30,55 | 11.122 | -2,72 | ||||
| 2026-02-12 | 13F | BRYN MAWR TRUST Co | 0 | -100,00 | 0 | -100,00 | ||||
| 2026-02-13 | 13F | Charles Schwab Investment Management Inc | 1.187.501 | -2,49 | 19.273 | -27,34 | ||||
| 2026-02-17 | 13F | Millennium Management Llc | 23.744 | -96,49 | 385 | -97,39 | ||||
| 2026-02-17 | 13F | California State Teachers Retirement System | 136.524 | 2,97 | 2.216 | -23,28 | ||||
| 2026-02-03 | 13F | McIlrath & Eck, LLC | 160 | 0,00 | 3 | -33,33 | ||||
| 2026-02-17 | 13F | Millennium Management Llc | Call | 17.800 | -35,04 | 289 | -51,68 | |||
| 2026-02-12 | 13F | Xponance, Inc. | 11.096 | 1,02 | 180 | -24,69 | ||||
| 2026-02-19 | 13F | Invesco Ltd. | 243.565 | -5,86 | 3.953 | -29,85 | ||||
| 2026-02-13 | 13F | Truvestments Capital Llc | 5 | 0,00 | 0 | |||||
| 2026-02-10 | 13F | Bank of New York Mellon Corp | 1.183.318 | -6,23 | 19.205 | -30,12 | ||||
| 2026-01-08 | 13F | Nordea Investment Management Ab | 445.016 | -0,52 | 7.338 | -24,30 | ||||
| 2026-02-17 | 13F | Ameriprise Financial Inc | 0 | -100,00 | 0 | |||||
| 2026-02-12 | 13F | New York State Common Retirement Fund | 474.457 | 0,00 | 7.700 | -25,48 | ||||
| 2026-02-17 | 13F | Polar Asset Management Partners Inc. | 0 | -100,00 | 0 | |||||
| 2026-02-05 | 13F | ANTIPODES PARTNERS Ltd | 24.831 | 403 | ||||||
| 2026-02-17 | 13F | Dba Trading, Llc | 55.000 | 893 | ||||||
| 2026-02-17 | 13F | Sender Co & Partners, Inc. | 29.905 | 485 | ||||||
| 2026-02-17 | 13F | D. E. Shaw & Co., Inc. | Put | 0 | -100,00 | 0 | ||||
| 2026-02-17 | 13F | D. E. Shaw & Co., Inc. | Call | 0 | -100,00 | 0 | ||||
| 2026-04-17 | 13F | Murphy & Mullick Capital Management Corp | 8.800 | 0,00 | 105 | -26,76 | ||||
| 2026-04-20 | 13F | Ronald Blue Trust, Inc. | 29.073 | 5,82 | 345 | -22,47 | ||||
| 2025-11-06 | 13F | Johnson Investment Counsel Inc | 0 | -100,00 | 0 | |||||
| 2025-11-03 | 13F | EFG Asset Management (North America) Corp. | 150.511 | -25,12 | 3.277 | -32,36 | ||||
| 2026-02-10 | 13F | Quantbot Technologies LP | 0 | -100,00 | 0 | |||||
| 2026-02-17 | 13F | Citadel Advisors Llc | Put | 760.200 | 55,43 | 12.338 | 15,83 | |||
| 2026-02-17 | 13F | Balyasny Asset Management Llc | Call | 0 | -100,00 | 0 | -100,00 | |||
| 2025-11-21 | 13F/A | CIBC Bancorp USA Inc. | 14.929 | 325 | ||||||
| 2026-02-17 | 13F | D. E. Shaw & Co., Inc. | 0 | -100,00 | 0 | |||||
| 2026-04-23 | 13F | SJS Investment Consulting Inc. | 83 | 937,50 | 1 | |||||
| 2026-02-17 | 13F | Citadel Advisors Llc | 544.318 | 221,02 | 8.834 | 139,21 | ||||
| 2026-02-17 | 13F | Citadel Advisors Llc | Call | 438.200 | 32,79 | 7.112 | -1,06 | |||
| 2026-02-11 | 13F | Atlantic Private Wealth, LLC | 15 | 0 | ||||||
| 2026-02-13 | 13F | MAI Capital Management | 1.082 | -19,49 | 18 | -41,38 | ||||
| 2026-04-10 | 13F | Abound Wealth Management | 176 | 0,00 | 2 | 0,00 | ||||
| 2026-02-10 | 13F | Zweig-DiMenna Associates LLC | 0 | -100,00 | 0 | |||||
| 2025-11-13 | 13F | Prudent Man Advisors, LLC | 0 | -100,00 | 0 | |||||
| 2026-02-06 | 13F | Sierra Summit Advisors Llc | 0 | -100,00 | 0 | -100,00 | ||||
| 2025-11-21 | 13F/A | Royal Bank Of Canada | Call | 0 | -100,00 | 0 | -100,00 | |||
| 2026-02-09 | 13F | Geode Capital Management, Llc | 3.434.062 | 1,03 | 55.744 | -24,71 | ||||
| 2026-01-29 | 13F | Teachers Retirement System Of The State Of Kentucky | 76.813 | 204,80 | 1 | |||||
| 2026-02-12 | 13F | Richard W. Paul & Associates, LLC | 147 | 0,00 | 2 | -33,33 | ||||
| 2026-04-28 | 13F | Flagship Harbor Advisors, Llc | 0 | -100,00 | 0 | |||||
| 2026-02-06 | 13F | Bare Financial Services, Inc | 34 | 1 | ||||||
| 2026-01-12 | 13F | Rialto Wealth Management, LLC | 7 | 133,33 | 0 | |||||
| 2026-02-09 | 13F | Penn Capital Management Co Inc | 694.766 | -2,68 | 11.305 | -27,48 | ||||
| 2025-11-12 | 13F | Park Square Financial Group, LLC | 0 | -100,00 | 0 |