Grundlæggende statistik
| Institutionelle aktier (lange) | 97.270.928 - 32,05% (ex 13D/G) - change of 22,40MM shares 29,92% MRQ |
| Institutionel værdi (lang) | $ 341.185 USD ($1000) |
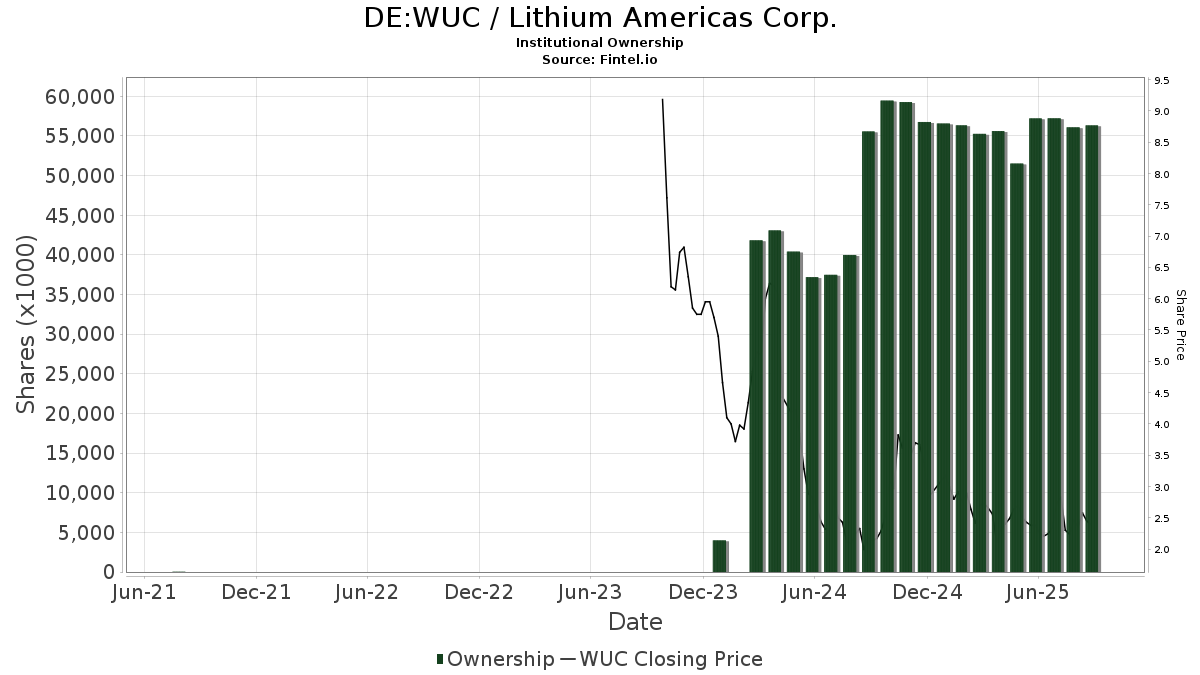
Institutionelt ejerskab og aktionærer
Lithium Americas Corp. (DE:WUC) har 298 institutionelle ejere og aktionærer, der har indsendt 13D/G- eller 13F-formularer til Securities Exchange Commission (SEC). Disse institutioner har i alt 97,270,928 aktier. Største aktionærer omfatter Van Eck Associates Corp, General Motors Holdings LLC, Two Sigma Investments, Lp, Millennium Management Llc, Morgan Stanley, Susquehanna International Group, Llp, Legal & General Group Plc, Walleye Capital LLC, Invesco Ltd., and D. E. Shaw & Co., Inc. .
Lithium Americas Corp. (DB:WUC) institutionel ejerskabsstruktur viser aktuelle positioner i virksomheden efter institutioner og fonde, samt seneste ændringer i positionsstørrelse. Større aktionærer kan omfatte individuelle investorer, investeringsforeninger, hedgefonde eller institutioner. Skema 13D angiver, at investoren besidder (eller besidder) mere end 5 % af virksomheden og har til hensigt (eller har til hensigt at) aktivt at forfølge en ændring i forretningsstrategi. Skema 13G indikerer en passiv investering på over 5%.
The share price as of March 17, 2026 is 3,86 / share. Previously, on March 18, 2025, the share price was 2,78 / share. This represents an increase of 38,86% over that period.
Fondens stemningsscore
Fund Sentiment Score (fka Ownership Accumulation Score) finder de aktier, der bliver mest købt af fonde. Det er resultatet af en sofistikeret, multi-faktor kvantitativ model, der identificerer virksomheder med de højeste niveauer af institutionel akkumulering. Scoringsmodellen bruger en kombination af den samlede stigning i oplyste ejere, ændringerne i porteføljeallokeringer i disse ejere og andre målinger. Tallet går fra 0 til 100, hvor højere tal indikerer et højere niveau af akkumulering for sine jævnaldrende, og 50 er gennemsnittet.
Opdateringsfrekvens: Dagligt
Se Ownership Explorer, som giver en liste over højest rangerende virksomheder.
AI+ Ask Fintel’s AI assistant about Lithium Americas Corp..
Select a question to share a public post with an AI-crafted answer.
Thinking of good questions…
13F og NPORT arkivering
Detaljer om 13F-arkivering er gratis. Detaljer om NP-ansøgninger kræver et premium-medlemskab. Grønne rækker angiver nye positioner. Røde rækker angiver lukkede positioner. Klik på linket ikon for at se den fulde transaktionshistorik.
Opgrader
for at låse premium-data op og eksportere til Excel ![]() .
.
| Fil dato | Kilde | Investor | Type | Gennemsnitlig pris (Øst) |
Aktier | Δ Aktier (%) |
Rapporteret Værdi ($1000) |
Δ Værdi (%) |
Port Alloc (%) |
|
|---|---|---|---|---|---|---|---|---|---|---|
| 2026-02-17 | 13F | Balyasny Asset Management Llc | 1.137.246 | 4.958 | ||||||
| 2026-01-21 | 13F | Capital Advisors, Ltd. LLC | 1.500 | 0,00 | 0 | |||||
| 2026-02-03 | 13F | Ballentine Partners, LLC | 23.182 | -6,91 | 101 | -28,87 | ||||
| 2026-02-06 | 13F | FourThought Financial Partners, LLC | 170.273 | 742 | ||||||
| 2026-02-13 | 13F | SRS Capital Advisors, Inc. | 2.259 | 0,40 | 10 | -25,00 | ||||
| 2026-02-12 | 13F | Groupe la Francaise | 0 | -100,00 | 0 | |||||
| 2026-01-23 | 13F | Farther Finance Advisors, LLC | 25.284 | 1.480,25 | 110 | 1.122,22 | ||||
| 2026-01-26 | 13F | Main Street Group, LTD | 0 | -100,00 | 0 | -100,00 | ||||
| 2026-02-12 | 13F | Scotia Capital Inc. | 0 | -100,00 | 0 | -100,00 | ||||
| 2026-02-17 | 13F | Two Sigma Advisers, Lp | 576.804 | 2.515 | ||||||
| 2026-02-17 | 13F | IHT Wealth Management, LLC | 0 | -100,00 | 0 | |||||
| 2026-02-17 | 13F | Clear Street Markets Llc | 0 | -100,00 | 0 | |||||
| 2026-02-13 | 13F | Citigroup Inc | 23.212 | 160,63 | 101 | 102,00 | ||||
| 2026-02-10 | 13F | Goldman Sachs Group Inc | 1.432.745 | -37,96 | 6.247 | -52,64 | ||||
| 2026-02-10 | 13F | Bnp Paribas Arbitrage, Sa | 1.479.668 | 320,71 | 6.451 | 221,26 | ||||
| 2026-02-17 | 13F | Jones Financial Companies Lllp | 135.622 | 38,58 | 591 | -4,52 | ||||
| 2025-11-06 | 13F | Claudia M.p. Batlle, Crp (r) Llc | 0 | -100,00 | 0 | |||||
| 2025-11-14 | 13F | Adage Capital Partners Gp, L.l.c. | 0 | -100,00 | 0 | -100,00 | ||||
| 2026-02-12 | 13F | Colonial Trust Advisors | 3.600 | 125,00 | 16 | 66,67 | ||||
| 2026-02-12 | 13F | Sprott Inc. | 16.087 | 18,75 | 70 | -9,09 | ||||
| 2026-02-11 | 13F | Hilton Head Capital Partners, LLC | 100 | 0 | ||||||
| 2026-01-20 | 13F | AdvisorNet Financial, Inc | 799 | -4,08 | 3 | -25,00 | ||||
| 2026-01-14 | 13F | ORG Partners LLC | 150 | 0,00 | 1 | |||||
| 2026-01-08 | 13F | True Wealth Design, LLC | 600 | 0,00 | 3 | -33,33 | ||||
| 2026-01-26 | 13F | PFG Investments, LLC | 20.559 | 90 | ||||||
| 2026-02-17 | 13F | SIG North Trading, ULC | Call | 107.900 | 22,34 | 470 | -6,56 | |||
| 2026-02-13 | 13F | Aviso Financial Inc. | 0 | -100,00 | 0 | |||||
| 2026-02-17 | 13F | SIG North Trading, ULC | 39.977 | -76,50 | 174 | -82,08 | ||||
| 2026-02-17 | 13F | SIG North Trading, ULC | Put | 81.300 | 25,08 | 354 | -4,58 | |||
| 2026-02-13 | 13F | Mariner, LLC | 13.934 | -6,82 | 61 | -29,41 | ||||
| 2025-11-12 | 13F | Transce3nd, LLC | 0 | -100,00 | 0 | |||||
| 2026-01-21 | 13F | Newbridge Financial Services Group, Inc. | 2.329 | 0,00 | 10 | -23,08 | ||||
| 2026-02-13 | 13F | Caitong International Asset Management Co., Ltd | 0 | -100,00 | 0 | |||||
| 2026-02-17 | 13F | Optiver Holding B.V. | 0 | -100,00 | 0 | |||||
| 2025-09-29 | NP | DMAT - Global X Disruptive Materials ETF This fund is a listed as child fund of Mirae Asset Global Investments Co., Ltd. and if that institution has disclosed ownership in this security, then these positions will not be double counted when calculating total shares and total value | 5.021 | 5,39 | 13 | -7,69 | ||||
| 2026-01-05 | 13F | Coastline Trust Co | 150 | 1 | ||||||
| 2026-02-13 | 13F | OMERS ADMINISTRATION Corp | 0 | -100,00 | 0 | |||||
| 2025-11-14 | 13F | Verition Fund Management LLC | Call | 0 | -100,00 | 0 | -100,00 | |||
| 2025-10-15 | 13F | Global X Japan Co., Ltd. | 0 | -100,00 | 0 | |||||
| 2026-02-26 | 13F/A | Sculptor Capital LP | 0 | -100,00 | 0 | -100,00 | ||||
| 2026-02-26 | 13F/A | Sculptor Capital LP | Put | 0 | -100,00 | 0 | -100,00 | |||
| 2026-01-14 | 13F | Tradewinds Capital Management, LLC | 265 | 0,00 | 1 | 0,00 | ||||
| 2026-02-13 | 13F | FORA Capital, LLC | 20.348 | 89 | ||||||
| 2026-02-02 | 13F | Ping Capital Management, Inc. | 25.000 | 109 | ||||||
| 2026-02-17 | 13F | Murchinson Ltd. | Call | 0 | -100,00 | 0 | ||||
| 2026-02-13 | 13F | TRUE Private Wealth Advisors | 10.960 | 48 | ||||||
| 2026-02-13 | 13F | Headlands Technologies LLC | 53.439 | 233 | ||||||
| 2026-02-04 | 13F | Ameritas Advisory Services, LLC | 0 | -100,00 | 0 | |||||
| 2026-02-12 | 13F | Triumph Capital Management | 397 | 11,52 | 2 | -50,00 | ||||
| 2026-01-28 | 13F | Edge Financial Advisors LLC | 14.044 | 175 | ||||||
| 2026-02-17 | 13F | Dv Equities, Llc | 50 | 0 | ||||||
| 2026-02-17 | 13F | Boothbay Fund Management, Llc | Call | 0 | -100,00 | 0 | ||||
| 2025-11-10 | 13F | Thoroughbred Financial Services, Llc | 0 | -100,00 | 0 | |||||
| 2026-02-17 | 13F | Fairscale Capital, LLC | 792 | 0,00 | 3 | -25,00 | ||||
| 2026-02-17 | 13F | Advisory Services Network, LLC | 0 | -100,00 | 0 | |||||
| 2026-02-05 | 13F | May Hill Capital, LLC | 17.660 | 77 | ||||||
| 2026-02-10 | 13F | Td Asset Management Inc | 766.483 | 216,83 | 3.338 | 141,53 | ||||
| 2026-02-13 | 13F | Clear Street Group Inc. | 32 | 0 | ||||||
| 2026-02-17 | 13F | Wiley Bros.-aintree Capital, Llc | 0 | -100,00 | 0 | |||||
| 2026-02-13 | 13F | Squarepoint Ops LLC | Call | 140.000 | 1.208,41 | 610 | 900,00 | |||
| 2026-02-13 | 13F | Squarepoint Ops LLC | Put | 225.700 | 1.649,61 | 984 | 1.247,95 | |||
| 2026-02-13 | 13F | Squarepoint Ops LLC | 122.335 | 533 | ||||||
| 2026-02-13 | 13F | Blueshift Asset Management, LLC | 10.773 | -35,00 | 47 | -51,06 | ||||
| 2026-02-12 | 13F | Counterpoint Mutual Funds LLC | 0 | -100,00 | 0 | |||||
| 2026-02-13 | 13F | Aire Advisors, Llc | 29.747 | 130 | ||||||
| 2026-02-06 | 13F | Banque Cantonale Vaudoise | 21.614 | 95 | ||||||
| 2026-02-17 | 13F | Susquehanna International Group, Llp | Call | 1.262.700 | -21,72 | 5.505 | -40,23 | |||
| 2026-02-17 | 13F | Susquehanna International Group, Llp | 3.097.224 | 117,67 | 13.504 | 66,21 | ||||
| 2026-02-17 | 13F | Susquehanna International Group, Llp | Put | 2.173.200 | 142,38 | 9.475 | 85,09 | |||
| 2025-11-10 | 13F/A | Flaharty Asset Management, LLC | 0 | -100,00 | 0 | |||||
| 2025-11-07 | 13F | Atticus Wealth Management, Llc | 0 | -100,00 | 0 | |||||
| 2026-01-09 | 13F | Teamwork Financial Advisors, LLC | 379.828 | -70,37 | 1.656 | -77,37 | ||||
| 2026-02-12 | 13F | Gould Capital, LLC | 2.000 | 0,00 | 9 | -27,27 | ||||
| 2026-02-17 | 13F | Caption Management, LLC | Put | 0 | -100,00 | 0 | ||||
| 2026-02-13 | 13F | Barclays Plc | 93.575 | -16,59 | 408 | -36,41 | ||||
| 2025-11-13 | 13F | Diversify Advisory Services, LLC | 0 | -100,00 | 0 | -100,00 | ||||
| 2026-02-17 | 13F | Parallax Volatility Advisers, L.P. | 0 | -100,00 | 0 | |||||
| 2026-02-17 | 13F | Parallax Volatility Advisers, L.P. | Put | 0 | -100,00 | 0 | ||||
| 2026-02-04 | 13F | Birchbrook, Inc. | 2.000 | 0,00 | 9 | -27,27 | ||||
| 2026-02-06 | 13F | GPS Wealth Strategies Group, LLC | 0 | -100,00 | 0 | |||||
| 2026-02-17 | 13F | Northern Trust Corp | 17.137 | 0,00 | 75 | -23,71 | ||||
| 2026-02-12 | 13F | Commonwealth Equity Services, Llc | 98.795 | 15,92 | 431 | |||||
| 2026-02-17 | 13F | Schonfeld Strategic Advisors LLC | 18.400 | 80 | ||||||
| 2026-02-12 | 13F | Wedbush Securities Inc | 33.060 | 0 | ||||||
| 2026-02-17 | 13F | Massar Capital Management, LP | 292.183 | 1.274 | ||||||
| 2026-02-17 | 13F | Scientech Research LLC | 0 | -100,00 | 0 | |||||
| 2026-01-16 | 13F | Louisbourg Investments Inc. | 0 | -100,00 | 0 | |||||
| 2026-01-05 | 13F | GK Wealth Management LLC | 0 | -100,00 | 0 | -100,00 | ||||
| 2026-01-15 | 13F | Founders Capital Management | 5.100 | 0,00 | 22 | -24,14 | ||||
| 2026-02-02 | 13F | Oppenheimer & Co Inc | 14.190 | 35,16 | 62 | 3,39 | ||||
| 2026-01-22 | 13F | Vision Financial Markets Llc | 2.906 | 0,00 | 13 | -25,00 | ||||
| 2026-01-29 | 13F | UBS Group AG | 416.455 | -27,23 | 1.816 | -44,44 | ||||
| 2026-02-17 | 13F | Bank Of America Corp /de/ | 2.105.504 | 205,63 | 9.180 | 133,38 | ||||
| 2026-02-17 | 13F | J. Goldman & Co LP | Call | 30.000 | 131 | |||||
| 2026-02-13 | 13F | Centiva Capital, LP | 31.908 | 18,89 | 139 | -9,15 | ||||
| 2026-02-17 | 13F | Public Employees Retirement System Of Ohio | 71.463 | 5,64 | 311 | -20,87 | ||||
| 2026-02-13 | 13F | Evelyn Partners Investment Management LLP | 300 | 0,00 | 1 | 0,00 | ||||
| 2026-01-27 | 13F | Sterling Investment Counsel, LLC | 28.391 | 2,85 | 124 | -21,66 | ||||
| 2026-02-06 | 13F | Tortoise Investment Management, LLC | 0 | -100,00 | 0 | |||||
| 2026-01-20 | 13F | Signaturefd, Llc | 24.553 | 5,52 | 107 | -18,94 | ||||
| 2026-02-06 | 13F | Leonteq Securities AG | 0 | -100,00 | 0 | |||||
| 2026-02-18 | 13F | Caitlin John, LLC | 3.040 | 2.940,00 | 13 | |||||
| 2026-02-13 | 13F | Marathon Trading Investment Management LLC | 92.300 | 4,65 | 402 | -20,08 | ||||
| 2026-02-12 | 13F | Renaissance Technologies Llc | 879.200 | 3.833 | ||||||
| 2026-02-17 | 13F | Strive Financial Group ,LLC | 23 | 0 | ||||||
| 2025-11-13 | 13F | Quinn Opportunity Partners LLC | 0 | -100,00 | 0 | |||||
| 2026-02-12 | 13F | Swiss National Bank | 440.600 | 14,12 | 1.920 | -12,96 | ||||
| 2026-02-13 | 13F | Rhumbline Advisers | 346 | 0,00 | 2 | 0,00 | ||||
| 2026-02-06 | 13F | Lloyd Advisory Services, LLC. | 625 | 3 | ||||||
| 2026-02-13 | 13F | Hudson Bay Capital Management LP | Put | 0 | -100,00 | 0 | ||||
| 2026-02-03 | 13F | Coston, McIsaac & Partners | 53 | 0,00 | 0 | |||||
| 2026-02-12 | 13F | Bank Of Montreal /can/ | 809.170 | 2.673,22 | 3.520 | 2.857,14 | ||||
| 2026-01-29 | 13F | Sanctuary Advisors, LLC | 68.486 | 299 | ||||||
| 2026-01-27 | 13F | Symmetry Partners, LLC | 19.610 | 86 | ||||||
| 2026-02-12 | 13F | DRW Securities, LLC | 0 | -100,00 | 0 | |||||
| 2026-02-17 | 13F | Mercer Global Advisors Inc /adv | 92.850 | 2,10 | 405 | -21,86 | ||||
| 2026-01-27 | 13F | Hedges Asset Management LLC | 70.000 | 40,00 | 305 | 7,02 | ||||
| 2026-01-30 | 13F | Caldwell Securities, Inc | 4.000 | 0,00 | 17 | -22,73 | ||||
| 2026-02-11 | 13F | Parallel Advisors, LLC | 5.567 | 10,87 | 24 | -14,29 | ||||
| 2026-01-29 | 13F | IMC-Chicago, LLC | 0 | -100,00 | 0 | |||||
| 2026-01-22 | 13F | Quotient Wealth Partners, LLC | 72.398 | 325,87 | 316 | 224,74 | ||||
| 2026-02-17 | 13F | Private Advisor Group, LLC | 13.008 | 57 | ||||||
| 2026-02-13 | 13F | Walleye Capital LLC | Put | 73.700 | 24.466,67 | 321 | 32.000,00 | |||
| 2026-02-13 | 13F | Walleye Capital LLC | 2.382.197 | 3.804,22 | 10.386 | 2.884,48 | ||||
| 2026-02-13 | 13F | Walleye Capital LLC | Call | 166.800 | 2.282,86 | 727 | 1.764,10 | |||
| 2026-02-13 | 13F | JustInvest LLC | 12.728 | 8,46 | 55 | -17,91 | ||||
| 2026-02-23 | 13F | Virtu Financial LLC | 181.025 | 92,85 | 1 | |||||
| 2026-01-28 | 13F | Hoey Investments, Inc | 150 | 0,00 | 1 | |||||
| 2026-02-06 | 13F | Creative Financial Designs Inc /adv | 6.000 | -14,29 | 26 | -33,33 | ||||
| 2026-02-17 | 13F | Alliancebernstein L.p. | 13.082 | 57 | ||||||
| 2026-02-03 | 13F | Garner Asset Management Corp | 100 | 0 | ||||||
| 2026-02-11 | 13F | Vermillion Wealth Management, Inc. | 500 | 2 | ||||||
| 2026-01-21 | 13F | Sound Income Strategies, LLC | 800 | 77,78 | 5 | 33,33 | ||||
| 2026-02-10 | 13F | CIBC World Markets Inc. | 16.003 | 70 | ||||||
| 2026-01-26 | 13F | Cwm, Llc | 2.672 | 4.353,33 | 0 | |||||
| 2025-10-20 | 13F | Masso Torrence Wealth Management Inc. | 10.000 | 57 | ||||||
| 2026-02-12 | 13F | Dimensional Fund Advisors Lp | 171.293 | 3,87 | 747 | -20,72 | ||||
| 2026-02-11 | 13F | Deutsche Bank Ag\ | 25.508 | -9,85 | 111 | -31,06 | ||||
| 2026-02-17 | 13F | Old West Investment Management, LLC | 807.391 | -39,71 | 3.520 | -53,97 | ||||
| 2026-01-05 | 13F | Roxbury Financial LLC | 93 | 0,00 | 0 | |||||
| 2026-02-13 | 13F | Umb Bank N A/mo | 28.605 | 0,00 | 125 | -23,93 | ||||
| 2026-01-21 | 13F | Flagship Harbor Advisors, Llc | 300 | 1 | ||||||
| 2026-02-17 | 13F | Investment Management Corp of Ontario | 32.000 | 140 | ||||||
| 2026-01-16 | 13F | Formidable Asset Management, LLC | 201.133 | -17,87 | 1.043 | 14,51 | ||||
| 2026-02-02 | 13F | Mutual Advisors, LLC | 76.931 | 0,00 | 335 | -32,73 | ||||
| 2026-02-06 | 13F | IFP Advisors, Inc | 6.496 | 1.253,33 | 28 | 1.300,00 | ||||
| 2026-01-26 | 13F | Independent Wealth Network Inc. | 149.466 | -9,84 | 652 | -31,18 | ||||
| 2026-01-14 | 13F | Spire Wealth Management | 1.786 | 127,23 | 8 | 75,00 | ||||
| 2026-02-03 | 13F | SBI Securities Co., Ltd. | 43.481 | 71,04 | 190 | 30,34 | ||||
| 2026-02-05 | 13F | Tucker Asset Management Llc | 862 | 4 | ||||||
| 2026-01-16 | 13F | Vanguard Capital Wealth Advisors This fund is a listed as child fund of Vanguard Group Inc and if that institution has disclosed ownership in this security, then these positions will not be double counted when calculating total shares and total value | 0 | -100,00 | 0 | -100,00 | ||||
| 2026-02-11 | 13F | Modus Advisors, LLC | 20 | 0 | ||||||
| 2026-02-12 | 13F | BlackRock, Inc. | 524.491 | 20,92 | 2.287 | -7,67 | ||||
| 2026-02-17 | 13F | Bank Of America Corp /de/ | Call | 0 | -100,00 | 0 | -100,00 | |||
| 2026-02-12 | 13F | Hm Payson & Co | 30 | 0 | ||||||
| 2026-01-27 | 13F | TD Waterhouse Canada Inc. | 1.495 | -6,27 | 6 | -45,45 | ||||
| 2026-01-20 | 13F | Hanson & Doremus Investment Management | 65 | 0 | ||||||
| 2026-02-17 | 13F | Prelude Capital Management, Llc | 19.446 | 85 | ||||||
| 2026-02-11 | 13F | LPL Financial LLC | 436.907 | 20,34 | 1.905 | -8,15 | ||||
| 2025-11-14 | 13F | Cubist Systematic Strategies, LLC | 117.142 | 669 | ||||||
| 2026-02-11 | 13F | LPL Financial LLC | Call | 10.400 | 45 | |||||
| 2026-02-12 | 13F | Marex Group plc | 129.099 | 563 | ||||||
| 2026-02-17 | 13F | Cambria Investment Management, L.P. | 24.528 | 107 | ||||||
| 2026-02-13 | 13F | FirstWave Capital Management LLC | 188.100 | 820 | ||||||
| 2026-01-13 | 13F | CoreCap Advisors, LLC | 4.541 | 0,22 | 20 | -24,00 | ||||
| 2026-02-04 | 13F | Kailix Advisors LLC | 1.175.000 | 5.123 | ||||||
| 2026-02-17 | 13F | Toronto Dominion Bank | 157.872 | 636,76 | 687 | 462,30 | ||||
| 2026-02-12 | 13F | Jane Street Group, Llc | 2.068.231 | 407,74 | 9.017 | 287,83 | ||||
| 2026-02-12 | 13F | Jane Street Group, Llc | Put | 181.300 | -40,13 | 790 | -54,28 | |||
| 2026-02-12 | 13F | Nuveen, LLC | 157.284 | 0,00 | 685 | -23,72 | ||||
| 2026-02-06 | 13F | VSM Wealth Advisory, LLC | 1.000 | 0,00 | 4 | -20,00 | ||||
| 2026-02-12 | 13F | Jane Street Group, Llc | Call | 968.700 | 234,73 | 4.224 | 155,63 | |||
| 2025-12-09 | 13F | Painted Porch Advisors LLC | 630 | 0,00 | 4 | 200,00 | ||||
| 2026-01-16 | 13F | FNY Investment Advisers, LLC | 0 | -100,00 | 0 | |||||
| 2026-02-13 | 13F | Delos Wealth Advisors, LLC | Call | 3 | ||||||
| 2026-02-13 | 13F | General Motors Holdings LLC | 15.002.243 | 0,00 | 65.410 | -23,64 | ||||
| 2026-01-29 | 13F | Nbc Securities, Inc. | 22 | 0,00 | 0 | |||||
| 2026-02-17 | 13F | XTX Topco Ltd | 12.572 | -88,10 | 55 | -91,04 | ||||
| 2026-02-06 | 13F | Global Retirement Partners, LLC | 3.627 | 200,50 | 16 | 150,00 | ||||
| 2026-01-28 | 13F | Geneos Wealth Management Inc. | 2.804 | 3,70 | 12 | -20,00 | ||||
| 2026-02-09 | 13F | Legal & General Group Plc | 3.062.306 | 212,67 | 13.349 | 138,72 | ||||
| 2026-02-05 | 13F | Cambridge Investment Research Advisors, Inc. | 210.181 | 55,62 | 1 | |||||
| 2026-02-12 | 13F | Hrt Financial Lp | 537.715 | -60,35 | 2 | -71,43 | ||||
| 2026-02-17 | 13F | MIRAE ASSET GLOBAL ETFS HOLDINGS Ltd. | 1.354.926 | -26,80 | 5.901 | -44,20 | ||||
| 2026-02-12 | 13F | Mark Sheptoff Financial Planning, Llc | 1.800 | 125,00 | 8 | 75,00 | ||||
| 2026-02-17 | 13F | Second Line Capital, LLC | 18.400 | -9,80 | 80 | -31,03 | ||||
| 2026-02-13 | 13F | Quarry LP | 0 | -100,00 | 0 | |||||
| 2026-02-13 | 13F | Stifel Financial Corp | 73.276 | -65,21 | 319 | -73,46 | ||||
| 2026-02-10 | 13F | CIBC Asset Management Inc | 235.588 | 1.025 | ||||||
| 2026-02-10 | 13F | Core Wealth Advisors, Llc | 376 | 2 | ||||||
| 2026-02-17 | 13F | WFA of San Diego, LLC | 100 | 0 | ||||||
| 2026-02-11 | 13F | Empowered Funds, LLC | 24.528 | -88,70 | 107 | -91,44 | ||||
| 2026-01-29 | 13F | Vanguard Group Inc | 194.863 | 20,01 | 848 | -8,63 | ||||
| 2026-02-02 | 13F | Truist Financial Corp | 24.308 | 38,46 | 106 | 5,00 | ||||
| 2026-01-30 | 13F | Us Bancorp \de\ | 2.741 | 59,92 | 12 | 22,22 | ||||
| 2025-11-13 | 13F | Total Investment Management Inc | 0 | -100,00 | 0 | -100,00 | ||||
| 2025-11-14 | 13F | Gotham Asset Management, LLC | 0 | -100,00 | 0 | |||||
| 2026-02-12 | 13F | Federation des caisses Desjardins du Quebec | 13.040 | 8,36 | 57 | -17,65 | ||||
| 2026-02-17 | 13F | Raymond James Financial Inc | 82.930 | 83,92 | 362 | 40,47 | ||||
| 2026-02-17 | 13F | Captrust Financial Advisors | 27.728 | 121 | ||||||
| 2026-02-11 | 13F | Group One Trading, L.p. | 63.364 | -53,15 | 276 | -64,25 | ||||
| 2026-01-27 | 13F | Revisor Wealth Management LLC | 366.418 | 123,67 | 1.923 | 45,94 | ||||
| 2026-02-06 | 13F | Axxcess Wealth Management, Llc | 16.582 | 0,00 | 72 | -23,40 | ||||
| 2025-11-14 | 13F | Ubs Asset Management Americas Inc | 0 | -100,00 | 0 | -100,00 | ||||
| 2026-01-27 | 13F | Atlantic Edge Private Wealth Management, LLC | 750 | 3 | ||||||
| 2026-02-10 | 13F | Koss-Olinger Consulting, LLC | 231.449 | -23,90 | 1.009 | 23,80 | ||||
| 2026-01-23 | 13F | Optima Capital Llc | 1.705 | 7 | ||||||
| 2026-02-06 | 13F | Global Retirement Partners, LLC | Call | 200 | 0,00 | 0 | ||||
| 2026-02-03 | 13F/A | Bank Of America Corp /de/ | Put | 0 | -100,00 | 0 | -100,00 | |||
| 2026-02-04 | 13F | Argos Wealth Advisors, LLC | 14.703 | 64 | ||||||
| 2026-01-29 | 13F | Pictet Asset Management Holding SA | 40.738 | 18,80 | 177 | -9,23 | ||||
| 2026-01-16 | 13F | Matauro, Llc | 16.807 | 0,00 | 73 | -23,16 | ||||
| 2026-02-10 | 13F/A | Northwestern Mutual Wealth Management Co | 8.306 | 10,56 | 36 | -14,29 | ||||
| 2026-02-13 | 13F | BRITISH COLUMBIA INVESTMENT MANAGEMENT Corp | 138.587 | 603 | ||||||
| 2026-02-13 | 13F | Missouri Trust & Investment Co | 75 | 0,00 | 0 | |||||
| 2026-02-09 | 13F | Catalyst Funds Management Pty Ltd | 16.900 | 74 | ||||||
| 2025-09-24 | NP | IDEV - iShares Core MSCI International Developed Markets ETF | 204.772 | 23,05 | 528 | 10,25 | ||||
| 2026-02-12 | 13F | Brinker Capital Investments, LLC | 17.240 | 1,21 | 75 | -22,68 | ||||
| 2026-02-09 | 13F | Geode Capital Management, Llc | 157.335 | 25,76 | 703 | -1,40 | ||||
| 2026-02-17 | 13F | Creative Planning | 58.937 | -16,64 | 257 | -36,48 | ||||
| 2026-02-17 | 13F | SageView Advisory Group, LLC | 330 | 1 | ||||||
| 2026-02-17 | 13F | Dark Forest Capital Management Lp | 249.768 | 1.089 | ||||||
| 2026-02-12 | 13F | Great Valley Advisor Group, Inc. | 10.053 | 44 | ||||||
| 2026-02-10 | 13F | Belvedere Trading LLC | Put | 7.100 | -43,65 | 71 | -27,08 | |||
| 2026-02-10 | 13F | Belvedere Trading LLC | Call | 159.500 | 107,95 | 1.162 | 165,90 | |||
| 2026-02-13 | 13F | Toroso Investments, LLC | 71.492 | 2,05 | 312 | -22,25 | ||||
| 2026-02-17 | 13F | Concentric Capital Strategies, LP | 0 | -100,00 | 0 | -100,00 | ||||
| 2026-02-13 | 13F | Glen Eagle Advisors, LLC | 12.500 | 0,00 | 54 | -23,94 | ||||
| 2026-02-06 | 13F | HighTower Advisors, LLC | 46.291 | 41,06 | 202 | 7,49 | ||||
| 2026-02-09 | 13F | Prospera Financial Services Inc | 20.176 | 51,47 | 88 | 14,47 | ||||
| 2026-02-06 | 13F | Capstone Capital Management Ltd | 23.362 | 102 | ||||||
| 2026-02-17 | 13F | Ameriprise Financial Inc | 110.722 | -21,13 | 483 | -39,83 | ||||
| 2026-01-28 | 13F | Quaker Wealth Management, LLC | 17 | 0,00 | 0 | |||||
| 2026-01-16 | 13F | Perigon Wealth Management, LLC | 15.899 | 0,47 | 69 | -23,33 | ||||
| 2025-11-07 | 13F | Shell Asset Management Co | 2.663 | -75,11 | 0 | |||||
| 2026-02-12 | 13F | Alps Advisors Inc | 628.882 | 69,32 | 2.742 | 29,29 | ||||
| 2025-11-17 | 13F | Silicon Valley Capital Partners | 0 | 0 | ||||||
| 2026-02-13 | 13F | National Bank Of Canada /fi/ | 298.803 | 100,89 | 1.301 | 53,12 | ||||
| 2026-02-17 | 13F | Citadel Advisors Llc | 2.189.561 | 5,37 | 9.546 | -19,54 | ||||
| 2026-02-17 | 13F | Citadel Advisors Llc | Call | 1.700.100 | 138,44 | 7.412 | 82,07 | |||
| 2026-01-08 | 13F | Chesapeake Asset Management Llc | 1.375 | 0,00 | 6 | -28,57 | ||||
| 2026-02-17 | 13F | Citadel Advisors Llc | Put | 1.134.000 | 78,55 | 4.944 | 36,35 | |||
| 2026-01-16 | 13F | Legacy Capital Wealth Partners, LLC | 0 | -100,00 | 0 | |||||
| 2026-01-29 | 13F | D.a. Davidson & Co. | 22.050 | 0,00 | 96 | -23,20 | ||||
| 2026-01-16 | 13F | Balboa Wealth Partners | 62.423 | 30,00 | 272 | -0,73 | ||||
| 2025-11-07 | 13F | Credit Industriel Et Commercial | 0 | -100,00 | 0 | -100,00 | ||||
| 2026-02-10 | 13F | Reaves W H & Co Inc | 1.040.000 | 420,00 | 4.534 | 297,02 | ||||
| 2026-01-28 | 13F | Legacy Capital Group California, Inc. | 28.519 | -38,91 | 124 | -53,38 | ||||
| 2026-02-13 | 13F | Walleye Trading LLC | 11.568 | -75,73 | 50 | -81,62 | ||||
| 2026-02-13 | 13F | Walleye Trading LLC | Put | 8.400 | 4.100,00 | 37 | 3.500,00 | |||
| 2025-11-14 | 13F | ExodusPoint Capital Management, LP | 133.565 | 251,49 | 763 | |||||
| 2026-02-13 | 13F | Walleye Trading LLC | Call | 35.200 | 966,67 | 153 | 750,00 | |||
| 2026-02-17 | 13F | Cetera Investment Advisers | 66.959 | 43,86 | 292 | 9,81 | ||||
| 2026-01-14 | 13F | Thompson Investment Management, Inc. | 500 | 0,00 | 2 | 0,00 | ||||
| 2026-02-17 | 13F | Keebeck Wealth Management, LLC | 10.000 | 44 | ||||||
| 2026-02-04 | 13F | Clark Wealth Partners | 376 | 0,00 | 2 | 0,00 | ||||
| 2026-01-05 | 13F | Rosenberg Matthew Hamilton | 1.000 | 0,00 | 4 | -20,00 | ||||
| 2026-02-17 | 13F | Keebeck Alpha, LP | 19.679 | 86 | ||||||
| 2026-02-12 | 13F | CIBC Private Wealth Group, LLC | 3.162 | 6,46 | 14 | -18,75 | ||||
| 2026-02-12 | 13F | IFC & Insurance Marketing, Inc. | 13.750 | 0 | ||||||
| 2026-01-20 | 13F | Independence Bank of Kentucky | 500 | 0,00 | 2 | 0,00 | ||||
| 2026-02-17 | 13F | SIH Partners, LLLP | 13.829 | -46,93 | 60 | -59,46 | ||||
| 2026-02-18 | 13F | Mackenzie Financial Corp | 244.073 | 114,52 | 1.074 | 65,49 | ||||
| 2026-02-17 | 13F | Trexquant Investment LP | 1.388.732 | 6.055 | ||||||
| 2026-02-09 | 13F | Hartland & Co., LLC | 50 | -90,91 | 0 | -100,00 | ||||
| 2025-09-26 | NP | FTIHX - Fidelity Total International Index Fund This fund is a listed as child fund of Fmr Llc and if that institution has disclosed ownership in this security, then these positions will not be double counted when calculating total shares and total value | 94.031 | 0,00 | 242 | -10,37 | ||||
| 2026-02-09 | 13F | Harbour Investments, Inc. | 15.188 | 1,37 | 66 | -22,35 | ||||
| 2025-11-13 | 13F | Eisler Capital Management Ltd. | Call | 150.000 | 1.155 | |||||
| 2025-11-13 | 13F | Eisler Capital Management Ltd. | Put | 1.000.000 | 7.700 | |||||
| 2026-01-05 | 13F | GK Wealth Management LLC | Call | 1.363.300 | 1.086,51 | 5.687 | 1.257,04 | |||
| 2026-01-16 | 13F | DiNuzzo Private Wealth, Inc. | 60 | 0,00 | 0 | |||||
| 2026-02-17 | 13F | LMR Partners LLP | Put | 100.000 | 436 | |||||
| 2026-02-17 | 13F | Matrix Private Capital Group Llc | 12.567 | 0,00 | 55 | -23,94 | ||||
| 2026-02-09 | 13F | Huntington National Bank | 1.000 | 0,00 | 4 | -20,00 | ||||
| 2026-02-17 | 13F | Engineers Gate Manager LP | 0 | -100,00 | 0 | |||||
| 2026-01-08 | 13F | Occidental Asset Management, LLC | 34.032 | 148 | ||||||
| 2025-09-29 | NP | PBW - Invesco WilderHill Clean Energy ETF This fund is a listed as child fund of Invesco Ltd. and if that institution has disclosed ownership in this security, then these positions will not be double counted when calculating total shares and total value | 1.672.375 | 35,87 | 4.298 | 21,69 | ||||
| 2025-09-29 | NP | LIT - Global X Lithium & Battery Tech ETF This fund is a listed as child fund of Mirae Asset Global Investments Co., Ltd. and if that institution has disclosed ownership in this security, then these positions will not be double counted when calculating total shares and total value | 1.740.207 | 11,00 | 4.494 | -0,02 | ||||
| 2026-02-17 | 13F | Royal Bank Of Canada | 60.365 | -89,83 | 263 | -92,24 | ||||
| 2026-02-17 | 13F | Two Sigma Securities, Llc | 27.097 | 118 | ||||||
| 2026-01-29 | 13F | St Germain D J Co Inc | 2.334 | -42,14 | 10 | -56,52 | ||||
| 2026-01-20 | 13F/A | Miller Wealth Advisors, Llc | 58 | 0 | ||||||
| 2026-02-12 | 13F | Edgewood Management Llc | 50.000 | 0,00 | 218 | -23,51 | ||||
| 2026-01-22 | 13F | Apollon Wealth Management, LLC | 14.797 | 7,61 | 65 | -17,95 | ||||
| 2026-02-02 | 13F | New England Capital Financial Advisors LLC | 50 | 0,00 | 0 | |||||
| 2026-02-17 | 13F | Graham Capital Management, L.P. | 29.890 | 130 | ||||||
| 2026-02-13 | 13F | Peak6 Llc | Call | 232.600 | -69,74 | 1.014 | -76,89 | |||
| 2026-02-13 | 13F | HITE Hedge Asset Management LLC | 0 | -100,00 | 0 | -100,00 | ||||
| 2026-01-15 | 13F | Victory Financial Group, Llc | 14.054 | -52,45 | 61 | -63,69 | ||||
| 2026-01-20 | 13F | Stratos Wealth Advisors, LLC | 13.176 | 0,00 | 57 | -24,00 | ||||
| 2026-02-19 | 13F | Mcguire Capital Advisors Inc | 135 | 1 | ||||||
| 2026-02-12 | 13F | Steward Partners Investment Advisory, Llc | 5.930 | 149,16 | 26 | 92,31 | ||||
| 2026-02-13 | 13F | American Century Companies Inc | 121.653 | 16,68 | 529 | -11,09 | ||||
| 2025-10-27 | 13F | Bogart Wealth, LLC | 0 | -100,00 | 0 | |||||
| 2026-02-10 | 13F | Belvedere Trading LLC | 0 | -100,00 | 0 | |||||
| 2026-02-13 | 13F | Smartleaf Asset Management LLC | 211 | 0,00 | 1 | -100,00 | ||||
| 2026-02-13 | 13F | Aigen Investment Management, Lp | 21.407 | 93 | ||||||
| 2025-10-21 | 13F | Optimum Investment Advisors | 1.500 | 0,00 | 9 | 100,00 | ||||
| 2026-01-23 | 13F | Gainplan LLC | 0 | -100,00 | 0 | |||||
| 2026-02-13 | 13F | Manufacturers Life Insurance Company, The | 0 | -100,00 | 0 | |||||
| 2026-02-17 | 13F | Tudor Investment Corp Et Al | Call | 219.100 | 955 | |||||
| 2026-02-13 | 13F | Morgan Stanley | 3.799.231 | 190,70 | 16.565 | 121,98 | ||||
| 2026-02-17 | 13F | Tudor Investment Corp Et Al | 29.627 | 41,08 | 129 | 8,40 | ||||
| 2025-11-13 | 13F | Pinney & Scofield, Inc. | 0 | -100,00 | 0 | |||||
| 2026-01-02 | 13F | Cacti Asset Management Llc | 5.000 | 0,00 | 23 | -29,03 | ||||
| 2026-02-17 | 13F | PharVision Advisers, LLC | 0 | -100,00 | 0 | -100,00 | ||||
| 2025-11-14 | 13F | Wolverine Trading, Llc | 121.977 | 734,54 | 700 | 1.650,00 | ||||
| 2025-11-14 | 13F | Wolverine Trading, Llc | Call | 364.200 | 244,23 | 2.091 | 613,31 | |||
| 2025-11-14 | 13F | Wolverine Trading, Llc | Put | 386.100 | 1.402,33 | 2.216 | 3.021,13 | |||
| 2026-02-06 | 13F | EverSource Wealth Advisors, LLC | 734 | 223,35 | 3 | 200,00 | ||||
| 2026-02-17 | 13F | Point72 Asset Management, L.P. | Call | 23.500 | 102 | |||||
| 2026-02-17 | 13F | Advisor Group Holdings, Inc. | 173.095 | 2,31 | 755 | -16,78 | ||||
| 2026-02-02 | 13F | Alpha Wealth Funds, LLC | 15.696 | 75 | ||||||
| 2026-02-17 | 13F | Point72 Asset Management, L.P. | 153.682 | -88,01 | 669 | -90,86 | ||||
| 2026-02-17 | 13F | Voloridge Investment Management, Llc | 343.278 | 13,97 | 1.497 | -12,97 | ||||
| 2026-02-12 | 13F | Skopos Labs, Inc. | 116.098 | 525 | ||||||
| 2026-01-23 | 13F | Aspect Partners, LLC | 405 | 2 | ||||||
| 2026-02-11 | 13F | Teachers Insurance & Annuity Association Of America | 0 | -100,00 | 0 | |||||
| 2026-01-27 | 13F | Zurcher Kantonalbank (Zurich Cantonalbank) | 142.234 | 510,13 | 619 | 365,41 | ||||
| 2026-02-13 | 13F | Golden State Wealth Management, LLC | 4.000 | 0,00 | 17 | -22,73 | ||||
| 2026-02-17 | 13F | Two Sigma Investments, Lp | 5.525.869 | 33.682,90 | 24.093 | 25.805,38 | ||||
| 2026-02-10 | 13F | Lido Advisors, LLC | 14.643 | -12,02 | 84 | -12,63 | ||||
| 2026-02-11 | 13F | Janney Montgomery Scott LLC | 0 | -100,00 | 0 | |||||
| 2026-02-05 | 13F | Baader Bank INC | 0 | -100,00 | 0 | -100,00 | ||||
| 2026-01-23 | 13F | Sage Investment Counsel LLC | 10.000 | 0,00 | 44 | -24,56 | ||||
| 2026-02-11 | 13F | Cedar Mountain Advisors, LLC | 1 | 0,00 | 0 | |||||
| 2026-02-13 | 13F | Verition Fund Management LLC | Put | 1.252.400 | 0,02 | 5.460 | -23,63 | |||
| 2026-02-13 | 13F | Verition Fund Management LLC | 1.055.699 | 0,58 | 4.603 | -23,21 | ||||
| 2026-02-03 | 13F | International Assets Investment Management, Llc | 35.975 | 202,95 | 157 | 403,23 | ||||
| 2026-01-30 | 13F | Kohmann Bosshard Financial Services, LLC | 100 | 0 | ||||||
| 2026-02-12 | 13F | Quadrant Capital Group Llc | 16.854 | 0,60 | 73 | -23,16 | ||||
| 2025-11-13 | 13F | Members Wealth Llc | 0 | -100,00 | 0 | |||||
| 2026-02-13 | 13F | Kestra Advisory Services, LLC | 9.552 | 42 | ||||||
| 2025-11-13 | 13F | Marshall Wace, Llp | 396.645 | 911,82 | 2.265 | 2.056,19 | ||||
| 2026-02-03 | 13F | Strengthening Families & Communities, LLC | 0 | -100,00 | 0 | |||||
| 2026-02-13 | 13F | Aptus Capital Advisors, LLC | 19.630 | -9,25 | 86 | -30,89 | ||||
| 2026-02-13 | 13F | Brown Advisory Inc | 17.406 | 0,00 | 76 | -24,24 | ||||
| 2026-02-11 | 13F | J.w. Cole Advisors, Inc. | 25.656 | 18,63 | 104 | -16,26 | ||||
| 2026-02-10 | 13F | One Capital Management, LLC | 33.000 | 0,00 | 144 | -23,94 | ||||
| 2026-02-12 | 13F | Helium Advisors LLC | 13.379 | 58 | ||||||
| 2026-02-02 | 13F | Millstone Evans Group, LLC | 1.020 | 0,00 | 4 | -20,00 | ||||
| 2026-02-05 | 13F | HighMark Wealth Management LLC | 300 | 1 | ||||||
| 2026-02-03 | 13F | RFG Advisory, LLC | 22.137 | 97 | ||||||
| 2026-02-13 | 13F | Parkside Financial Bank & Trust | 0 | -100,00 | 0 | |||||
| 2026-02-13 | 13F | Islay Capital Management, Llc | 0 | -100,00 | 0 | |||||
| 2026-02-17 | 13F | D. E. Shaw & Co., Inc. | Call | 50.000 | 0,00 | 218 | -23,51 | |||
| 2026-02-17 | 13F | D. E. Shaw & Co., Inc. | 2.270.079 | 423,64 | 9.892 | 299,68 | ||||
| 2026-01-08 | 13F | Wealth Enhancement Advisory Services, Llc | 322.301 | 0,78 | 1.757 | -33,59 | ||||
| 2026-02-17 | 13F | National Asset Management, Inc. | Call | 0 | -100,00 | 0 | ||||
| 2025-11-17 | 13F | Hancock Prospecting Pty Ltd | 0 | -100,00 | 0 | -100,00 | ||||
| 2026-02-17 | 13F | National Asset Management, Inc. | Put | 0 | -100,00 | 0 | ||||
| 2026-02-17 | 13F | National Asset Management, Inc. | 0 | -100,00 | 0 | |||||
| 2026-02-06 | 13F | Quantify Chaos Advisors, Llc | 19.351 | 84 | ||||||
| 2026-02-13 | 13F | Public Sector Pension Investment Board | 15.155 | 66 | ||||||
| 2026-02-10 | 13F/A | MJT & Associates Financial Advisory Group, Inc. | 325 | 0,00 | 1 | 0,00 | ||||
| 2026-02-18 | 13F | GWM Advisors LLC | 7.387 | 6,49 | 32 | -17,95 | ||||
| 2026-02-14 | 13F | Rockefeller Capital Management L.P. | 8.381 | 26,98 | 37 | -2,70 | ||||
| 2026-02-17 | 13F | NorthRock Partners, LLC | 21.912 | 96 | ||||||
| 2026-03-04 | 13F | SHP Wealth Management | 3.052 | 13 | ||||||
| 2026-02-13 | 13F | Van Eck Associates Corp | 17.495.908 | 20,83 | 76 | -7,32 | ||||
| 2026-02-03 | 13F | McIlrath & Eck, LLC | 34 | 0,00 | 0 | |||||
| 2026-02-13 | 13F | Ingalls & Snyder Llc | 14.000 | -44,44 | 0 | |||||
| 2026-01-27 | 13F | Financial Management Professionals, Inc. | 600 | 0,00 | 3 | -33,33 | ||||
| 2026-02-10 | 13F | Bruce G. Allen Investments, LLC | 185 | 0,00 | 1 | -100,00 | ||||
| 2026-02-05 | 13F | Allworth Financial LP | 31.478 | 189,93 | 137 | 124,59 | ||||
| 2026-02-17 | 13F | Tower Research Capital LLC (TRC) | 21.643 | -43,51 | 94 | -56,88 | ||||
| 2026-02-13 | 13F | Wells Fargo & Company/mn | 33.276 | -53,22 | 145 | -64,29 | ||||
| 2026-02-12 | 13F | Hollencrest Capital Management | 500 | -50,00 | 2 | -60,00 | ||||
| 2026-02-05 | 13F | Center for Financial Planning, Inc. | 321 | 0,00 | 1 | 0,00 | ||||
| 2026-02-12 | 13F | Wealthspire Advisors, LLC | 0 | -100,00 | 0 | |||||
| 2026-01-29 | 13F | Concord Wealth Partners | 71 | 0,00 | 0 | |||||
| 2026-02-11 | 13F | Jpmorgan Chase & Co | 780.656 | 3.404 | ||||||
| 2026-01-12 | 13F | Traynor Capital Management, Inc. | 0 | -100,00 | 0 | -100,00 | ||||
| 2026-02-17 | 13F | Quadrature Capital Ltd | 530.282 | 2.312 | ||||||
| 2025-11-13 | 13F | Connor, Clark & Lunn Investment Management Ltd. | 0 | -100,00 | 0 | |||||
| 2025-09-24 | NP | IXUS - iShares Core MSCI Total International Stock ETF | 316.129 | 0,00 | 815 | -10,35 | ||||
| 2026-02-10 | 13F | Moors & Cabot, Inc. | 14.968 | 65 | ||||||
| 2025-09-29 | NP | CCSO - Carbon Collective Climate Solutions U.S. Equity ETF | 7.605 | 0,00 | 20 | -9,52 | ||||
| 2026-01-07 | 13F | Aventura Private Wealth, LLC | 3.527 | 0,00 | 15 | -25,00 | ||||
| 2026-02-13 | 13F | Truvestments Capital Llc | 200 | 0,00 | 1 | -100,00 | ||||
| 2026-02-20 | 13F | Sunbelt Securities, Inc. | 950 | 0,00 | 4 | -20,00 | ||||
| 2026-01-21 | 13F | Sowell Financial Services LLC | 15.285 | 0,66 | 67 | -23,26 | ||||
| 2026-02-19 | 13F | Invesco Ltd. | 2.280.800 | -5,19 | 9.944 | -27,60 | ||||
| 2026-01-16 | 13F | Heck Capital Advisors, LLC | 11.690 | 51 | ||||||
| 2026-02-17 | 13F | Millennium Management Llc | 4.489.568 | 35,76 | 19.575 | 3,65 | ||||
| 2026-02-13 | 13F | MAI Capital Management | 2.230 | 81,30 | 10 | 28,57 | ||||
| 2026-02-17 | 13F | Aquatic Capital Management LLC | 447.266 | 1.950 | ||||||
| 2026-02-05 | 13F | Navalign, LLC | 500 | 2 | ||||||
| 2025-11-07 | 13F | Fifth Third Bancorp | 0 | -100,00 | 0 | -100,00 | ||||
| 2026-02-13 | 13F | Flow Traders U.s. Llc | 13.212 | 0 | ||||||
| 2026-02-06 | 13F | Larson Financial Group LLC | 10 | 0 | ||||||
| 2026-02-17 | 13F | Jump Financial, LLC | 13.885 | 61 | ||||||
| 2026-01-29 | 13F | Concurrent Investment Advisors, LLC | Call | 2.500 | 11 | |||||
| 2026-01-29 | 13F | Concurrent Investment Advisors, LLC | 39.688 | 173 | ||||||
| 2026-02-09 | 13F | Atlantic Trust, LLC | 1.892 | 8 | ||||||
| 2025-11-12 | 13F | HAP Trading, LLC | Call | 28.700 | 52 | |||||
| 2026-01-21 | 13F | Stone House Investment Management, LLC | 619 | 3 | ||||||
| 2026-02-04 | 13F | Atlantic Union Bankshares Corp | 200 | 1 |