Grundlæggende statistik
| Institutionelle ejere | 159 total, 159 long only, 0 short only, 0 long/short - change of -2,98% MRQ |
| Del pris | 22,00 |
| Gennemsnitlig porteføljeallokering | 0.0580 % - change of -29,95% MRQ |
| Institutionelle aktier (lange) | 20.087.965 (ex 13D/G) - change of -1,43MM shares -6,62% MRQ |
| Institutionel værdi (lang) | $ 388.205 USD ($1000) |
Institutionelt ejerskab og aktionærer
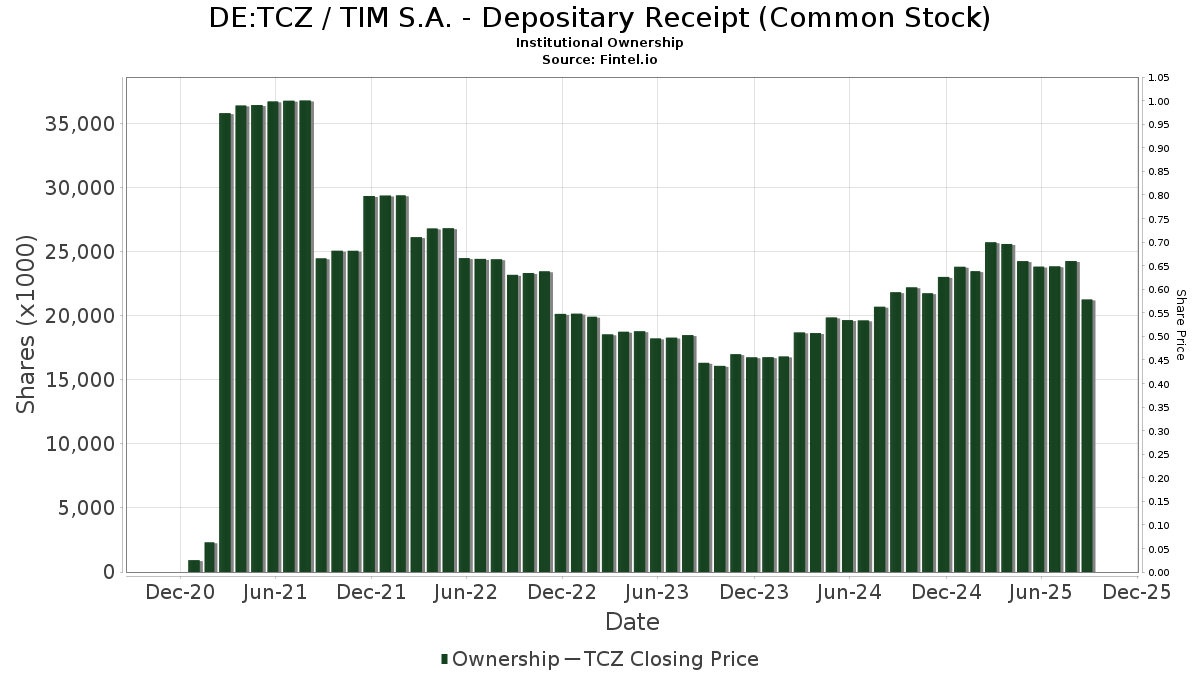
TIM S.A. - Depositary Receipt (Common Stock) (DE:TCZ) har 159 institutionelle ejere og aktionærer, der har indsendt 13D/G- eller 13F-formularer til Securities Exchange Commission (SEC). Disse institutioner har i alt 20,087,965 aktier. Største aktionærer omfatter Robeco Institutional Asset Management B.V., Renaissance Technologies Llc, Arrowstreet Capital, Limited Partnership, Delaware Management Holdings, Inc., BlackRock, Inc., State Street Corp, Crossmark Global Holdings, Inc., American Century Companies Inc, Vanguard Group Inc, and UBS Group AG .
TIM S.A. - Depositary Receipt (Common Stock) (DB:TCZ) institutionel ejerskabsstruktur viser aktuelle positioner i virksomheden efter institutioner og fonde, samt seneste ændringer i positionsstørrelse. Større aktionærer kan omfatte individuelle investorer, investeringsforeninger, hedgefonde eller institutioner. Skema 13D angiver, at investoren besidder (eller besidder) mere end 5 % af virksomheden og har til hensigt (eller har til hensigt at) aktivt at forfølge en ændring i forretningsstrategi. Skema 13G indikerer en passiv investering på over 5%.
The share price as of February 23, 2026 is 22,00 / share. Previously, on April 22, 2025, the share price was 10,30 / share. This represents an increase of 113,59% over that period.
Fondens stemningsscore
Fund Sentiment Score (fka Ownership Accumulation Score) finder de aktier, der bliver mest købt af fonde. Det er resultatet af en sofistikeret, multi-faktor kvantitativ model, der identificerer virksomheder med de højeste niveauer af institutionel akkumulering. Scoringsmodellen bruger en kombination af den samlede stigning i oplyste ejere, ændringerne i porteføljeallokeringer i disse ejere og andre målinger. Tallet går fra 0 til 100, hvor højere tal indikerer et højere niveau af akkumulering for sine jævnaldrende, og 50 er gennemsnittet.
Opdateringsfrekvens: Dagligt
Se Ownership Explorer, som giver en liste over højest rangerende virksomheder.
AI+ Ask Fintel’s AI assistant about TIM S.A. - Depositary Receipt (Common Stock).
Select a question to share a public post with an AI-crafted answer.
Thinking of good questions…
13F og NPORT arkivering
Detaljer om 13F-arkivering er gratis. Detaljer om NP-ansøgninger kræver et premium-medlemskab. Grønne rækker angiver nye positioner. Røde rækker angiver lukkede positioner. Klik på linket ikon for at se den fulde transaktionshistorik.
Opgrader
for at låse premium-data op og eksportere til Excel ![]() .
.
| Fil dato | Kilde | Investor | Type | Gennemsnitlig pris (Øst) |
Aktier | Δ Aktier (%) |
Rapporteret Værdi ($1000) |
Δ Værdi (%) |
Port Alloc (%) |
|
|---|---|---|---|---|---|---|---|---|---|---|
| 2026-02-13 | 13F | Atlas Capital Advisors Llc | 2.854 | 39,49 | 56 | 34,15 | ||||
| 2025-08-27 | NP | RMEAX - Aspiriant Risk-Managed Equity Allocation Fund Advisor Shares | 5.938 | 0,00 | 119 | 29,35 | ||||
| 2026-02-18 | 13F | Vident Advisory, LLC | 65.622 | 3,38 | 1.276 | -9,89 | ||||
| 2026-02-11 | 13F | O'shaughnessy Asset Management, Llc | 422.641 | 2,39 | 8.220 | -10,78 | ||||
| 2026-02-05 | 13F | Abacus Wealth Partners, LLC | 73.228 | 1.424 | ||||||
| 2026-02-17 | 13F | Bank Of America Corp /de/ | 83.826 | -41,34 | 1.630 | -48,89 | ||||
| 2025-11-12 | 13F | Victory Capital Management Inc | 0 | -100,00 | 0 | -100,00 | ||||
| 2026-02-17 | 13F | Fmr Llc | 3.885 | 8,25 | 76 | -6,25 | ||||
| 2026-02-13 | 13F | Pathstone Holdings, LLC | 0 | -100,00 | 0 | |||||
| 2026-02-09 | 13F | Beck Bode, LLC | 16.104 | -17,47 | 313 | -28,05 | ||||
| 2026-02-13 | 13F | Arrowstreet Capital, Limited Partnership | 1.598.696 | -19,35 | 31.095 | -29,72 | ||||
| 2026-02-17 | 13F | Millennium Management Llc | 105.334 | 460,62 | 2.049 | 388,78 | ||||
| 2026-02-13 | 13F | Mariner, LLC | 31.725 | 4,52 | 617 | -8,86 | ||||
| 2026-02-17 | 13F | XTX Topco Ltd | 31.607 | 4,52 | 615 | -8,90 | ||||
| 2026-02-13 | 13F | Barclays Plc | 41.149 | 81,69 | 800 | 58,42 | ||||
| 2026-02-17 | 13F | Aqr Capital Management Llc | 23.330 | -12,98 | 454 | -24,25 | ||||
| 2026-02-03 | 13F | Crossmark Global Holdings, Inc. | 634.644 | -1,54 | 12.344 | -14,21 | ||||
| 2026-02-17 | 13F | Tower Research Capital LLC (TRC) | 529 | -58,21 | 10 | -64,29 | ||||
| 2025-11-10 | 13F | MAI Capital Management | 0 | -100,00 | 0 | |||||
| 2026-02-06 | 13F | Pnc Financial Services Group, Inc. | 5.526 | -0,83 | 107 | -13,71 | ||||
| 2025-09-25 | NP | DFAE - Dimensional Emerging Core Equity Market ETF | 26.200 | 16,65 | 482 | 28,61 | ||||
| 2026-01-15 | 13F | Nisa Investment Advisors, Llc | 0 | 0 | ||||||
| 2025-11-07 | 13F | HighTower Advisors, LLC | 0 | -100,00 | 0 | -100,00 | ||||
| 2026-02-13 | 13F | SRS Capital Advisors, Inc. | 51 | 1 | ||||||
| 2026-02-05 | 13F | Td Private Client Wealth Llc | 631 | -49,40 | 12 | -55,56 | ||||
| 2026-02-06 | 13F | Vestmark Advisory Solutions, Inc. | 21.634 | 421 | ||||||
| 2025-08-29 | NP | GAUAX - The Gabelli Utilities Fund Class A | 34.000 | 0,00 | 684 | 28,38 | ||||
| 2026-02-10 | 13F | Connor, Clark & Lunn Investment Management Ltd. | 190.841 | -49,06 | 3.712 | -55,62 | ||||
| 2026-02-12 | 13F | Principal Securities, Inc. | 0 | -100,00 | 0 | |||||
| 2025-08-29 | NP | GATAX - The Gabelli Asset Fund Class A | 18.700 | 0,00 | 376 | 28,77 | ||||
| 2026-01-26 | 13F | Private Trust Co Na | 0 | -100,00 | 0 | |||||
| 2026-02-04 | 13F | Altman Advisors, Inc. | 121.583 | 0,23 | 2.365 | -12,67 | ||||
| 2026-02-05 | 13F | Leuthold Group, Llc | 20.924 | 0,10 | 407 | -12,88 | ||||
| 2026-01-14 | 13F | TrueMark Investments, LLC | 11.403 | 222 | ||||||
| 2026-02-04 | 13F | D'Orazio & Associates, Inc. | 0 | -100,00 | 0 | |||||
| 2026-02-17 | 13F | Capital Insight Partners, Llc | 66.596 | 33,19 | 1.326 | 18,73 | ||||
| 2025-09-25 | NP | EMRSX - JPMorgan Emerging Markets Research Enhanced Equity Fund Class R6 | 108.181 | -19,96 | 1.988 | -11,80 | ||||
| 2026-02-13 | 13F | Banco Santander, S.A. | 53.821 | 0,00 | 1.047 | -12,91 | ||||
| 2025-11-14 | 13F | Raymond James Financial Inc | 0 | -100,00 | 0 | |||||
| 2026-02-10 | 13F | Envestnet Asset Management Inc | 35.456 | -11,84 | 690 | -23,19 | ||||
| 2025-09-25 | NP | DEXC - Dimensional Emerging Markets ex China Core Equity ETF | 3.820 | 38,41 | 70 | 52,17 | ||||
| 2026-02-12 | 13F | Barometer Capital Management Inc. | 0 | -100,00 | 0 | |||||
| 2026-01-29 | 13F | Sanctuary Advisors, LLC | 42.999 | 836 | ||||||
| 2026-02-12 | 13F | Steward Partners Investment Advisory, Llc | 79 | 203,85 | 2 | |||||
| 2026-02-17 | 13F | CWM Advisors, LLC | 3.805 | 74 | ||||||
| 2026-02-10 | 13F | Goldman Sachs Group Inc | 22.565 | -64,54 | 439 | -69,15 | ||||
| 2026-01-23 | 13F | Assetmark, Inc | 412.099 | 7,31 | 8.015 | -6,49 | ||||
| 2026-02-11 | 13F | Vise Technologies, Inc. | 26.707 | 0,43 | 519 | -12,48 | ||||
| 2026-02-13 | 13F | Sei Investments Co | 0 | -100,00 | 0 | |||||
| 2026-01-28 | 13F | CAPROCK Group, Inc. | 41.600 | 3,13 | 845 | -2,43 | ||||
| 2025-11-07 | 13F | Sierra Ocean, Llc | 0 | -100,00 | 0 | |||||
| 2026-01-29 | 13F | Aprio Wealth Management, LLC | 27.877 | -0,55 | 542 | -13,28 | ||||
| 2026-02-13 | 13F | Umb Bank N A/mo | 189 | 0,00 | 4 | -25,00 | ||||
| 2025-08-28 | NP | SPEM - SPDR(R) Portfolio Emerging Markets ETF | 503.177 | 9,90 | 10.119 | 41,21 | ||||
| 2026-01-20 | 13F | Signaturefd, Llc | 5.137 | -2,10 | 100 | -15,38 | ||||
| 2026-01-16 | 13F | Ronald Blue Trust, Inc. | 6.646 | -7,71 | 129 | -19,37 | ||||
| 2026-02-17 | 13F | Russell Investments Group, Ltd. | 12.744 | -20,49 | 248 | -30,81 | ||||
| 2026-02-17 | 13F | Citadel Advisors Llc | 98.149 | -73,54 | 1.909 | -76,96 | ||||
| 2025-11-14 | 13F | Eqis Capital Management, Inc. | 0 | -100,00 | 0 | -100,00 | ||||
| 2026-02-17 | 13F | Engineers Gate Manager LP | 27.568 | 536 | ||||||
| 2026-02-13 | 13F | Caitong International Asset Management Co., Ltd | 3.915 | 22.929,41 | 76 | |||||
| 2026-02-11 | 13F | LPL Financial LLC | 0 | -100,00 | 0 | |||||
| 2026-02-13 | 13F | Kestra Advisory Services, LLC | 1.994 | 39 | ||||||
| 2026-01-26 | 13F | Cwm, Llc | 6.594 | 37,09 | 0 | |||||
| 2026-02-13 | 13F | State Street Corp | 657.839 | 5,34 | 13.464 | -5,49 | ||||
| 2026-02-24 | 13F | DGS Capital Management, LLC | 40.166 | 5,24 | 781 | -8,23 | ||||
| 2026-01-13 | 13F | Kathmere Capital Management, LLC | 15.767 | 6,82 | 307 | -6,99 | ||||
| 2026-02-17 | 13F | Guggenheim Capital Llc | 11.641 | 28,50 | 226 | 11,88 | ||||
| 2026-02-13 | 13F | JustInvest LLC | 21.153 | 1,55 | 411 | -11,99 | ||||
| 2026-02-13 | 13F | Boston Partners | 40.003 | 778 | ||||||
| 2026-01-12 | 13F | Byrne Asset Management LLC | 625 | 0,00 | 12 | -7,69 | ||||
| 2026-01-15 | 13F | Archford Capital Strategies, LLC | 34.766 | 676 | ||||||
| 2026-02-12 | 13F | BlackRock, Inc. | 1.134.052 | 2,03 | 22.057 | -11,09 | ||||
| 2026-02-17 | 13F | Delaware Management Holdings, Inc. | 1.349.040 | 26.239 | ||||||
| 2026-02-06 | 13F | EverSource Wealth Advisors, LLC | 2.619 | 23,83 | 51 | 6,38 | ||||
| 2025-09-25 | NP | DFAX - Dimensional World ex U.S. Core Equity 2 ETF | 691 | 0,00 | 13 | 9,09 | ||||
| 2026-02-11 | 13F | Parallel Advisors, LLC | 6.384 | -0,92 | 124 | -13,29 | ||||
| 2026-02-10 | 13F | Acadian Asset Management Llc | 160.172 | -11,07 | 3 | -25,00 | ||||
| 2026-02-11 | 13F | Cerity Partners LLC | 42.164 | 9,80 | 820 | -4,32 | ||||
| 2026-02-17 | 13F | Goldentree Asset Management Lp | 65.010 | -21,52 | 1.264 | -31,60 | ||||
| 2025-09-25 | NP | DFEM - Dimensional Emerging Markets Core Equity 2 ETF | 7.974 | 39,07 | 147 | 53,68 | ||||
| 2026-02-17 | 13F | Lazard Asset Management Llc | 36.435 | 0,55 | 709 | -12,38 | ||||
| 2026-02-17 | 13F | Optiver Holding B.V. | 0 | -100,00 | 0 | |||||
| 2026-02-03 | 13F | Ballentine Partners, LLC | 18.717 | -0,55 | 364 | -13,33 | ||||
| 2026-01-14 | 13F | Hennion & Walsh Asset Management, Inc. | 0 | -100,00 | 0 | -100,00 | ||||
| 2026-02-17 | 13F | Two Sigma Advisers, Lp | 56.900 | 0,00 | 1.107 | -12,91 | ||||
| 2026-02-23 | 13F | Vinland Capital Management Gestora de Recursos LTDA. | 0 | -100,00 | 0 | -100,00 | ||||
| 2026-01-14 | 13F | Jfs Wealth Advisors, Llc | 76 | 0,00 | 1 | 0,00 | ||||
| 2025-11-14 | 13F | Sofos Investments, Inc. | 0 | -100,00 | 0 | |||||
| 2026-02-13 | 13F | Morgan Stanley | 479.083 | 166,85 | 9.318 | 132,54 | ||||
| 2026-01-29 | 13F | Nbc Securities, Inc. | 63 | 0,00 | 1 | 0,00 | ||||
| 2026-02-11 | 13F | Jpmorgan Chase & Co | 439.100 | -2,14 | 8.540 | -14,73 | ||||
| 2026-02-12 | 13F | Skopos Labs, Inc. | 16.677 | 35,72 | 323 | 17,52 | ||||
| 2026-02-10 | 13F | Natixis Advisors, L.p. | 0 | -100,00 | 0 | |||||
| 2025-09-25 | NP | DFSE - Dimensional Emerging Markets Sustainability Core 1 ETF | 1.740 | 0,00 | 32 | 6,90 | ||||
| 2026-01-22 | 13F | Financial Consulate, Inc | 25 | 0 | ||||||
| 2026-02-03 | 13F | Navigoe, LLC | 108 | 0,00 | 0 | |||||
| 2025-08-29 | NP | MPLAX - Praxis International Index Fund Class A | 72.269 | 22,90 | 1.453 | 57,93 | ||||
| 2026-01-23 | 13F | Sumitomo Mitsui Trust Holdings, Inc. | 81.702 | -2,97 | 1.589 | -15,43 | ||||
| 2026-01-21 | 13F | Stone House Investment Management, LLC | 13 | 0 | ||||||
| 2026-02-17 | 13F | Grantham, Mayo, Van Otterloo & Co. LLC | 90.415 | 0,00 | 1.759 | -12,88 | ||||
| 2026-02-13 | 13F | Schroder Investment Management Group | 387.555 | -13,73 | 7.561 | -23,32 | ||||
| 2026-02-17 | 13F | SageView Advisory Group, LLC | 182 | 4 | ||||||
| 2026-01-29 | 13F | Vanguard Group Inc | 544.728 | 0,22 | 10.595 | -12,67 | ||||
| 2025-08-28 | NP | QEMM - SPDR MSCI Emerging Markets StrategicFactors ETF | 402 | -3,83 | 8 | 33,33 | ||||
| 2026-02-14 | 13F | Rockefeller Capital Management L.P. | 0 | -100,00 | 0 | |||||
| 2026-02-17 | 13F | Virtus Investment Advisers, Inc. | 8.106 | 1,55 | 158 | -11,80 | ||||
| 2026-02-17 | 13F | Jones Financial Companies Lllp | 2 | -95,35 | 0 | |||||
| 2026-01-23 | 13F | Robeco Institutional Asset Management B.V. | 3.468.978 | -0,04 | 67.472 | -12,89 | ||||
| 2026-02-13 | 13F | Smartleaf Asset Management LLC | 715 | 119,33 | 14 | 85,71 | ||||
| 2026-02-06 | 13F | Global Retirement Partners, LLC | 145 | -87,87 | 3 | -92,31 | ||||
| 2025-09-24 | NP | SGIDX - Steward Global Equity Income Fund Class A | 339.217 | 0,85 | 6.235 | 11,12 | ||||
| 2026-01-27 | 13F | WealthCollab, LLC | 645 | 0,00 | 13 | -14,29 | ||||
| 2026-02-13 | 13F | Transamerica Financial Advisors, Inc. | 3 | 0 | ||||||
| 2026-02-12 | 13F | Renaissance Technologies Llc | 1.848.386 | 4,68 | 35.951 | -8,78 | ||||
| 2026-02-17 | 13F | Point72 Asset Management, L.P. | 335.835 | 133,71 | 6.532 | 103,65 | ||||
| 2026-02-10 | 13F/A | Northwestern Mutual Wealth Management Co | 62.279 | 129,92 | 1.211 | 100,50 | ||||
| 2026-01-08 | 13F | True Wealth Design, LLC | 13 | -58,06 | 0 | |||||
| 2026-02-03 | 13F/A | Mount Yale Investment Advisors, LLC | 0 | -100,00 | 0 | -100,00 | ||||
| 2026-02-03 | 13F | SBI Securities Co., Ltd. | 582 | -18,37 | 11 | -26,67 | ||||
| 2026-02-13 | 13F | Centiva Capital, LP | 10.567 | -19,37 | 206 | -29,79 | ||||
| 2026-02-10 | 13F | Eurizon Capital SGR S.p.A. | 17 | 0 | ||||||
| 2025-11-14 | 13F | Hrt Financial Lp | 0 | -100,00 | 0 | |||||
| 2026-02-12 | 13F | Dimensional Fund Advisors Lp | 91.943 | 30,29 | 1.788 | 13,52 | ||||
| 2026-02-13 | 13F | Rhumbline Advisers | 4.212 | -57,97 | 82 | -63,68 | ||||
| 2026-02-11 | 13F | Simplex Trading, Llc | 0 | -100,00 | 0 | |||||
| 2026-01-23 | 13F | Altfest L J & Co Inc | 0 | -100,00 | 0 | |||||
| 2026-02-17 | 13F | Northern Trust Corp | 29.278 | 16,83 | 569 | 1,79 | ||||
| 2025-11-12 | 13F | Itau Unibanco Holding S.A. | 0 | -100,00 | 0 | |||||
| 2026-02-13 | 13F | Wells Fargo & Company/mn | 1.413 | 53,75 | 27 | 35,00 | ||||
| 2026-02-12 | 13F/A | Pinebridge Investments Llc | 66.932 | 1.302 | ||||||
| 2025-11-14 | 13F | PineBridge Investments, L.P. | 90.969 | -28,05 | 2.030 | -20,14 | ||||
| 2026-02-10 | 13F | Bnp Paribas Arbitrage, Sa | 3.794 | -88,70 | 74 | -90,25 | ||||
| 2026-02-13 | 13F | OMERS ADMINISTRATION Corp | 22.321 | -56,59 | 434 | -62,16 | ||||
| 2026-01-29 | 13F | UMA Financial Services, Inc. | 117 | 0,00 | 2 | 0,00 | ||||
| 2026-02-13 | 13F | Marshall Wace, Llp | 52.129 | 1.014 | ||||||
| 2026-02-13 | 13F | American Century Companies Inc | 559.850 | 12,12 | 10.889 | -2,30 | ||||
| 2026-02-09 | 13F | Legal & General Group Plc | 200.968 | 0,00 | 3.913 | -12,75 | ||||
| 2026-02-13 | 13F | Parkside Financial Bank & Trust | 177 | 261,22 | 3 | 200,00 | ||||
| 2026-02-17 | 13F | Quantinno Capital Management LP | 79.490 | 12,60 | 1.546 | -1,84 | ||||
| 2026-02-05 | 13F | Gabelli Funds Llc | 102.575 | 0,00 | 1.995 | -12,84 | ||||
| 2026-01-30 | 13F | Us Bancorp \de\ | 38.760 | -2,79 | 754 | -15,30 | ||||
| 2026-01-27 | 13F | Meritage Portfolio Management | 186.730 | 0,92 | 3.632 | -12,06 | ||||
| 2026-02-13 | 13F | Ubs Asset Management Americas Inc | 171 | 3 | ||||||
| 2026-01-27 | 13F | TD Waterhouse Canada Inc. | 30.825 | 0,25 | 600 | -11,52 | ||||
| 2026-02-17 | 13F | Royal Bank Of Canada | 62.235 | -6,65 | 1.210 | -18,68 | ||||
| 2026-02-12 | 13F | Quadrant Capital Group Llc | 4.111 | 0,00 | 80 | -13,04 | ||||
| 2025-11-14 | 13F | Wetherby Asset Management Inc | 21.917 | 6,20 | 489 | 17,83 | ||||
| 2026-02-13 | 13F | Y-Intercept (Hong Kong) Ltd | 45.632 | 888 | ||||||
| 2025-10-28 | 13F | Campbell & CO Investment Adviser LLC | 0 | -100,00 | 0 | |||||
| 2026-02-12 | 13F | Qtron Investments LLC | 0 | -100,00 | 0 | |||||
| 2025-11-14 | 13F | Cubist Systematic Strategies, LLC | 30.934 | 690 | ||||||
| 2025-08-29 | NP | Gabelli Multimedia Trust Inc. | 3.800 | 0,00 | 76 | 28,81 | ||||
| 2025-11-12 | 13F | Fox Run Management, L.l.c. | 0 | -100,00 | 0 | |||||
| 2026-02-19 | 13F | Invesco Ltd. | 64.400 | 1.253 | ||||||
| 2026-02-02 | 13F | Qrg Capital Management, Inc. | 14.454 | 281 | ||||||
| 2026-02-11 | 13F | Allianz Asset Management GmbH | 119.739 | 11,67 | 2.329 | -2,72 | ||||
| 2026-02-13 | 13F | Pinnacle Wealth Planning Services, Inc. | 142 | 3 | ||||||
| 2025-09-23 | NP | VVIFX - Voya VACS Series EME Fund | 20.750 | -44,96 | 381 | -39,33 | ||||
| 2025-11-13 | 13F | Hsbc Holdings Plc | 91.885 | 13,83 | 2.051 | 26,31 | ||||
| 2026-01-23 | 13F | Ritholtz Wealth Management | 147.952 | -1,88 | 2.878 | -14,50 | ||||
| 2025-11-14 | 13F | Daiwa Securities Group Inc. | 0 | -100,00 | 0 | |||||
| 2026-02-03 | 13F | Ethic Inc. | 29.357 | 28,06 | 571 | 11,74 | ||||
| 2026-02-13 | 13F | VPR Management LLC | 15.760 | 0,00 | 307 | -12,82 | ||||
| 2026-02-03 | 13F | Sequoia Financial Advisors, LLC | 22.684 | 4,10 | 441 | -9,26 | ||||
| 2026-02-17 | 13F | Creative Planning | 93.312 | 107,76 | 1.815 | 81,04 | ||||
| 2026-02-11 | 13F | Brandes Investment Partners, Lp | 149.702 | -1,85 | 2.912 | -14,48 | ||||
| 2026-02-13 | 13F | Macquarie Group Ltd | 0 | -100,00 | 0 | |||||
| 2026-02-05 | 13F | Allworth Financial LP | 223 | 1,36 | 4 | 0,00 | ||||
| 2026-02-09 | 13F | Hantz Financial Services, Inc. | 10.407 | 70,13 | 0 | |||||
| 2026-02-10 | 13F | Savant Capital, LLC | 0 | -100,00 | 0 | |||||
| 2026-02-17 | 13F | Public Employees Retirement System Of Ohio | 45.340 | -57,73 | 882 | -63,20 | ||||
| 2026-02-13 | 13F | Ieq Capital, Llc | 0 | -100,00 | 0 | |||||
| 2026-02-12 | 13F | Jane Street Group, Llc | 27.650 | 538 | ||||||
| 2026-02-13 | 13F | Stifel Financial Corp | 86.718 | 4,25 | 1.687 | -9,16 | ||||
| 2026-02-17 | 13F | Advisory Services Network, LLC | 0 | -100,00 | 0 | |||||
| 2026-02-17 | 13F | Ameriprise Financial Inc | 0 | -100,00 | 0 | |||||
| 2025-08-29 | NP | Gabelli Equity Trust Inc | 46.075 | 0,00 | 927 | 28,43 | ||||
| 2025-09-26 | 13F | Capital A Wealth Management, LLC | 0 | -100,00 | 0 | |||||
| 2026-01-05 | 13F | GAMMA Investing LLC | 3.562 | -0,20 | 69 | -12,66 | ||||
| 2025-09-25 | NP | DEHP - Dimensional Emerging Markets High Profitability ETF | 8.108 | 9,27 | 149 | 21,14 | ||||
| 2026-02-17 | 13F | GAM Holding AG | 50.000 | 972 | ||||||
| 2026-02-17 | 13F | PharVision Advisers, LLC | 10.683 | 208 | ||||||
| 2026-01-23 | 13F | Farther Finance Advisors, LLC | 5.023 | 24,52 | 98 | 7,78 | ||||
| 2026-02-17 | 13F | Aquatic Capital Management LLC | 0 | -100,00 | 0 | |||||
| 2026-02-13 | 13F/A | Virtus ETF Advisers LLC | 0 | -100,00 | 0 | |||||
| 2026-01-26 | 13F | Mirae Asset Global Investments Co., Ltd. | 38.702 | 102,10 | 753 | 76,11 | ||||
| 2026-01-29 | 13F | UBS Group AG | 537.416 | 12,36 | 10.453 | -2,09 | ||||
| 2026-02-02 | 13F | Fifth Third Bancorp | 161 | -8,00 | 3 | 0,00 | ||||
| 2025-09-29 | NP | VRAI - Virtus Real Asset Income ETF | 8.852 | -14,15 | 163 | -5,26 | ||||
| 2026-02-06 | 13F | Larson Financial Group LLC | 24 | 0,00 | 0 | |||||
| 2026-02-17 | 13F | Advisor Group Holdings, Inc. | 2.186 | -86,54 | 43 | -88,37 | ||||
| 2026-02-18 | 13F | GWM Advisors LLC | 0 | -100,00 | 0 | |||||
| 2026-02-11 | 13F | IMA Wealth, Inc. | 70 | 1 | ||||||
| 2025-09-26 | NP | UBPIX - Ultralatin America Profund Investor Class | 3.618 | 14,06 | 66 | 26,92 | ||||
| 2026-02-13 | 13F | Citigroup Inc | 0 | -100,00 | 0 | |||||
| 2026-02-17 | 13F | Qube Research & Technologies Ltd | 181.393 | 3.528 | ||||||
| 2025-11-14 | 13F | DZ BANK AG Deutsche Zentral Genossenschafts Bank, Frankfurt am Main | 0 | -100,00 | 0 | |||||
| 2025-11-12 | 13F | NewSquare Capital LLC | 0 | -100,00 | 0 | |||||
| 2026-02-17 | 13F | Laird Norton Trust Company, Llc | 27.844 | 565 |
Other Listings
| US:TIMB | 27,39 $ |