Grundlæggende statistik
| Institutionelle aktier (lange) | 104.228.136 - 70,58% (ex 13D/G) - change of -21,22MM shares -16,92% MRQ |
| Institutionel værdi (lang) | $ 3.056.111 USD ($1000) |
Institutionelt ejerskab og aktionærer
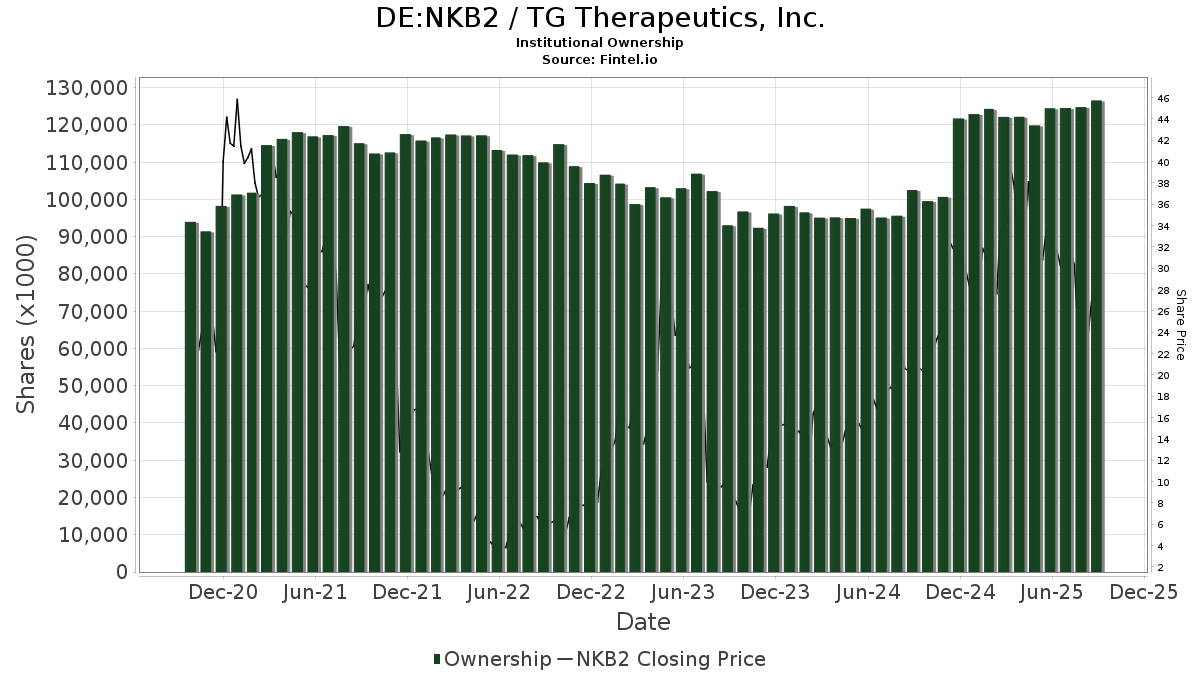
TG Therapeutics, Inc. (DE:NKB2) har 362 institutionelle ejere og aktionærer, der har indsendt 13D/G- eller 13F-formularer til Securities Exchange Commission (SEC). Disse institutioner har i alt 104,228,136 aktier. Største aktionærer omfatter BlackRock, Inc., Vanguard Group Inc, State Street Corp, Clearbridge Investments, LLC, Geode Capital Management, Llc, Soleus Capital Management, L.P., Congress Asset Management Co /ma, Goldman Sachs Group Inc, Pictet Asset Management Holding SA, and Invesco Ltd. .
TG Therapeutics, Inc. (DB:NKB2) institutionel ejerskabsstruktur viser aktuelle positioner i virksomheden efter institutioner og fonde, samt seneste ændringer i positionsstørrelse. Større aktionærer kan omfatte individuelle investorer, investeringsforeninger, hedgefonde eller institutioner. Skema 13D angiver, at investoren besidder (eller besidder) mere end 5 % af virksomheden og har til hensigt (eller har til hensigt at) aktivt at forfølge en ændring i forretningsstrategi. Skema 13G indikerer en passiv investering på over 5%.
The share price as of April 27, 2026 is 30,90 / share. Previously, on April 28, 2025, the share price was 35,92 / share. This represents a decline of 13,99% over that period.
Fondens stemningsscore
Fund Sentiment Score (fka Ownership Accumulation Score) finder de aktier, der bliver mest købt af fonde. Det er resultatet af en sofistikeret, multi-faktor kvantitativ model, der identificerer virksomheder med de højeste niveauer af institutionel akkumulering. Scoringsmodellen bruger en kombination af den samlede stigning i oplyste ejere, ændringerne i porteføljeallokeringer i disse ejere og andre målinger. Tallet går fra 0 til 100, hvor højere tal indikerer et højere niveau af akkumulering for sine jævnaldrende, og 50 er gennemsnittet.
Opdateringsfrekvens: Dagligt
Se Ownership Explorer, som giver en liste over højest rangerende virksomheder.
AI+ Ask Fintel’s AI assistant about TG Therapeutics, Inc..
Select a question to share a public post with an AI-crafted answer.
Thinking of good questions…
13F og NPORT arkivering
Detaljer om 13F-arkivering er gratis. Detaljer om NP-ansøgninger kræver et premium-medlemskab. Grønne rækker angiver nye positioner. Røde rækker angiver lukkede positioner. Klik på linket ikon for at se den fulde transaktionshistorik.
Opgrader
for at låse premium-data op og eksportere til Excel ![]() .
.
| Fil dato | Kilde | Investor | Type | Gennemsnitlig pris (Øst) |
Aktier | Δ Aktier (%) |
Rapporteret Værdi ($1000) |
Δ Værdi (%) |
Port Alloc (%) |
|
|---|---|---|---|---|---|---|---|---|---|---|
| 2026-04-20 | 13F | State of Alaska, Department of Revenue | 86.343 | -2,11 | 3 | 0,00 | ||||
| 2026-01-30 | 13F | State of New Jersey Common Pension Fund D | 51.448 | -30,41 | 1.534 | -42,58 | ||||
| 2025-12-09 | 13F/A | Tudor Investment Corp Et Al | Put | 0 | -100,00 | 0 | -100,00 | |||
| 2026-01-23 | 13F | Burney Co/ | 15.991 | 0,00 | 477 | -17,50 | ||||
| 2026-01-30 | 13F | Precision Wealth Strategies, LLC | 0 | -100,00 | 0 | |||||
| 2026-02-05 | 13F | Cambridge Investment Research Advisors, Inc. | 13.120 | 43,65 | 0 | |||||
| 2026-02-06 | 13F | Larson Financial Group LLC | 7.164 | 1,73 | 214 | -16,14 | ||||
| 2026-04-13 | 13F/A | Opaleye Management Inc. | 535.000 | 0,00 | 15.948 | -17,48 | ||||
| 2026-02-18 | 13F | Vident Advisory, LLC | 9.517 | -17,98 | 284 | -32,46 | ||||
| 2026-04-20 | 13F | Jfs Wealth Advisors, Llc | 0 | -100,00 | 0 | |||||
| 2026-02-17 | 13F | Aquatic Capital Management LLC | 43.240 | -42,72 | 1.289 | -52,77 | ||||
| 2026-02-17 | 13F | Algert Global Llc | 485.192 | 489,03 | 14 | 600,00 | ||||
| 2026-02-06 | 13F | Bare Financial Services, Inc | 176 | -13,30 | 5 | -28,57 | ||||
| 2026-04-20 | 13F | Louisiana State Employees Retirement System | 60.300 | -3,21 | 2.003 | 7,86 | ||||
| 2025-11-14 | 13F | Lazard Asset Management Llc | 0 | -100,00 | 0 | |||||
| 2026-02-17 | 13F | Balyasny Asset Management Llc | Call | 45.100 | -31,77 | 1.344 | -43,70 | |||
| 2026-02-13 | 13F | First Trust Advisors Lp | 88.492 | -38,42 | 2.638 | -49,20 | ||||
| 2026-04-06 | 13F | Trust Co of the South | 7.600 | -28,30 | 252 | -20,00 | ||||
| 2026-02-09 | 13F | Geode Capital Management, Llc | 3.403.866 | -1,16 | 101.483 | -18,84 | ||||
| 2026-02-13 | 13F | Blueshift Asset Management, LLC | 10.778 | 321 | ||||||
| 2026-02-13 | 13F/A | Virtus ETF Advisers LLC | 0 | -100,00 | 0 | -100,00 | ||||
| 2025-11-14 | 13F | Point72 Europe (London) LLP | 100.050 | 16,52 | 3.614 | 16,96 | ||||
| 2026-01-15 | 13F | Nisa Investment Advisors, Llc | 7.315 | -1,88 | 218 | -18,96 | ||||
| 2026-01-16 | 13F | FNY Investment Advisers, LLC | 0 | -100,00 | 0 | |||||
| 2025-11-13 | 13F | UBS Group AG | Call | 0 | -100,00 | 0 | -100,00 | |||
| 2026-02-13 | 13F | Inspire Advisors, LLC | 0 | -100,00 | 0 | -100,00 | ||||
| 2026-02-26 | 13F | Anchor Investment Management, LLC | 4.700 | 0,00 | 140 | -17,16 | ||||
| 2026-02-17 | 13F | Adams Wealth Management | 7.107 | 0,00 | 214 | -17,12 | ||||
| 2026-02-13 | 13F | Occam Crest Management LP | 401.595 | -1,95 | 11.972 | -19,09 | ||||
| 2026-02-17 | 13F | Ancora Advisors, LLC | 301 | 0,00 | 9 | -20,00 | ||||
| 2026-04-10 | 13F | Abound Wealth Management | 3.506 | 0,00 | 116 | 11,54 | ||||
| 2026-02-13 | 13F | Mml Investors Services, Llc | 11.146 | 332 | ||||||
| 2026-02-17 | 13F | J. Goldman & Co LP | 44.191 | -1,83 | 1.317 | -19,00 | ||||
| 2026-02-17 | 13F | Balyasny Asset Management Llc | 0 | -100,00 | 0 | -100,00 | ||||
| 2026-01-15 | 13F/A | Ubs Oconnor Llc | 0 | -100,00 | 0 | -100,00 | ||||
| 2026-02-09 | 13F | Jefferies Financial Group Inc. | 16.000 | 477 | ||||||
| 2026-02-17 | 13F | Balyasny Asset Management Llc | Put | 0 | -100,00 | 0 | -100,00 | |||
| 2026-02-17 | 13F | Oxford Asset Management Llp | 9.631 | 287 | ||||||
| 2025-11-13 | 13F | Twin Tree Management, LP | 0 | -100,00 | 0 | -100,00 | ||||
| 2026-02-10 | 13F | Rothschild Investment Llc | 289 | 9,06 | 9 | -11,11 | ||||
| 2026-02-12 | 13F | Elo Mutual Pension Insurance Co | 46.976 | 1.400 | ||||||
| 2025-11-13 | 13F | Twin Tree Management, LP | Put | 0 | -100,00 | 0 | -100,00 | |||
| 2025-11-10 | 13F | Thoroughbred Financial Services, Llc | 0 | -100,00 | 0 | |||||
| 2026-01-23 | 13F | Assetmark, Inc | 113 | 10,78 | 3 | 0,00 | ||||
| 2026-01-16 | 13F | Crewe Advisors LLC | 41 | 1 | ||||||
| 2026-04-02 | 13F | Noble Wealth Management PBC | 825 | 0,00 | 27 | 12,50 | ||||
| 2026-02-17 | 13F | Orbimed Advisors Llc | Call | 0 | -100,00 | 0 | ||||
| 2026-04-06 | 13F | Versant Capital Management, Inc | 1.041 | 42,02 | 35 | 61,90 | ||||
| 2026-02-12 | 13F | Commonwealth Equity Services, Llc | 182.001 | -2,52 | 5.425 | 90.316,67 | ||||
| 2026-02-17 | 13F | Tower Research Capital LLC (TRC) | 6.605 | 27,09 | 197 | 4,81 | ||||
| 2025-11-17 | 13F | Harvest Investment Services, LLC | 0 | -100,00 | 0 | |||||
| 2026-04-13 | 13F | IFP Advisors, Inc | 206.538 | 4,70 | 6.861 | 16,68 | ||||
| 2026-02-10 | 13F | Goldman Sachs Group Inc | 2.051.132 | 35,00 | 61.144 | 11,40 | ||||
| 2026-01-29 | 13F | Vanguard Group Inc | 15.841.002 | 2,06 | 472.220 | -15,78 | ||||
| 2025-11-06 | 13F | Westover Capital Advisors, LLC | 0 | -100,00 | 0 | -100,00 | ||||
| 2026-02-10 | 13F | Intech Investment Management Llc | 153.132 | 116,05 | 4.565 | 78,28 | ||||
| 2026-02-17 | 13F | Aqr Capital Management Llc | 136.008 | 100,57 | 4.054 | 65,54 | ||||
| 2026-02-17 | 13F | Bank Of America Corp /de/ | 851.107 | 35,82 | 25.371 | 12,08 | ||||
| 2026-02-12 | 13F | Cibc World Markets Corp | 9.609 | -46,31 | 286 | -55,59 | ||||
| 2026-02-13 | 13F | Schroder Investment Management Group | 0 | -100,00 | 0 | -100,00 | ||||
| 2026-02-11 | 13F | Clearbridge Investments, LLC | 3.448.033 | -25,76 | 102.786 | -38,74 | ||||
| 2026-02-05 | 13F | HFM Investment Advisors, LLC | 1 | 0 | ||||||
| 2026-04-14 | 13F | Nbc Securities, Inc. | 521 | 0,00 | 17 | 13,33 | ||||
| 2026-02-11 | 13F | Franklin Resources Inc | 86.687 | -2,00 | 2.584 | -19,12 | ||||
| 2026-02-13 | 13F | Public Employees Retirement Association Of Colorado | 16.285 | 0,00 | 0 | |||||
| 2026-01-26 | 13F | Cwm, Llc | 1.940 | 14,66 | 0 | |||||
| 2026-01-28 | 13F | Universal- Beteiligungs- und Servicegesellschaft mbH | 50.882 | -19,62 | 1.516 | -33,68 | ||||
| 2026-02-12 | 13F | Pitcairn Co | 0 | -100,00 | 0 | -100,00 | ||||
| 2026-02-03 | 13F | Everence Capital Management Inc | 0 | -100,00 | 0 | |||||
| 2026-02-12 | 13F | Federated Hermes, Inc. | 0 | -100,00 | 0 | |||||
| 2026-02-17 | 13F | Kemnay Advisory Services Inc. | 1.735 | 52 | ||||||
| 2026-02-13 | 13F | Umb Bank N A/mo | 1.083 | 19,01 | 32 | 0,00 | ||||
| 2026-02-04 | 13F | Ameritas Advisory Services, LLC | 0 | -100,00 | 0 | |||||
| 2026-02-17 | 13F | Engineers Gate Manager LP | 95.309 | 17,32 | 2.841 | -3,17 | ||||
| 2026-04-08 | 13F | NorthCrest Asset Manangement, LLC | 14.307 | 2,26 | 480 | 14,59 | ||||
| 2026-04-22 | 13F | Sterling Capital Management LLC | 941 | -0,11 | 31 | 10,71 | ||||
| 2026-02-02 | 13F | Principal Financial Group Inc | 847.787 | 8,11 | 25.273 | -10,79 | ||||
| 2026-01-23 | 13F | Avion Wealth | 16 | 0 | ||||||
| 2026-02-10 | 13F | Bank of New York Mellon Corp | 898.409 | 2,96 | 26.782 | -15,03 | ||||
| 2026-02-17 | 13F | Tudor Investment Corp Et Al | 96.609 | 26,98 | 2.880 | 4,77 | ||||
| 2026-04-27 | 13F | HB Wealth Management, LLC | 7.514 | 6,75 | 250 | 19,14 | ||||
| 2026-02-05 | 13F | Dana Investment Advisors, Inc. | 42.077 | 18,00 | 1.254 | -2,64 | ||||
| 2026-02-12 | 13F | Voya Investment Management Llc | 404.862 | 0,03 | 12.069 | -17,46 | ||||
| 2026-02-13 | 13F | M28 Capital Management LP | 161.600 | 0,00 | 4.817 | -17,47 | ||||
| 2026-02-11 | 13F | Simplex Trading, Llc | Put | 125.000 | -19,61 | 3.726 | 74.420,00 | |||
| 2026-02-17 | 13F | Trexquant Investment LP | 512.454 | 92,36 | 15.276 | 58,74 | ||||
| 2026-02-10 | 13F | Cornerstone Select Advisors, LLC | 54.085 | -2,17 | 1.612 | -19,28 | ||||
| 2026-02-11 | 13F | Simplex Trading, Llc | 41.042 | 148,23 | 1.223 | |||||
| 2026-02-17 | 13F | Mercer Global Advisors Inc /adv | 7.217 | 212 | ||||||
| 2026-02-11 | 13F | Simplex Trading, Llc | Call | 84.500 | -13,78 | 2.519 | 83.833,33 | |||
| 2026-02-17 | 13F | Caption Management, LLC | 0 | -100,00 | 0 | -100,00 | ||||
| 2026-02-11 | 13F | Los Angeles Capital Management Llc | 17.070 | 0,00 | 581 | -5,84 | ||||
| 2025-11-12 | 13F | Fox Run Management, L.l.c. | 0 | -100,00 | 0 | -100,00 | ||||
| 2025-11-14 | 13F | Zacks Investment Management | 0 | -100,00 | 0 | -100,00 | ||||
| 2026-04-24 | 13F | Oakworth Capital, Inc. | 500 | 0,00 | 17 | 14,29 | ||||
| 2026-02-12 | 13F | Quadrant Capital Group Llc | 1.477 | -7,17 | 44 | -22,81 | ||||
| 2026-02-11 | 13F | Prestige Wealth Management Group LLC | 50 | 0,00 | 1 | 0,00 | ||||
| 2025-11-13 | 13F | Lord, Abbett & Co. Llc | 0 | -100,00 | 0 | -100,00 | ||||
| 2026-02-06 | 13F | Global Retirement Partners, LLC | 107 | -71,24 | 3 | -76,92 | ||||
| 2026-01-23 | 13F | Transcend Wealth Collective, Llc | 8.484 | 0,00 | 253 | -17,65 | ||||
| 2026-04-24 | 13F | Yousif Capital Management, Llc | 37.197 | -2,04 | 1.236 | 5,20 | ||||
| 2026-02-05 | 13F | 1620 Investment Advisors, Inc. | 3.969 | 1,02 | 118 | -16,31 | ||||
| 2026-02-13 | 13F | Bridgewater Associates, LP | 469.855 | 37,32 | 14.006 | 13,32 | ||||
| 2025-11-14 | 13F | Wolverine Trading, Llc | Call | 0 | -100,00 | 0 | -100,00 | |||
| 2026-01-30 | 13F | Torren Management, LLC | 147 | 4 | ||||||
| 2025-11-14 | 13F | Wolverine Trading, Llc | Put | 0 | -100,00 | 0 | -100,00 | |||
| 2026-02-13 | 13F | JustInvest LLC | 9.596 | -2,14 | 286 | -19,21 | ||||
| 2025-11-12 | 13F | Hohimer Wealth Management, Llc | 0 | -100,00 | 0 | -100,00 | ||||
| 2026-01-08 | 13F | Nordea Investment Management Ab | 79.696 | 2.356 | ||||||
| 2026-02-17 | 13F | Guggenheim Capital Llc | 66.051 | 70,46 | 1.969 | 40,67 | ||||
| 2026-02-20 | 13F | Sunbelt Securities, Inc. | 1 | -50,00 | 0 | |||||
| 2026-02-12 | 13F | Ankerstar Wealth, LLC | 20 | 1 | ||||||
| 2025-11-14 | 13F | Point72 (DIFC) Ltd | 2.968 | -13,57 | 107 | -13,01 | ||||
| 2026-04-24 | 13F | Profund Advisors Llc | 76.039 | 1,64 | 2.526 | 13,27 | ||||
| 2026-02-12 | 13F | Soleus Capital Management, L.P. | 3.139.312 | -18,35 | 93.583 | -32,62 | ||||
| 2026-02-12 | 13F | Ensign Peak Advisors, Inc | 8.017 | -83,12 | 239 | -86,13 | ||||
| 2026-02-10 | 13F | Impact Partnership Wealth, LLC | 0 | -100,00 | 0 | |||||
| 2026-02-17 | 13F | Captrust Financial Advisors | 6.775 | 202 | ||||||
| 2026-04-23 | 13F | North Star Investment Management Corp. | 3.900 | 0,00 | 130 | 11,21 | ||||
| 2026-02-11 | 13F | Parallel Advisors, LLC | 99 | 0,00 | 3 | -33,33 | ||||
| 2026-02-05 | 13F | Thrivent Financial For Lutherans | 93.425 | -4,56 | 3 | -33,33 | ||||
| 2026-02-13 | 13F | Great West Life Assurance Co /can/ | 119.935 | -9,34 | 4 | -25,00 | ||||
| 2026-04-22 | 13F | Stone House Investment Management, LLC | 1.000 | -0,30 | 33 | 13,79 | ||||
| 2026-02-02 | 13F | Core Alternative Capital | 180 | 0,00 | 5 | -16,67 | ||||
| 2026-01-20 | 13F | Steel Peak Wealth Management LLC | 0 | -100,00 | 0 | |||||
| 2026-02-18 | 13F | State of Tennessee, Treasury Department | 53.623 | -8,84 | 1.578 | -25,71 | ||||
| 2025-11-10 | 13F | Garda Capital Partners Lp | Put | 0 | -100,00 | 0 | -100,00 | |||
| 2025-11-10 | 13F | Garda Capital Partners Lp | Call | 0 | -100,00 | 0 | -100,00 | |||
| 2025-11-14 | 13F | Woodline Partners LP | 0 | -100,00 | 0 | |||||
| 2026-02-13 | 13F | MAI Capital Management | 5.339 | -1,42 | 159 | -18,46 | ||||
| 2026-02-03 | 13F | Legacy Wealth Managment, LLC/ID | 0 | -100,00 | 0 | -100,00 | ||||
| 2026-04-15 | 13F | Fortitude Family Office, LLC | 0 | -100,00 | 0 | |||||
| 2026-02-12 | 13F | State Board Of Administration Of Florida Retirement System | 37.685 | -3,77 | 1.123 | -20,58 | ||||
| 2026-02-17 | 13F | Ikarian Capital, LLC | 117.903 | -32,61 | 3.515 | -44,40 | ||||
| 2026-02-13 | 13F | Citigroup Inc | 483.525 | -35,26 | 14.414 | -46,58 | ||||
| 2026-01-29 | 13F | UBS Group AG | Put | 6.400 | -20,00 | 191 | -34,26 | |||
| 2026-02-17 | 13F | Price T Rowe Associates Inc /md/ | 605.945 | -36,78 | 18 | -47,06 | ||||
| 2026-01-29 | 13F | UBS Group AG | 537.019 | -13,14 | 16.009 | -28,32 | ||||
| 2026-02-06 | 13F | Gsa Capital Partners Llp | 7.417 | -31,92 | 0 | |||||
| 2026-02-02 | 13F | Danske Bank A/s | 700 | 0,00 | 21 | -20,00 | ||||
| 2025-11-14 | 13F | Wexford Capital Lp | 0 | -100,00 | 0 | -100,00 | ||||
| 2026-01-30 | 13F | Bogart Wealth, LLC | 16.774 | 500 | ||||||
| 2025-11-04 | 13F | Guerra Advisors Inc | 5 | 0 | ||||||
| 2026-02-14 | 13F | Rockefeller Capital Management L.P. | 229.279 | 1.190,55 | 687 | 7,18 | ||||
| 2026-02-17 | 13F | Boothbay Fund Management, Llc | 26.761 | -56,49 | 798 | -64,13 | ||||
| 2026-02-13 | 13F | Cynosure Management, Llc | 13.205 | 394 | ||||||
| 2025-11-14 | 13F | Cubist Systematic Strategies, LLC | 102.548 | -57,97 | 3.705 | -57,82 | ||||
| 2026-01-28 | 13F | DekaBank Deutsche Girozentrale | 3.724 | 0,00 | 0 | |||||
| 2026-02-17 | 13F | Cresset Asset Management, LLC | 7.132 | -22,78 | 213 | -36,34 | ||||
| 2026-02-03 | 13F | SBI Securities Co., Ltd. | 763 | -57,25 | 23 | -65,62 | ||||
| 2026-02-12 | 13F | Summit Financial, LLC | 90.126 | 2.687 | ||||||
| 2026-04-24 | 13F | Key FInancial Inc | 2.000 | 0,00 | 66 | 11,86 | ||||
| 2026-02-11 | 13F | Ameritas Investment Partners, Inc. | 11.790 | 351 | ||||||
| 2026-02-05 | 13F | Qsemble Capital Management, LP | 27.053 | -40,70 | 806 | -51,09 | ||||
| 2026-02-17 | 13F | Two Sigma Investments, Lp | 1.060.448 | 19,17 | 31.612 | -1,66 | ||||
| 2025-11-14 | 13F | First Turn Management, LLC | 0 | -100,00 | 0 | -100,00 | ||||
| 2025-11-14 | 13F | Fred Alger Management, Llc | 0 | -100,00 | 0 | |||||
| 2026-04-20 | 13F | Yorktown Management & Research Co Inc | 13.700 | 28,64 | 455 | 43,53 | ||||
| 2026-02-13 | 13F | Colony Group, LLC | 58.775 | 7,54 | 1.752 | -11,25 | ||||
| 2025-11-06 | 13F | Cookson Peirce & Co Inc | 0 | -100,00 | 0 | |||||
| 2026-02-17 | 13F | Advisory Services Network, LLC | 13.898 | -14,17 | 414 | -29,11 | ||||
| 2026-02-13 | 13F | Johnson Investment Counsel Inc | 8.212 | 245 | ||||||
| 2026-02-17 | 13F | Artia Global Partners LP | 0 | -100,00 | 0 | |||||
| 2026-02-12 | 13F | Ci Investments Inc. | 0 | -100,00 | 0 | |||||
| 2025-11-14 | 13F | S&t Bank/pa | 0 | -100,00 | 0 | -100,00 | ||||
| 2026-04-27 | 13F | New York State Teachers Retirement System | 116.021 | -3,67 | 4 | 0,00 | ||||
| 2026-02-12 | 13F | Bank Of Montreal /can/ | 512.378 | -0,05 | 15.274 | -17,53 | ||||
| 2026-02-10 | 13F | Commonwealth Of Pennsylvania Public School Empls Retrmt Sys | 33.660 | -2,59 | 1.003 | -19,63 | ||||
| 2026-02-17 | 13F | Point72 Asset Management, L.P. | 231.358 | -36,76 | 6.897 | -47,82 | ||||
| 2026-04-24 | 13F | Root Financial Partners, LLC | 91 | 85,71 | 3 | 200,00 | ||||
| 2025-11-14 | 13F | Mount Yale Investment Advisors, LLC | 0 | -100,00 | 0 | -100,00 | ||||
| 2026-01-06 | 13F | Clark Financial Services Group Inc /bd | 19.520 | -2,40 | 584 | -19,25 | ||||
| 2026-02-13 | 13F | Squarepoint Ops LLC | Call | 7.000 | -20,45 | 209 | -34,38 | |||
| 2026-03-31 | 13F/A | Barclays Plc | Call | 0 | -100,00 | 0 | -100,00 | |||
| 2026-02-13 | 13F | Squarepoint Ops LLC | 852.522 | 68,94 | 25.414 | 39,41 | ||||
| 2026-02-17 | 13F | SageView Advisory Group, LLC | 65 | 2 | ||||||
| 2026-02-13 | 13F | BNP Paribas Asset Management Holding S.A. | 1.901 | 42,50 | 0 | |||||
| 2026-01-12 | 13F | Daymark Wealth Partners, Llc | 49.528 | 0,06 | 1.476 | -17,45 | ||||
| 2026-04-22 | 13F | JNBA Financial Advisors | 500 | 0,00 | 17 | 14,29 | ||||
| 2026-01-09 | 13F | Westview Management dba Westview Investment Advisors | 32.024 | 955 | ||||||
| 2026-04-14 | 13F | Prospera Financial Services Inc | 20.998 | -20,74 | 698 | -11,66 | ||||
| 2026-02-13 | 13F | Smartleaf Asset Management LLC | 3.147 | 16,86 | 94 | -6,06 | ||||
| 2026-01-22 | 13F | Advantage Alpha Capital Partners LP | 0 | -100,00 | 0 | |||||
| 2026-02-17 | 13F | Jones Financial Companies Lllp | 8.052 | -18,92 | 240 | -31,82 | ||||
| 2026-02-12 | 13F | Nuveen, LLC | 953.206 | 34,11 | 28.415 | 10,67 | ||||
| 2026-02-09 | 13F | Hartland & Co., LLC | 137 | 0,74 | 4 | 0,00 | ||||
| 2026-02-17 | 13F | Northern Trust Corp | 1.419.519 | -5,47 | 42.316 | -22,00 | ||||
| 2026-01-30 | 13F | Us Bancorp \de\ | 2.593 | -1,41 | 77 | -18,95 | ||||
| 2026-02-10 | 13F | Quantbot Technologies LP | 8.777 | 262 | ||||||
| 2026-02-17 | 13F | Quantinno Capital Management LP | 70.518 | 11,61 | 2.102 | -7,89 | ||||
| 2026-04-08 | 13F | Wealth Enhancement Advisory Services, Llc | 18.117 | -9,40 | 128 | -78,14 | ||||
| 2026-02-12 | 13F | Dimensional Fund Advisors Lp | 472.787 | 1.725,22 | 14.094 | 1.407,27 | ||||
| 2026-02-13 | 13F | Parkside Financial Bank & Trust | 118 | 14,56 | 4 | 0,00 | ||||
| 2026-02-17 | 13F | Cim Investment Mangement Inc | 0 | -100,00 | 0 | -100,00 | ||||
| 2026-02-17 | 13F | Tang Capital Management Llc | 0 | -100,00 | 0 | -100,00 | ||||
| 2025-10-31 | 13F | Sector Gamma As | 0 | -100,00 | 0 | |||||
| 2025-10-31 | 13F | Cullen/frost Bankers, Inc. | 0 | -100,00 | 0 | -100,00 | ||||
| 2026-02-13 | 13F | Victory Capital Management Inc | 125.730 | -17,70 | 3.748 | -32,09 | ||||
| 2025-11-07 | 13F | Synovus Financial Corp | 11.500 | -14,81 | 415 | -14,43 | ||||
| 2026-02-17 | 13F | Alliancebernstein L.p. | 184.748 | 4,34 | 5.507 | -13,90 | ||||
| 2026-02-17 | 13F | Citadel Advisors Llc | Put | 385.800 | 5,76 | 11.501 | -12,73 | |||
| 2026-02-17 | 13F | Citadel Advisors Llc | Call | 223.800 | -31,31 | 6.671 | -43,32 | |||
| 2026-02-17 | 13F | Persistent Asset Partners Ltd | 33.212 | 136,54 | 990 | 95,27 | ||||
| 2026-01-28 | 13F | REDW Wealth LLC | 0 | -100,00 | 0 | |||||
| 2026-02-18 | 13F | First Citizens Bank & Trust Co | 14.410 | -4,11 | 430 | -20,85 | ||||
| 2026-01-29 | 13F | IMC-Chicago, LLC | Put | 46.100 | -11,85 | 1.374 | -27,26 | |||
| 2026-02-06 | 13F | Shakespeare Wealth Management, Inc. | 7.315 | -0,75 | 218 | -18,05 | ||||
| 2026-02-17 | 13F | Citadel Advisors Llc | 1.011.037 | 1,85 | 30.139 | -15,96 | ||||
| 2026-01-29 | 13F | IMC-Chicago, LLC | Call | 81.300 | -24,23 | 2.424 | -37,49 | |||
| 2026-02-17 | 13F | D. E. Shaw & Co., Inc. | 700.345 | 201,84 | 20.877 | 149,10 | ||||
| 2026-04-14 | 13F | Congress Asset Management Co /ma | 2.168.081 | 12,78 | 72.024 | 25,68 | ||||
| 2026-04-15 | 13F | Occidental Asset Management, LLC | 12.040 | 3,35 | 400 | 14,99 | ||||
| 2026-01-12 | 13F | Edge Wealth Management LLC | 0 | -100,00 | 0 | |||||
| 2026-02-17 | 13F | D. E. Shaw & Co., Inc. | Call | 68.100 | -20,63 | 2.030 | -34,49 | |||
| 2026-02-13 | 13F | Neuberger Berman Group LLC | 9.692 | 33,83 | 289 | 10,34 | ||||
| 2026-04-21 | 13F | GHP Investment Advisors, Inc. | 4 | 0 | ||||||
| 2026-02-17 | 13F | Bayesian Capital Management, LP | 0 | -100,00 | 0 | -100,00 | ||||
| 2026-01-12 | 13F | Rialto Wealth Management, LLC | 4 | 0 | ||||||
| 2026-04-27 | 13F | PFG Investments, LLC | 6.519 | -23,48 | 217 | -14,62 | ||||
| 2026-02-11 | 13F | Symphony Financial, Ltd. Co. | 0 | -100,00 | 0 | |||||
| 2026-04-20 | 13F | Ronald Blue Trust, Inc. | 310 | 0,00 | 10 | 11,11 | ||||
| 2026-02-17 | 13F | Voloridge Investment Management, Llc | 560.727 | 163,37 | 16.715 | 117,33 | ||||
| 2026-02-13 | 13F | Ubs Asset Management Americas Inc | 238.686 | -2,60 | 7.115 | -19,62 | ||||
| 2026-02-18 | 13F/A | Empowered Funds, LLC | 56.977 | 1.698 | ||||||
| 2025-11-14 | 13F | Nicholas Investment Partners, LP | 0 | -100,00 | 0 | -100,00 | ||||
| 2026-02-05 | 13F | Allworth Financial LP | 598 | 5,47 | 18 | -15,00 | ||||
| 2026-02-12 | 13F | Castleark Management Llc | 0 | -100,00 | 0 | |||||
| 2026-02-17 | 13F | Man Group plc | 956.637 | -5,14 | 28.517 | -21,72 | ||||
| 2026-02-12 | 13F | Connecticut Wealth Management, LLC | 7.782 | 0,00 | 232 | -17,79 | ||||
| 2025-11-12 | 13F | Polen Capital Management Llc | 0 | -100,00 | 0 | -100,00 | ||||
| 2026-02-13 | 13F | Pathstone Holdings, LLC | 0 | -100,00 | 0 | -100,00 | ||||
| 2026-04-13 | 13F | E Fund Management Co., Ltd. | 20.706 | -1,44 | 688 | -9,13 | ||||
| 2026-04-17 | 13F | Bell Investment Advisors, Inc | 25 | 0,00 | 1 | |||||
| 2026-02-09 | 13F | Hantz Financial Services, Inc. | 1.237 | 82,72 | 0 | |||||
| 2026-02-12 | 13F | Great Lakes Advisors, Llc | 17.939 | 12,85 | 535 | -6,97 | ||||
| 2026-02-13 | 13F | Charles Schwab Investment Management Inc | 1.311.689 | 0,12 | 39.101 | -17,38 | ||||
| 2026-02-12 | 13F | Xponance, Inc. | 11.518 | 0,87 | 343 | -16,75 | ||||
| 2026-02-13 | 13F | Rhenman & Partners Asset Management AB | 73.250 | -21,24 | 2.184 | -35,01 | ||||
| 2025-11-14 | 13F | 1832 Asset Management L.P. | 0 | -100,00 | 0 | -100,00 | ||||
| 2026-02-09 | 13F | New Age Alpha Advisors, LLC | 6.354 | -9,50 | 189 | -25,30 | ||||
| 2026-02-13 | 13F | Toroso Investments, LLC | 7.725 | 230 | ||||||
| 2026-02-09 | 13F | Legal & General Group Plc | 355.515 | 1,11 | 10.598 | -16,57 | ||||
| 2026-04-15 | 13F | Hartford Financial Management Inc. | 353 | 0,00 | 12 | 10,00 | ||||
| 2026-02-19 | 13F | CI Private Wealth, LLC | 41.764 | 3,65 | 1.245 | -14,50 | ||||
| 2026-02-17 | 13F | Gilder Gagnon Howe & Co Llc | 20.393 | -71,42 | 608 | -76,45 | ||||
| 2026-02-11 | 13F | Havemeyer Place LP | 299 | 9 | ||||||
| 2026-04-15 | 13F | Bayforest Capital Ltd | 518 | 17 | ||||||
| 2026-02-17 | 13F | MIRAE ASSET GLOBAL ETFS HOLDINGS Ltd. | 78.612 | 0,37 | 2.343 | -17,42 | ||||
| 2026-02-17 | 13F | Capital Fund Management S.a. | Put | 15.900 | 6,00 | 474 | -12,57 | |||
| 2026-02-17 | 13F | Creative Planning | 62.889 | -17,59 | 1.875 | -32,00 | ||||
| 2026-02-17 | 13F | Capital Fund Management S.a. | Call | 19.900 | 25,95 | 593 | 4,04 | |||
| 2026-02-13 | 13F | Public Sector Pension Investment Board | 470.286 | -11,14 | 14.019 | -26,68 | ||||
| 2026-02-13 | 13F | Manufacturers Life Insurance Company, The | 0 | -100,00 | 0 | |||||
| 2026-04-17 | 13F | AdvisorNet Financial, Inc | 1.620 | 0,00 | 54 | 10,42 | ||||
| 2026-03-20 | 13F/A | Hsbc Holdings Plc | 146.087 | 228,72 | 4.374 | 172,46 | ||||
| 2025-11-14 | 13F | Quarry LP | 0 | -100,00 | 0 | -100,00 | ||||
| 2025-11-13 | 13F | Wells Fargo & Company/mn | Put | 0 | -100,00 | 0 | -100,00 | |||
| 2026-02-17 | 13F | Persistent Asset Partners Ltd | Put | 265 | 24 | |||||
| 2026-02-13 | 13F | Natixis | 29 | 1 | ||||||
| 2026-04-21 | 13F | Grimes & Company, Inc. | 6.100 | 203 | ||||||
| 2026-02-13 | 13F | Financial Network Wealth Advisors LLC | 58 | 2 | ||||||
| 2026-04-23 | 13F | Iridian Asset Management Llc/ct | 75.289 | 0,00 | 2.501 | 11,45 | ||||
| 2025-11-13 | 13F | Inceptionr Llc | 0 | -100,00 | 0 | -100,00 | ||||
| 2026-04-13 | 13F | Parkwoods Wealth Partners, LLC | 8.681 | 23,87 | 288 | 38,46 | ||||
| 2026-04-27 | 13F | Quantum Private Wealth, LLC | 98.908 | 0,00 | 3.286 | 11,43 | ||||
| 2026-02-03 | 13F | Emerald Investment Partners, Llc | 0 | -100,00 | 0 | -100,00 | ||||
| 2026-04-21 | 13F | Wealth Effects Llc | 12.000 | 0,00 | 399 | 11,48 | ||||
| 2025-11-14 | 13F | Driehaus Capital Management Llc | 0 | -100,00 | 0 | -100,00 | ||||
| 2026-04-06 | 13F | GAMMA Investing LLC | 3.924 | 12,18 | 130 | 25,00 | ||||
| 2026-04-27 | 13F | Leonteq Securities AG | 0 | -100,00 | 0 | |||||
| 2026-01-22 | 13F | Brookwood Investment Group LLC | 0 | -100,00 | 0 | |||||
| 2026-02-06 | 13F | Envestnet Portfolio Solutions, Inc. | 17.984 | 29,37 | 536 | 6,77 | ||||
| 2026-02-17 | 13F | Schonfeld Strategic Advisors LLC | 21.390 | 22,90 | 638 | 1,43 | ||||
| 2026-02-19 | 13F | Mcguire Capital Advisors Inc | 259 | 8 | ||||||
| 2026-02-17 | 13F | Royal Bank Of Canada | 41.834 | -90,83 | 1.248 | -92,43 | ||||
| 2026-02-02 | 13F | Hussman Strategic Advisors, Inc. | 0 | -100,00 | 0 | |||||
| 2026-02-11 | 13F | Illinois Municipal Retirement Fund | 79.904 | 22,27 | 2.382 | 0,89 | ||||
| 2026-04-08 | 13F | E Fund Management (Hong Kong) Co., Ltd. | 492 | 16 | ||||||
| 2026-02-11 | 13F | Rise Advisors, LLC | 0 | -100,00 | 0 | |||||
| 2026-02-10 | 13F | Nomura Asset Management Co Ltd | 0 | 0 | ||||||
| 2026-02-17 | 13F | Odyssean, LLC | 15.765 | 470 | ||||||
| 2026-02-03 | 13F | Crossmark Global Holdings, Inc. | 8.332 | 8,63 | 248 | -10,47 | ||||
| 2026-02-09 | 13F | Accent Capital Management, LLC | 164 | 0,00 | 5 | -20,00 | ||||
| 2026-04-21 | 13F | Gilpin Wealth Management, Llc | 23 | 666,67 | 1 | |||||
| 2026-02-13 | 13F | Integrated Wealth Concepts LLC | 0 | -100,00 | 0 | -100,00 | ||||
| 2026-02-17 | 13F | Advisor Group Holdings, Inc. | 285.755 | 125,73 | 8.518 | 124,39 | ||||
| 2026-02-06 | 13F | EverSource Wealth Advisors, LLC | 703 | -30,33 | 21 | -44,44 | ||||
| 2026-02-13 | 13F | SRS Capital Advisors, Inc. | 135 | 4 | ||||||
| 2026-01-20 | 13F | Stratos Wealth Advisors, LLC | 8.022 | 0,00 | 239 | -17,30 | ||||
| 2026-02-12 | 13F | Johnson Financial Group, Inc. | 687 | -66,57 | 20 | -72,97 | ||||
| 2026-02-17 | 13F | Capital Fund Management S.a. | 38.154 | -68,63 | 1.137 | -74,12 | ||||
| 2026-04-17 | 13F | PSP Research LLC | 13.000 | -27,00 | 432 | -18,68 | ||||
| 2026-02-02 | 13F | Fifth Third Bancorp | 741 | 8,81 | 22 | -8,33 | ||||
| 2026-04-27 | 13F | Simplify Asset Management Inc. | 16.049 | -30,92 | 533 | -22,98 | ||||
| 2026-02-12 | 13F | Wealthspire Advisors, LLC | 0 | -100,00 | 0 | |||||
| 2026-02-17 | 13F | Capstone Investment Advisors, Llc | 0 | -100,00 | 0 | -100,00 | ||||
| 2026-04-27 | 13F | Truist Financial Corp | 22.276 | 740 | ||||||
| 2026-02-06 | 13F | Pnc Financial Services Group, Inc. | 9.655 | -12,83 | 288 | -28,25 | ||||
| 2026-02-17 | 13F | Freestone Grove Partners LP | 14.746 | 440 | ||||||
| 2026-02-05 | 13F | Amalgamated Bank | 39.722 | 1,21 | 1 | 0,00 | ||||
| 2026-02-13 | 13F | Barclays Plc | 446.720 | -2,51 | 13.317 | -19,56 | ||||
| 2026-02-05 | 13F | DnB Asset Management AS | 17.845 | 28,34 | 532 | 5,78 | ||||
| 2026-02-13 | 13F | Eventide Asset Management, Llc | 716.414 | -24,95 | 21.356 | -38,07 | ||||
| 2026-02-17 | 13F | Millennium Management Llc | 675.910 | 132,36 | 20.149 | 91,74 | ||||
| 2026-02-11 | 13F | O'shaughnessy Asset Management, Llc | 0 | -100,00 | 0 | |||||
| 2026-02-17 | 13F | Wellington Management Group Llp | 61.507 | 1,49 | 1.834 | -16,26 | ||||
| 2025-11-03 | 13F | Summit Global Investments | 0 | -100,00 | 0 | |||||
| 2026-02-10 | 13F | Natixis Advisors, L.p. | 44.494 | 4,82 | 1 | 0,00 | ||||
| 2026-02-17 | 13F | Diadema Partners Lp | Put | 100.000 | 2.981 | |||||
| 2026-01-23 | 13F | Rsm Us Wealth Management Llc | 7.933 | -6,14 | 236 | -22,62 | ||||
| 2026-02-17 | 13F | Diadema Partners Lp | 123.283 | 102,94 | 3.675 | 67,50 | ||||
| 2026-02-05 | 13F | Atria Investments Llc | 7.297 | 218 | ||||||
| 2026-02-17 | 13F | Russell Investments Group, Ltd. | 204.982 | 11,27 | 6.111 | -8,19 | ||||
| 2026-02-17 | 13F | Raymond James Financial Inc | 629.945 | -6,55 | 18.769 | -22,93 | ||||
| 2026-04-16 | 13F | Brookstone Capital Management | 17.521 | 0,00 | 582 | 11,49 | ||||
| 2025-11-12 | 13F | Legato Capital Management LLC | 0 | -100,00 | 0 | |||||
| 2026-02-17 | 13F | Jump Financial, LLC | 0 | -100,00 | 0 | |||||
| 2026-02-13 | 13F | Pingora Partners LLC | 2.100 | 31,25 | 63 | 8,77 | ||||
| 2026-02-17 | 13F | Pinnacle Financial Partners, Inc. | 8.600 | 256 | ||||||
| 2026-02-17 | 13F | Susquehanna International Group, Llp | Call | 1.056.500 | 34,48 | 31.494 | 10,96 | |||
| 2026-02-17 | 13F | Susquehanna International Group, Llp | 887.451 | 25,29 | 26.455 | 3,38 | ||||
| 2026-02-04 | 13F | Swiss Life Asset Management Ltd | 6.941 | 0,00 | 207 | -17,60 | ||||
| 2026-02-17 | 13F | Susquehanna International Group, Llp | Put | 778.300 | -3,74 | 23.201 | -20,57 | |||
| 2026-01-28 | 13F | Geneos Wealth Management Inc. | 2.169 | 0,00 | 65 | -17,95 | ||||
| 2026-02-17 | 13F | Hood River Capital Management LLC | 1.581.234 | 1,83 | 47.137 | -15,97 | ||||
| 2026-04-24 | 13F | UMA Financial Services, Inc. | 32 | 1 | ||||||
| 2026-01-15 | 13F | Allspring Global Investments Holdings, LLC | 17.118 | -23,13 | 501 | -38,45 | ||||
| 2026-02-18 | 13F | CacheTech Inc. | 7.107 | 0,00 | 214 | -17,12 | ||||
| 2026-02-17 | 13F | Fmr Llc | 226.996 | -68,09 | 6.767 | -73,67 | ||||
| 2026-02-04 | 13F | Virginia Retirement Systems Et Al | 46.731 | 0,00 | 1.393 | -17,48 | ||||
| 2026-02-17 | 13F | Tudor Investment Corp Et Al | Call | 0 | -100,00 | 0 | -100,00 | |||
| 2026-02-03 | 13F | Bokf, Na | 1.303 | 0,00 | 39 | -19,15 | ||||
| 2026-02-10 | 13F | Envestnet Asset Management Inc | 73.289 | 35,81 | 2.185 | 12,06 | ||||
| 2026-02-12 | 13F | Jane Street Group, Llc | Put | 689.300 | 72,97 | 20.548 | 42,74 | |||
| 2026-02-12 | 13F | Jane Street Group, Llc | Call | 157.300 | -38,63 | 4.689 | -49,35 | |||
| 2026-02-02 | 13F | Pittenger & Anderson Inc | 612 | 0,00 | 18 | -18,18 | ||||
| 2026-04-27 | 13F | Y-Intercept (Hong Kong) Ltd | 9.165 | 304 | ||||||
| 2026-02-12 | 13F | Jane Street Group, Llc | 969.975 | -14,07 | 28.915 | -29,09 | ||||
| 2026-02-12 | 13F | Campbell & CO Investment Adviser LLC | 0 | -100,00 | 0 | |||||
| 2026-04-23 | 13F | Marquette Asset Management, LLC | 49 | 2 | ||||||
| 2026-02-11 | 13F | Winton Capital Group Ltd | 25.242 | -79,81 | 752 | -83,34 | ||||
| 2026-01-14 | 13F | Hennion & Walsh Asset Management, Inc. | 0 | -100,00 | 0 | -100,00 | ||||
| 2026-02-17 | 13F | Optiver Holding B.V. | 88 | -88,31 | 3 | -92,59 | ||||
| 2026-01-29 | 13F | Dunhill Financial, LLC | 4 | 0 | ||||||
| 2026-04-21 | 13F | Signature Wealth Management Partners, LLC | 11.780 | 9,28 | 391 | 21,81 | ||||
| 2026-02-09 | 13F | Harbour Investments, Inc. | 454 | 14 | ||||||
| 2026-02-12 | 13F | Principal Securities, Inc. | 0 | -100,00 | 0 | |||||
| 2026-01-20 | 13F | Toth Financial Advisory Corp | 0 | -100,00 | 0 | |||||
| 2026-02-11 | 13F | Group One Trading, L.p. | Call | 262.200 | 11,38 | 7.816 | -8,08 | |||
| 2026-02-17 | 13F | Ameriflex Group, Inc. | 100 | -50,00 | 3 | -71,43 | ||||
| 2026-02-11 | 13F | Group One Trading, L.p. | Put | 126.500 | -25,06 | 3.771 | -38,17 | |||
| 2026-02-12 | 13F | CIBC Private Wealth Group, LLC | 221 | 12,18 | 7 | -14,29 | ||||
| 2026-02-11 | 13F | Group One Trading, L.p. | 228.507 | -25,23 | 6.812 | -38,30 | ||||
| 2026-02-17 | 13F | nVerses Capital, LLC | 8.392 | 250 | ||||||
| 2026-04-22 | 13F | Spire Wealth Management | 400 | 0,00 | 13 | 18,18 | ||||
| 2026-01-29 | 13F | Teachers Retirement System Of The State Of Kentucky | 33.786 | -11,84 | 1 | 0,00 | ||||
| 2025-11-26 | 13F/A | Jpmorgan Chase & Co | Call | 0 | -100,00 | 0 | -100,00 | |||
| 2025-11-26 | 13F/A | Jpmorgan Chase & Co | Put | 0 | -100,00 | 0 | -100,00 | |||
| 2026-02-17 | 13F | Aster Capital Management (DIFC) Ltd | 62 | 2 | ||||||
| 2026-04-16 | 13F | Capital Advisors, Ltd. LLC | 76 | -62,00 | 0 | |||||
| 2026-02-13 | 13F | Entropy Technologies, LP | 60.415 | 822,65 | 1.801 | 662,71 | ||||
| 2026-02-11 | 13F | Hughes Financial Services, LLC | 2 | 0 | ||||||
| 2025-11-14 | 13F | Point72 Asia (Singapore) Pte. Ltd. | 4.060 | 147 | ||||||
| 2026-04-14 | 13F | Banque Pictet & Cie Sa | 0 | -100,00 | 0 | |||||
| 2026-04-21 | 13F | Venturi Wealth Management, LLC | 9.196 | 0,00 | 305 | 11,31 | ||||
| 2026-02-06 | 13F | HighTower Advisors, LLC | 23.282 | -16,23 | 694 | -30,88 | ||||
| 2026-02-09 | 13F | Quest Partners LLC | 3.221 | -24,62 | 96 | -37,66 | ||||
| 2026-02-09 | 13F | Keating Financial Advisory Services, Inc. | 45 | 1 | ||||||
| 2026-02-11 | 13F | Deutsche Bank Ag\ | 155.926 | 3,45 | 4.648 | -14,64 | ||||
| 2026-04-24 | 13F | Strs Ohio | 8.700 | 0,00 | 289 | 11,58 | ||||
| 2026-02-17 | 13F | SummitTX Capital, L.P. | 43.092 | 195,78 | 1.285 | 144,11 | ||||
| 2026-02-11 | 13F | Syon Capital Llc | 8.501 | 253 | ||||||
| 2026-02-13 | 13F | Truvestments Capital Llc | 1.621 | 172,44 | 48 | 128,57 | ||||
| 2026-02-12 | 13F | Mark Sheptoff Financial Planning, Llc | 0 | -100,00 | 0 | |||||
| 2026-02-09 | 13F | Annis Gardner Whiting Capital Advisors, LLC | 0 | -100,00 | 0 | |||||
| 2026-01-26 | 13F | Whittier Trust Co Of Nevada Inc | 0 | -100,00 | 0 | |||||
| 2026-04-23 | 13F | SJS Investment Consulting Inc. | 16 | 33,33 | 1 | |||||
| 2026-01-29 | 13F | Comerica Bank | 31.100 | -23,91 | 927 | -37,20 | ||||
| 2026-02-13 | 13F | State Street Corp | 8.479.999 | 4,68 | 252.789 | -13,62 | ||||
| 2026-02-06 | 13F | Larson Financial Group LLC | Call | 300 | 0,00 | 0 | -100,00 | |||
| 2026-04-21 | 13F | Avaii Wealth Management, Llc | 29.105 | 7,17 | 967 | 19,41 | ||||
| 2026-04-07 | 13F | Signaturefd, Llc | 159 | 354,29 | 5 | 400,00 | ||||
| 2026-02-12 | 13F | Sit Investment Associates Inc | 20.480 | 0,00 | 1 | |||||
| 2026-02-13 | 13F | Caitong International Asset Management Co., Ltd | 249 | 7 | ||||||
| 2026-02-10 | 13F | Acadian Asset Management Llc | 10.773 | 0 | ||||||
| 2025-11-13 | 13F | Norges Bank | 0 | -100,00 | 0 | |||||
| 2026-02-13 | 13F | Golden State Wealth Management, LLC | 433 | 0,00 | 13 | -20,00 | ||||
| 2026-02-10 | 13F | Private Wealth Asset Management, LLC | 165 | 0,00 | 5 | -20,00 | ||||
| 2026-04-15 | 13F | Exchange Traded Concepts, Llc | 30.193 | 24,00 | 1.003 | 38,34 | ||||
| 2026-02-17 | 13F | California State Teachers Retirement System | 142.178 | -0,09 | 4.238 | -17,55 | ||||
| 2026-04-16 | 13F | CWC Advisors, LLC. | 19.081 | 44,19 | 634 | 60,66 | ||||
| 2026-02-11 | 13F | Tradition Wealth Management, LLC | 0 | -100,00 | 0 | -100,00 | ||||
| 2026-02-10 | 13F | Lido Advisors, LLC | 14.560 | 1,99 | 516 | 0,00 | ||||
| 2026-04-22 | 13F | Pictet Asset Management Holding SA | 1.747.373 | 19,60 | 58.048 | 33,28 | ||||
| 2026-02-17 | 13F | ACT Capital Management, LLLP | 268.875 | 8.015 | ||||||
| 2026-02-13 | 13F | Gen-Wealth Partners Inc | 0 | -100,00 | 0 | |||||
| 2026-02-13 | 13F | Squarepoint Ops LLC | Put | 0 | -100,00 | 0 | -100,00 | |||
| 2026-04-23 | 13F | Farmers & Merchants Investments Inc | 80 | 0,00 | 3 | 0,00 | ||||
| 2026-02-09 | 13F | Huntington National Bank | 277 | 10,36 | 8 | -11,11 | ||||
| 2026-02-18 | 13F | Mackenzie Financial Corp | 9.101 | -4,62 | 270 | -21,51 | ||||
| 2026-04-17 | 13F | Vermillion Wealth Management, Inc. | 500 | -50,00 | 17 | -44,83 | ||||
| 2026-02-17 | 13F | Ameriprise Financial Inc | 360.204 | -3,41 | 10.738 | -20,30 | ||||
| 2026-02-12 | 13F | Hrt Financial Lp | 195.359 | 80,42 | 6 | 66,67 | ||||
| 2026-04-16 | 13F | SG Americas Securities, LLC | 69.748 | -10,99 | 2 | 0,00 | ||||
| 2026-02-12 | 13F | MetLife Investment Management, LLC | 80.434 | -5,15 | 2.398 | -21,74 | ||||
| 2026-02-13 | 13F | Walleye Trading LLC | Put | 32.300 | -47,31 | 963 | -56,55 | |||
| 2026-02-17 | 13F | XTX Topco Ltd | 0 | -100,00 | 0 | |||||
| 2026-02-09 | 13F | Atlantic Trust, LLC | 0 | -100,00 | 0 | |||||
| 2026-02-13 | 13F | Walleye Trading LLC | Call | 11.700 | -47,53 | 349 | -56,77 | |||
| 2026-01-29 | 13F | IMC-Chicago, LLC | 0 | -100,00 | 0 | -100,00 | ||||
| 2026-02-13 | 13F | Walleye Trading LLC | 36.541 | 34,24 | 1.089 | 10,78 | ||||
| 2026-02-05 | 13F | Bessemer Group Inc | 131.952 | 14.545,06 | 4 | |||||
| 2026-02-17 | 13F | Two Sigma Advisers, Lp | 599.600 | 40,03 | 17.874 | 15,55 | ||||
| 2026-01-28 | 13F | Arizona State Retirement System | 41.924 | -6,09 | 1.250 | -22,52 | ||||
| 2025-11-14 | 13F | EAM Investors, LLC | 0 | -100,00 | 0 | |||||
| 2025-11-10 | 13F | Sigma Planning Corp | 0 | -100,00 | 0 | |||||
| 2026-02-13 | 13F | Kestra Advisory Services, LLC | 0 | -100,00 | 0 | |||||
| 2026-02-17 | 13F | Janus Henderson Group Plc | 64.357 | 0,00 | 1.918 | -17,47 | ||||
| 2026-02-18 | 13F | GWM Advisors LLC | 8.707 | 0,23 | 260 | -17,25 | ||||
| 2026-01-21 | 13F | Flagship Harbor Advisors, Llc | 639 | 19 | ||||||
| 2026-02-12 | 13F | BlackRock, Inc. | 21.848.462 | 2,57 | 651.303 | -15,36 | ||||
| 2026-02-11 | 13F | Jpmorgan Chase & Co | 131.946 | -42,11 | 3.933 | -52,23 | ||||
| 2026-02-03 | 13F | Mitsubishi UFJ Kokusai Asset Management Co., Ltd. | 6.171 | 13,65 | 181 | -8,16 | ||||
| 2026-02-12 | 13F | Brown Brothers Harriman & Co | 132 | 0,00 | 4 | -25,00 | ||||
| 2026-01-26 | 13F | Main Street Group, LTD | 0 | -100,00 | 0 | |||||
| 2026-01-28 | 13F | Salomon & Ludwin, LLC | 988 | 7,04 | 30 | -12,12 | ||||
| 2026-01-30 | 13F/A | M&t Bank Corp | 10.005 | 299 | ||||||
| 2026-02-17 | 13F | Virtus Investment Advisers, Inc. | 21.799 | 83,31 | 650 | 51,28 | ||||
| 2025-10-29 | 13F | Harel Insurance Investments & Financial Services Ltd. | 0 | -100,00 | 0 | |||||
| 2026-04-27 | 13F | Sound Income Strategies, LLC | 630 | 16,45 | 21 | 31,25 | ||||
| 2026-02-17 | 13F | Wealth Watch Advisors, INC | 72 | 2 | ||||||
| 2025-11-10 | 13F | Options Solutions, Llc | 0 | -100,00 | 0 | -100,00 | ||||
| 2026-02-06 | 13F | Handelsbanken Fonder AB | 47.400 | -0,21 | 1 | 0,00 | ||||
| 2026-02-11 | 13F | LPL Financial LLC | 96.533 | -28,27 | 2.878 | -40,81 | ||||
| 2026-02-17 | 13F | Brevan Howard Capital Management LP | 38.052 | 107,31 | 1.134 | 71,30 | ||||
| 2026-02-13 | 13F | Police & Firemen's Retirement System of New Jersey | 39.632 | -1,38 | 1.181 | -18,61 | ||||
| 2026-02-10 | 13F | Bnp Paribas Arbitrage, Sa | 683.653 | 856,64 | 20.380 | 689,58 | ||||
| 2025-11-14 | 13F/A | Skopos Labs, Inc. | 0 | -100,00 | 0 | -100,00 | ||||
| 2026-02-10 | 13F | Mutual Of America Capital Management Llc | 15.540 | 2,24 | 463 | -15,66 | ||||
| 2026-02-13 | 13F | Walleye Capital LLC | Put | 47.300 | 38,30 | 1.410 | 14,17 | |||
| 2026-02-13 | 13F | Sei Investments Co | 73.068 | 86,08 | 2.178 | 53,60 | ||||
| 2026-02-06 | 13F | Covestor Ltd | 1.810 | 563,00 | 0 | |||||
| 2026-04-07 | 13F | Farther Finance Advisors, LLC | 525 | 37,43 | 18 | 54,55 | ||||
| 2026-02-13 | 13F | Walleye Capital LLC | 60.566 | 347,41 | 1.805 | 269,12 | ||||
| 2026-02-13 | 13F | Walleye Capital LLC | Call | 3.200 | -88,57 | 95 | -90,60 | |||
| 2026-02-13 | 13F | Rhumbline Advisers | 380.934 | -5,34 | 11.356 | -21,89 | ||||
| 2026-02-17 | 13F | PDT Partners, LLC | 41.585 | 29,21 | 1.240 | 6,63 | ||||
| 2026-01-28 | 13F | Teacher Retirement System Of Texas | 22.364 | -39,62 | 667 | -50,22 | ||||
| 2025-11-06 | 13F | CBIZ Investment Advisory Services, LLC | 0 | -100,00 | 0 | -100,00 | ||||
| 2026-02-13 | 13F | Verition Fund Management LLC | 0 | -100,00 | 0 | |||||
| 2026-02-17 | 13F | Cantor Fitzgerald, L. P. | 0 | -100,00 | 0 | |||||
| 2026-02-26 | 13F | TD Capital Management LLC | 10 | 0 | ||||||
| 2025-11-13 | 13F | Riggs Asset Managment Co. Inc. | 0 | -100,00 | 0 | |||||
| 2026-01-28 | 13F | Kingswood Wealth Advisors, Llc | 0 | -100,00 | 0 | |||||
| 2026-02-13 | 13F | Pinnacle Wealth Planning Services, Inc. | 1.989 | 59 | ||||||
| 2026-02-10 | 13F/A | Northwestern Mutual Wealth Management Co | 6.369 | -6,32 | 190 | -22,86 | ||||
| 2026-02-17 | 13F | 683 Capital Management, LLC | 360.000 | 10,77 | 10.732 | -8,59 | ||||
| 2026-02-17 | 13F | Maryland State Retirement & Pension System | 19.899 | 2,01 | 593 | -15,77 | ||||
| 2026-02-17 | 13F | State Of Wisconsin Investment Board | 89.077 | -46,10 | 2.655 | -55,53 | ||||
| 2025-11-14 | 13F | Cubist Systematic Strategies, LLC | Call | 0 | -100,00 | 0 | -100,00 | |||
| 2026-02-04 | 13F | Pandora Wealth, Inc. | 78.100 | -0,26 | 2.328 | -17,68 | ||||
| 2026-01-28 | 13F | Klp Kapitalforvaltning As | 32.000 | 3,90 | 954 | -14,30 | ||||
| 2026-02-13 | 13F | Rafferty Asset Management, LLC | 190.112 | -10,35 | 5.667 | -26,02 | ||||
| 2026-02-13 | 13F | Wells Fargo & Company/mn | 395.680 | 45,11 | 11.795 | 19,75 | ||||
| 2025-11-13 | 13F | Hsbc Holdings Plc | Call | 0 | -100,00 | 0 | -100,00 | |||
| 2026-01-23 | 13F | Gibbs Wealth Management | 15.986 | 455 | ||||||
| 2026-02-13 | 13F | Van Eck Associates Corp | 0 | -100,00 | 0 | |||||
| 2026-02-04 | 13F | Oregon Public Employees Retirement Fund | 31.062 | 1,64 | 926 | -16,21 | ||||
| 2025-11-12 | 13F | Commerce Bank | 0 | -100,00 | 0 | -100,00 | ||||
| 2026-04-20 | 13F | Assenagon Asset Management S.A. | 510.054 | 218,01 | 16.944 | 254,38 | ||||
| 2026-02-19 | 13F | Invesco Ltd. | 1.609.815 | 47,10 | 47.989 | 21,39 | ||||
| 2026-04-21 | 13F | Nemes Rush Group LLC | 2.019 | 0,00 | 67 | 11,67 | ||||
| 2026-04-24 | 13F | ProShare Advisors LLC | 22.500 | -20,01 | 747 | -10,86 | ||||
| 2026-02-13 | 13F | Stifel Financial Corp | 37.469 | 209,15 | 1.117 | 155,38 | ||||
| 2026-02-12 | 13F | New York State Common Retirement Fund | 374.574 | 4,39 | 11.166 | -13,86 | ||||
| 2026-02-13 | 13F | Mariner, LLC | 25.469 | -0,09 | 759 | -17,50 | ||||
| 2026-02-17 | 13F | Cetera Investment Advisers | 76.364 | 10,11 | 2.276 | -9,14 | ||||
| 2026-02-17 | 13F | Caption Management, LLC | Put | 159.700 | 0,69 | 4.761 | -16,91 | |||
| 2026-02-17 | 13F | Caption Management, LLC | Call | 60.000 | -22,18 | 1.789 | -35,80 | |||
| 2026-02-09 | 13F | Penn Capital Management Co Inc | 538.117 | 3,23 | 16.082 | -14,81 | ||||
| 2026-02-13 | 13F | Segall Bryant & Hamill, Llc | 192.454 | 147,27 | 5.737 | 104,09 | ||||
| 2026-01-21 | 13F | Portside Wealth Group, LLC | 12.051 | 359 | ||||||
| 2026-02-12 | 13F | Swiss National Bank | 297.200 | 1,68 | 8.860 | -16,10 | ||||
| 2026-02-12 | 13F | JPL Wealth Management, LLC | 0 | -100,00 | 0 | |||||
| 2026-01-30 | 13F | NJ State Employees Deferred Compensation Plan | 0 | -100,00 | 0 | |||||
| 2026-04-15 | 13F | Norden Group Llc | 6.810 | 226 | ||||||
| 2026-02-12 | 13F | Knott David M Jr | 45.000 | 1.341 | ||||||
| 2026-02-13 | 13F | Morgan Stanley | 1.503.037 | 20,45 | 44.806 | -0,60 | ||||
| 2025-11-12 | 13F | NewSquare Capital LLC | 0 | -100,00 | 0 | |||||
| 2025-11-21 | 13F/A | CIBC Bancorp USA Inc. | 15.483 | 559 | ||||||
| 2026-02-12 | 13F | Marex Group plc | 286.630 | -2,66 | 8.544 | -19,68 | ||||
| 2026-01-13 | 13F | Matrix Trust Co | 0 | -100,00 | 0 | |||||
| 2026-02-13 | 13F | Prudential Financial Inc | 185.610 | -4,99 | 5.533 | -21,60 | ||||
| 2026-01-30 | 13F | Rachor Investment Advisory Services, LLC | 15 | 0 | ||||||
| 2026-02-11 | 13F | Cedar Mountain Advisors, LLC | 1 | 0 | ||||||
| 2026-02-17 | 13F | Qube Research & Technologies Ltd | 35.448 | 1.057 | ||||||
| 2026-04-13 | 13F | Massmutual Trust Co Fsb/adv | 114 | 4,59 | 4 | 0,00 | ||||
| 2026-02-17 | 13F | Gotham Asset Management, LLC | 45.181 | -0,33 | 1.347 | -17,78 | ||||
| 2026-02-17 | 13F | TCG Advisory Services, LLC | 0 | -100,00 | 0 | |||||
| 2026-01-26 | 13F | KBC Group NV | 4.140 | 0,00 | 0 | |||||
| 2026-02-11 | 13F | Gwn Securities Inc. | 24.725 | 16,73 | 737 | -3,66 | ||||
| 2026-01-27 | 13F | Zurcher Kantonalbank (Zurich Cantonalbank) | 33.393 | 6,33 | 995 | -12,26 | ||||
| 2025-10-30 | 13F | Twin Peaks Wealth Advisors, LLC | 0 | -100,00 | 0 | -100,00 | ||||
| 2025-11-07 | 13F | Sierra Ocean, Llc | 0 | -100,00 | 0 | -100,00 |