Grundlæggende statistik
| Institutionelle ejere | 290 total, 290 long only, 0 short only, 0 long/short - change of 3,57% MRQ |
| Del pris | 51,00 |
| Gennemsnitlig porteføljeallokering | 0.0865 % - change of -34,05% MRQ |
| Institutionelle aktier (lange) | 23.436.481 (ex 13D/G) - change of 2,14MM shares 10,03% MRQ |
| Institutionel værdi (lang) | $ 1.239.601 USD ($1000) |
Institutionelt ejerskab og aktionærer
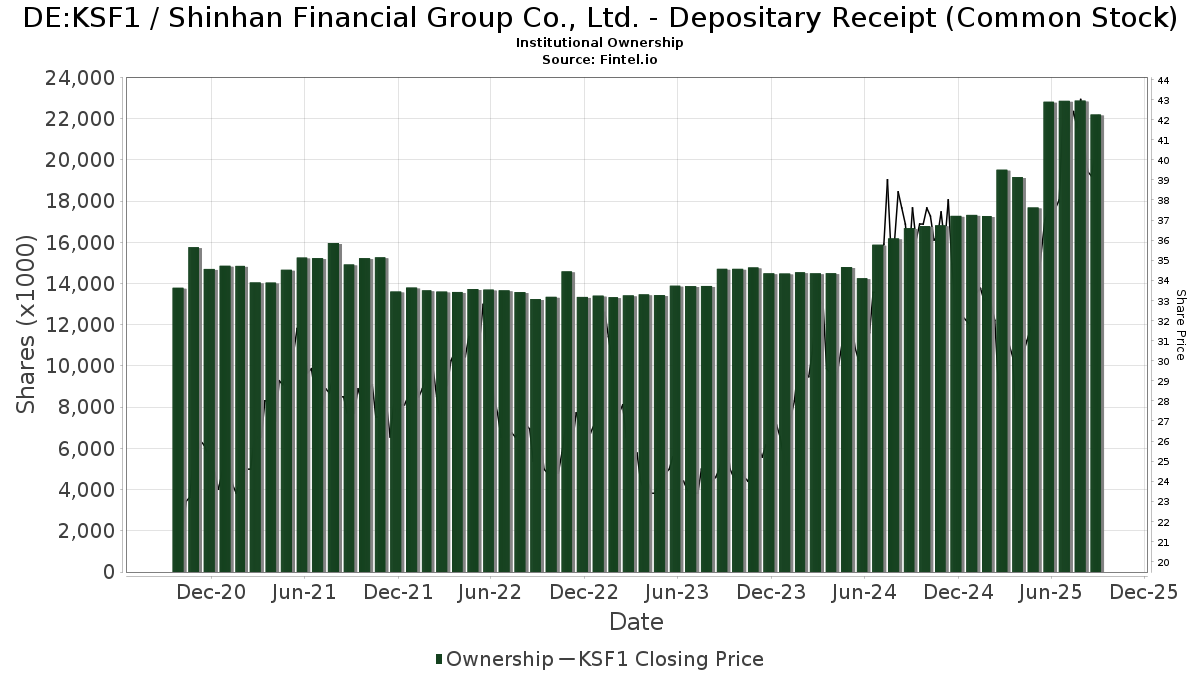
Shinhan Financial Group Co., Ltd. - Depositary Receipt (Common Stock) (DE:KSF1) har 290 institutionelle ejere og aktionærer, der har indsendt 13D/G- eller 13F-formularer til Securities Exchange Commission (SEC). Disse institutioner har i alt 23,436,481 aktier. Største aktionærer omfatter BlackRock, Inc., London & Capital Asset Management Ltd, Morgan Stanley, Lazard Asset Management Llc, Dimensional Fund Advisors Lp, Northern Trust Corp, American Century Companies Inc, Dimensional Emerging Markets Value Fund - Dimensional Emerging Markets Value Fund, Pzena Investment Management Llc, and Arrowstreet Capital, Limited Partnership .
Shinhan Financial Group Co., Ltd. - Depositary Receipt (Common Stock) (DB:KSF1) institutionel ejerskabsstruktur viser aktuelle positioner i virksomheden efter institutioner og fonde, samt seneste ændringer i positionsstørrelse. Større aktionærer kan omfatte individuelle investorer, investeringsforeninger, hedgefonde eller institutioner. Skema 13D angiver, at investoren besidder (eller besidder) mere end 5 % af virksomheden og har til hensigt (eller har til hensigt at) aktivt at forfølge en ændring i forretningsstrategi. Skema 13G indikerer en passiv investering på over 5%.
The share price as of March 12, 2026 is 51,00 / share. Previously, on March 18, 2025, the share price was 29,80 / share. This represents an increase of 71,14% over that period.
Fondens stemningsscore
Fund Sentiment Score (fka Ownership Accumulation Score) finder de aktier, der bliver mest købt af fonde. Det er resultatet af en sofistikeret, multi-faktor kvantitativ model, der identificerer virksomheder med de højeste niveauer af institutionel akkumulering. Scoringsmodellen bruger en kombination af den samlede stigning i oplyste ejere, ændringerne i porteføljeallokeringer i disse ejere og andre målinger. Tallet går fra 0 til 100, hvor højere tal indikerer et højere niveau af akkumulering for sine jævnaldrende, og 50 er gennemsnittet.
Opdateringsfrekvens: Dagligt
Se Ownership Explorer, som giver en liste over højest rangerende virksomheder.
AI+ Ask Fintel’s AI assistant about Shinhan Financial Group Co., Ltd. - Depositary Receipt (Common Stock).
Select a question to share a public post with an AI-crafted answer.
Thinking of good questions…
13F og NPORT arkivering
Detaljer om 13F-arkivering er gratis. Detaljer om NP-ansøgninger kræver et premium-medlemskab. Grønne rækker angiver nye positioner. Røde rækker angiver lukkede positioner. Klik på linket ikon for at se den fulde transaktionshistorik.
Opgrader
for at låse premium-data op og eksportere til Excel ![]() .
.
| Fil dato | Kilde | Investor | Type | Gennemsnitlig pris (Øst) |
Aktier | Δ Aktier (%) |
Rapporteret Værdi ($1000) |
Δ Værdi (%) |
Port Alloc (%) |
|
|---|---|---|---|---|---|---|---|---|---|---|
| 2026-02-17 | 13F | Millennium Management Llc | 203.703 | 107,81 | 10.925 | 121,27 | ||||
| 2026-02-13 | 13F | Cornerstone Financial Management LLC | 127 | 7 | ||||||
| 2026-02-14 | 13F | Rockefeller Capital Management L.P. | 2.657 | 273,70 | 143 | 305,71 | ||||
| 2026-01-27 | 13F | Evergreen Capital Management Llc | 6.769 | 0,00 | 363 | 6,76 | ||||
| 2026-02-06 | 13F | EverSource Wealth Advisors, LLC | 6.660 | -13,86 | 357 | -8,23 | ||||
| 2026-02-13 | 13F | Integrated Wealth Concepts LLC | 7.675 | 9,52 | 412 | 16,76 | ||||
| 2026-02-13 | 13F | Pathstone Holdings, LLC | 93.276 | 3,68 | 5.002 | 10,40 | ||||
| 2025-09-25 | NP | Dimensional Emerging Markets Value Fund - Dimensional Emerging Markets Value Fund This fund is a listed as child fund of Dimensional Fund Advisors Lp and if that institution has disclosed ownership in this security, then these positions will not be double counted when calculating total shares and total value | 946.989 | -1,37 | 46.118 | 33,50 | ||||
| 2026-02-13 | 13F | Stifel Financial Corp | 10.603 | 2,39 | 569 | 9,02 | ||||
| 2026-02-17 | 13F | Creative Planning | 230.578 | 21,36 | 12.366 | 29,22 | ||||
| 2026-02-03 | 13F | Sequoia Financial Advisors, LLC | 29.529 | 12,38 | 1.584 | 19,65 | ||||
| 2026-02-12 | 13F | Federated Hermes, Inc. | 622 | 3,84 | 33 | 10,00 | ||||
| 2025-11-06 | 13F | CIBC World Markets Inc. | 0 | -100,00 | 0 | -100,00 | ||||
| 2026-01-26 | 13F | Cwm, Llc | 3.609 | 4,43 | 0 | |||||
| 2026-02-17 | 13F | Voloridge Investment Management, Llc | 109.444 | -0,88 | 5.869 | 5,54 | ||||
| 2026-02-09 | 13F | Bleakley Financial Group, LLC | 17.682 | 5,94 | 948 | 12,86 | ||||
| 2026-02-12 | 13F | Bank Of Montreal /can/ | 7.247 | 70,32 | 389 | 81,31 | ||||
| 2026-02-13 | 13F | Flow Traders U.s. Llc | 9.974 | 1 | ||||||
| 2026-01-05 | 13F | Confluence Investment Management Llc | 5.671 | 0,00 | 304 | 6,67 | ||||
| 2026-02-03 | 13F | Mitsubishi UFJ Kokusai Asset Management Co., Ltd. | 3.953 | -2,27 | 214 | 4,93 | ||||
| 2026-02-17 | 13F | Aspen Grove Capital, LLC | 4.892 | -28,79 | 262 | -24,28 | ||||
| 2026-02-19 | 13F | Atomi Financial Group, Inc. | 16.281 | 5,80 | 873 | 12,65 | ||||
| 2025-10-22 | 13F | Geneos Wealth Management Inc. | 0 | -100,00 | 0 | |||||
| 2026-02-13 | 13F | Causeway Capital Management Llc | 579.796 | 2,44 | 31.094 | 9,07 | ||||
| 2026-02-09 | 13F | Huntington National Bank | 142 | -8,97 | 8 | 0,00 | ||||
| 2026-02-17 | 13F | Fmr Llc | 132.617 | 9,86 | 7.112 | 16,97 | ||||
| 2026-02-17 | 13F | Public Employees Retirement System Of Ohio | 38.001 | -23,30 | 2.038 | -18,36 | ||||
| 2026-02-05 | 13F | Bessemer Group Inc | 5.561 | 3,29 | 0 | |||||
| 2026-02-12 | 13F | Xponance, Inc. | 3.842 | 206 | ||||||
| 2026-02-09 | 13F | Mondrian Investment Partners LTD | 4.883 | 28,98 | 262 | 37,37 | ||||
| 2026-02-13 | 13F | Marshall Wace, Llp | 289.997 | 15.553 | ||||||
| 2026-02-13 | 13F | State Street Corp | 31.567 | -7,70 | 1.693 | -1,74 | ||||
| 2026-01-30 | 13F | North Star Investment Management Corp. | 92 | 5 | ||||||
| 2026-02-17 | 13F | Graham Capital Management, L.P. | 16.959 | 7,63 | 910 | 14,63 | ||||
| 2026-01-29 | 13F | UMA Financial Services, Inc. | 99 | 23,75 | 5 | 25,00 | ||||
| 2026-01-15 | 13F | Frank, Rimerman Advisors LLC | 24.212 | 95,99 | 1.298 | 108,68 | ||||
| 2026-02-03 | 13F | Virtus Family Office LLC | 96.373 | 7,72 | 5.169 | 14,69 | ||||
| 2025-11-12 | 13F | Montag A & Associates Inc | 0 | -100,00 | 0 | |||||
| 2026-01-26 | 13F | Private Trust Co Na | 174 | 23,40 | 9 | 28,57 | ||||
| 2026-02-13 | 13F | American Century Companies Inc | 1.232.480 | 13,09 | 66.098 | 20,41 | ||||
| 2026-02-13 | 13F | Pinnacle Wealth Planning Services, Inc. | 4.824 | 10,46 | 259 | 17,81 | ||||
| 2025-09-23 | NP | KTRAX - DWS Global Income Builder Fund Class A | 33.900 | 1.651 | ||||||
| 2026-02-12 | 13F | Dimensional Fund Advisors Lp | 1.516.094 | -1,27 | 81.308 | 5,12 | ||||
| 2026-02-13 | 13F | Parkside Financial Bank & Trust | 96 | 0,00 | 5 | 25,00 | ||||
| 2025-09-25 | NP | DEXC - Dimensional Emerging Markets ex China Core Equity ETF | 10.295 | 17,23 | 501 | 59,05 | ||||
| 2026-02-13 | 13F | Kilter Group LLC | 11 | 0,00 | 1 | |||||
| 2026-01-21 | 13F | Greenleaf Trust | 13.931 | 0,17 | 747 | 6,71 | ||||
| 2026-02-17 | 13F | Jones Financial Companies Lllp | 213 | 29,88 | 11 | 37,50 | ||||
| 2025-11-04 | 13F | Gitterman Wealth Management, LLC | 4.181 | 9,02 | 211 | 21,39 | ||||
| 2026-02-13 | 13F | Neuberger Berman Group LLC | 84.048 | 0,04 | 4.514 | 6,76 | ||||
| 2025-11-14 | 13F | AXA Investment Managers S.A. | 18.261 | 920 | ||||||
| 2026-01-27 | 13F | TD Waterhouse Canada Inc. | 0 | -100,00 | 0 | |||||
| 2026-02-03 | 13F | Crossmark Global Holdings, Inc. | 23.279 | -0,64 | 1.248 | 5,76 | ||||
| 2026-02-13 | 13F | National Bank Of Canada /fi/ | 5 | 0 | ||||||
| 2026-02-13 | 13F | Citigroup Inc | 71.262 | 131,69 | 3.822 | 146,68 | ||||
| 2026-02-10 | 13F | Sivia Capital Partners, LLC | 6.075 | -3,63 | 326 | 2,52 | ||||
| 2025-11-20 | 13F | Asset Dedication, LLC | 0 | -100,00 | 0 | -100,00 | ||||
| 2026-02-17 | 13F | Quantinno Capital Management LP | 123.284 | 27,67 | 6.612 | 35,92 | ||||
| 2026-02-17 | 13F | Advisor Group Holdings, Inc. | 5.637 | 252,09 | 302 | 277,50 | ||||
| 2025-11-14 | 13F | Squarepoint Ops LLC | 0 | -100,00 | 0 | |||||
| 2026-01-23 | 13F | Ritholtz Wealth Management | 76.894 | 2,67 | 4.124 | 9,31 | ||||
| 2025-10-30 | 13F | Twin Peaks Wealth Advisors, LLC | 0 | -100,00 | 0 | |||||
| 2025-11-07 | 13F | Sierra Ocean, Llc | 0 | -100,00 | 0 | -100,00 | ||||
| 2026-02-13 | 13F | MAI Capital Management | 711 | 0,00 | 17 | 6,67 | ||||
| 2026-02-13 | 13F | Morgan Stanley | 1.696.358 | -2,03 | 90.976 | 4,31 | ||||
| 2025-10-27 | 13F | First Horizon Corp | 0 | -100,00 | 0 | |||||
| 2026-02-10 | 13F | Goldman Sachs Group Inc | 205.842 | -40,05 | 11.039 | -36,16 | ||||
| 2026-02-11 | 13F | Clearbridge Investments, LLC | 110.531 | 0,36 | 5.928 | 6,85 | ||||
| 2026-01-15 | 13F | Trust Co | 9 | 0 | ||||||
| 2026-01-16 | 13F | Banque Pictet & Cie Sa | 8.645 | 464 | ||||||
| 2026-01-16 | 13F | Standard Life Aberdeen plc | 14.188 | 34,34 | 761 | 43,40 | ||||
| 2026-02-04 | 13F | D'Orazio & Associates, Inc. | 4.529 | 1,94 | 243 | 8,52 | ||||
| 2026-02-04 | 13F | Paradigm Asset Management Co Llc | 1.100 | 0,00 | 59 | 5,45 | ||||
| 2026-02-17 | 13F | Laird Norton Trust Company, Llc | 75.142 | 4.030 | ||||||
| 2026-02-19 | 13F | Invesco Ltd. | 29.117 | -9,64 | 1.562 | -3,82 | ||||
| 2026-01-29 | 13F | Concurrent Investment Advisors, LLC | 4.426 | 237 | ||||||
| 2026-02-17 | 13F | Jain Global LLC | 7.202 | -22,58 | 386 | -17,52 | ||||
| 2026-01-30 | 13F | Us Bancorp \de\ | 49.554 | 29,87 | 2.658 | 38,31 | ||||
| 2026-02-17 | 13F | Royal Bank Of Canada | 86.509 | -0,95 | 4.639 | 5,46 | ||||
| 2026-02-11 | 13F | IMA Wealth, Inc. | 39 | 2 | ||||||
| 2026-02-24 | 13F | Bell Investment Advisors, Inc | 569 | 81,79 | 31 | 100,00 | ||||
| 2026-02-13 | 13F | Sterling Capital Management LLC | 6.219 | 6,53 | 334 | 13,27 | ||||
| 2026-01-08 | 13F | Wealth Enhancement Advisory Services, Llc | 14.688 | 20,82 | 814 | 33,66 | ||||
| 2026-02-17 | 13F | Bank Of America Corp /de/ | 707.927 | 3,19 | 37.966 | 9,87 | ||||
| 2026-02-17 | 13F | Northern Trust Corp | 1.474.235 | -1,63 | 79.063 | 4,73 | ||||
| 2026-02-13 | 13F | SRS Capital Advisors, Inc. | 5.255 | 166,62 | 282 | 183,84 | ||||
| 2026-01-26 | 13F | PDS Planning, Inc | 14.905 | 6,87 | 799 | 13,82 | ||||
| 2026-02-05 | 13F | Abacus Wealth Partners, LLC | 19.183 | 1.029 | ||||||
| 2026-02-11 | 13F | Parallel Advisors, LLC | 14.435 | 3,25 | 774 | 9,94 | ||||
| 2026-02-13 | 13F | Atlas Capital Advisors Llc | 9.446 | 263,87 | 507 | 332,48 | ||||
| 2025-09-25 | NP | abrdn Funds - abrdn Emerging Markets Dividend Active ETF | 6.315 | -18,87 | 308 | 9,64 | ||||
| 2026-02-09 | 13F | Hantz Financial Services, Inc. | 5.664 | 36,25 | 0 | |||||
| 2026-02-11 | 13F | Syon Capital Llc | 4.269 | 229 | ||||||
| 2026-01-27 | 13F | Proffitt & Goodson Inc | 129 | 0,00 | 7 | 0,00 | ||||
| 2026-02-05 | 13F | High Note Wealth, LLC | 2 | 0,00 | 0 | |||||
| 2026-02-20 | 13F | Sunbelt Securities, Inc. | 19 | 0,00 | 1 | |||||
| 2025-09-25 | NP | VEU - Vanguard FTSE All-World ex-US Index Fund ETF Shares | 293.584 | -16,00 | 14.298 | 13,70 | ||||
| 2026-02-18 | 13F | Vident Advisory, LLC | 82.742 | -9,10 | 4.438 | -3,23 | ||||
| 2026-01-26 | 13F | JNBA Financial Advisors | 21 | 1 | ||||||
| 2025-09-25 | NP | HFIGX - Hartford Schroders Diversified Growth Fund Class I | 2.404 | -1,31 | 117 | 34,48 | ||||
| 2026-02-06 | 13F | Lsv Asset Management | 9.800 | 0,00 | 1 | |||||
| 2026-02-19 | 13F | CI Private Wealth, LLC | 22.909 | 8,15 | 1.229 | 15,20 | ||||
| 2026-02-13 | 13F | Ubs Asset Management Americas Inc | 1.179 | 63 | ||||||
| 2025-11-12 | 13F | Steward Partners Investment Advisory, Llc | 0 | -100,00 | 0 | |||||
| 2026-02-17 | 13F | Aquatic Capital Management LLC | 5.490 | -56,40 | 294 | -53,63 | ||||
| 2026-02-13 | 13F | Arrowstreet Capital, Limited Partnership | 894.817 | -17,75 | 47.989 | -12,43 | ||||
| 2026-01-21 | 13F | Aaron Wealth Advisors LLC | 7.850 | 14,72 | 421 | 22,09 | ||||
| 2026-02-12 | 13F | BlackRock, Inc. | 2.024.915 | 6,12 | 108.596 | 12,99 | ||||
| 2026-02-12 | 13F | Brown Brothers Harriman & Co | 481 | 71,17 | 26 | 78,57 | ||||
| 2026-02-13 | 13F | Van Eck Associates Corp | 1.047 | 0 | ||||||
| 2025-09-25 | NP | DFAE - Dimensional Emerging Core Equity Market ETF | 31.683 | 0,00 | 1.543 | 35,38 | ||||
| 2026-02-12 | 13F | Brinker Capital Investments, LLC | 72.569 | 3,98 | 3.892 | 10,70 | ||||
| 2026-02-17 | 13F | Hood River Capital Management LLC | 100 | 5 | ||||||
| 2026-02-17 | 13F | Wiley Bros.-aintree Capital, Llc | 6.798 | 15,47 | 366 | 23,31 | ||||
| 2026-02-11 | 13F | Rise Advisors, LLC | 0 | -100,00 | 0 | |||||
| 2026-02-13 | 13F | Rhumbline Advisers | 45.537 | -12,36 | 2.442 | -6,69 | ||||
| 2025-10-23 | 13F | SG Americas Securities, LLC | 0 | -100,00 | 0 | |||||
| 2026-02-05 | 13F | Elyxium Wealth, LLC | 74 | 4 | ||||||
| 2026-01-28 | 13F | HB Wealth Management, LLC | 6.324 | 10,52 | 339 | 17,71 | ||||
| 2026-02-13 | 13F | First Trust Advisors Lp | 16.527 | 27,66 | 886 | 35,89 | ||||
| 2026-01-29 | 13F | Vanguard Group Inc | 268.577 | 3,98 | 14.404 | 10,71 | ||||
| 2026-02-10 | 13F | Greenspring Advisors, LLC | 4.691 | 252 | ||||||
| 2026-02-12 | 13F | Federation des caisses Desjardins du Quebec | 22 | 1 | ||||||
| 2026-02-17 | 13F | Schonfeld Strategic Advisors LLC | 13.296 | -18,50 | 713 | -13,15 | ||||
| 2026-01-27 | 13F | Financial Management Professionals, Inc. | 22 | 0,00 | 1 | 0,00 | ||||
| 2026-02-27 | 13F | Groupama Asset Managment | 17.843 | 1,81 | 957 | 8,39 | ||||
| 2026-02-06 | 13F | Bare Financial Services, Inc | 230 | 0,00 | 12 | 9,09 | ||||
| 2026-02-10 | 13F | Quantbot Technologies LP | 5.199 | -35,23 | 279 | -31,19 | ||||
| 2026-01-30 | 13F | AMG National Trust Bank | 52.363 | -0,43 | 2.808 | 6,00 | ||||
| 2026-02-06 | 13F | Creative Financial Designs Inc /adv | 4 | 0,00 | 0 | |||||
| 2026-02-10 | 13F | Root Financial Partners, LLC | 10 | 1 | ||||||
| 2025-09-25 | NP | VT - Vanguard Total World Stock Index Fund ETF Shares | 0 | -100,00 | 0 | -100,00 | ||||
| 2026-01-22 | 13F | Venturi Wealth Management, LLC | 7.217 | 387 | ||||||
| 2026-02-13 | 13F | Walleye Capital LLC | 0 | -100,00 | 0 | |||||
| 2026-02-05 | 13F | Td Private Client Wealth Llc | 762 | -8,08 | 41 | -2,44 | ||||
| 2026-01-28 | 13F | B. Metzler seel. Sohn & Co. AG | 65.459 | -33,58 | 3.514 | -29,21 | ||||
| 2026-02-17 | 13F | United Capital Financial Advisers, Llc | 9.093 | 9,05 | 488 | 16,23 | ||||
| 2025-09-25 | NP | DFEV - Dimensional Emerging Markets Value ETF | 18.359 | 0,00 | 894 | 35,45 | ||||
| 2026-02-10 | 13F | Savant Capital, LLC | 5.542 | 9,68 | 297 | 16,93 | ||||
| 2025-09-25 | NP | DFAX - Dimensional World ex U.S. Core Equity 2 ETF | 18.632 | -1,93 | 907 | 32,80 | ||||
| 2026-02-10 | 13F/A | Northwestern Mutual Wealth Management Co | 972 | 2,64 | 52 | 10,64 | ||||
| 2025-11-14 | 13F | Binnacle Investments Inc | 327 | 0,00 | 16 | 14,29 | ||||
| 2026-02-17 | 13F | Wellington Management Group Llp | 223.175 | -11,48 | 11.969 | -5,75 | ||||
| 2025-11-13 | 13F | Glenmede Investment Management, LP | 5.232 | 0,67 | 264 | 12,39 | ||||
| 2026-02-11 | 13F | Vise Technologies, Inc. | 27.735 | -3,60 | 1.487 | 2,62 | ||||
| 2026-01-26 | 13F | Merit Financial Group, LLC | 4.890 | 5,39 | 262 | 12,45 | ||||
| 2026-02-17 | 13F | XTX Topco Ltd | 7.002 | 376 | ||||||
| 2026-01-09 | 13F | Park Place Capital Corp | 434 | 104,72 | 23 | 130,00 | ||||
| 2026-02-02 | 13F | Advisors Preferred, LLC | 8.743 | -16,26 | 472 | -10,44 | ||||
| 2026-02-09 | 13F | Key FInancial Inc | 149 | 0,00 | 8 | 0,00 | ||||
| 2026-02-18 | 13F | GWM Advisors LLC | 0 | -100,00 | 0 | |||||
| 2026-01-23 | 13F | Bridgewater Advisors Inc. | 9.438 | 2,15 | 541 | 6,30 | ||||
| 2026-01-15 | 13F | Nisa Investment Advisors, Llc | 610 | 33 | ||||||
| 2026-02-11 | 13F | West Family Investments, Inc. | 8.568 | -6,63 | 460 | -0,65 | ||||
| 2026-01-15 | 13F | Highline Wealth Partners Llc | 178 | 0,00 | 10 | 12,50 | ||||
| 2026-01-23 | 13F | Rsm Us Wealth Management Llc | 4.086 | 2,25 | 220 | 8,96 | ||||
| 2025-11-13 | 13F | Riggs Asset Managment Co. Inc. | 0 | -100,00 | 0 | |||||
| 2026-02-11 | 13F | O'shaughnessy Asset Management, Llc | 194.096 | 11,63 | 10.409 | 18,85 | ||||
| 2026-02-12 | 13F | Callan Family Office, LLC | 20.060 | 278,28 | 1.076 | 302,62 | ||||
| 2026-02-12 | 13F | Hm Payson & Co | 440 | 0,00 | 24 | 4,55 | ||||
| 2026-01-05 | 13F | Park Avenue Securities Llc | 5.284 | 9,76 | 0 | |||||
| 2026-01-16 | 13F | Crewe Advisors LLC | 335 | 0,00 | 18 | 6,25 | ||||
| 2026-02-06 | 13F | Vestmark Advisory Solutions, Inc. | 43.069 | 617,22 | 2.310 | 664,57 | ||||
| 2026-02-17 | 13F | Cetera Investment Advisers | 6.000 | 26,69 | 322 | 34,87 | ||||
| 2026-02-17 | 13F | Ancora Advisors, LLC | 21 | 1 | ||||||
| 2026-02-17 | 13F | Nomura Holdings Inc | 0 | -100,00 | 0 | -100,00 | ||||
| 2026-02-11 | 13F | Ramirez Asset Management, Inc. | 222.752 | 11.946 | ||||||
| 2026-02-13 | 13F | Sei Investments Co | 154.268 | 4,79 | 8.274 | 11,58 | ||||
| 2026-02-17 | 13F | Susquehanna International Group, Llp | 0 | -100,00 | 0 | |||||
| 2026-02-05 | 13F | Atria Investments Llc | 13.049 | 6,23 | 700 | 13,11 | ||||
| 2026-02-02 | 13F | Strs Ohio | 16.271 | -14,84 | 873 | -9,36 | ||||
| 2025-11-14 | 13F | Cubist Systematic Strategies, LLC | 80.858 | 24,65 | 4.073 | 38,98 | ||||
| 2026-01-29 | 13F | Aprio Wealth Management, LLC | 17.783 | 0,68 | 954 | 7,20 | ||||
| 2025-10-28 | 13F | Arlington Trust Co LLC | 0 | -100,00 | 0 | |||||
| 2025-11-12 | 13F | Maseco Llp | 0 | -100,00 | 0 | -100,00 | ||||
| 2026-01-29 | 13F | Nbc Securities, Inc. | 21 | 0,00 | 1 | 0,00 | ||||
| 2026-02-10 | 13F | Connor, Clark & Lunn Investment Management Ltd. | 289.063 | -29,39 | 15.502 | -24,82 | ||||
| 2026-02-10 | 13F | Bnp Paribas Arbitrage, Sa | 59.139 | -32,35 | 3.172 | -27,98 | ||||
| 2026-02-17 | 13F | D. E. Shaw & Co., Inc. | 34.972 | -75,93 | 1.876 | -74,38 | ||||
| 2026-02-10 | 13F | Natixis Advisors, L.p. | 45.736 | -49,55 | 2 | -50,00 | ||||
| 2026-02-17 | 13F | Quadrature Capital Ltd | 0 | -100,00 | 0 | |||||
| 2025-11-06 | 13F | Whipplewood Advisors, LLC | 0 | -100,00 | 0 | |||||
| 2025-11-04 | 13F | Umb Bank N A/mo | 0 | -100,00 | 0 | |||||
| 2026-01-30 | 13F | ARGA Investment Management, LP | 5.107 | -62,80 | 274 | -60,49 | ||||
| 2026-02-17 | 13F | Grantham, Mayo, Van Otterloo & Co. LLC | 26.205 | -12,30 | 1.405 | -6,64 | ||||
| 2026-02-17 | 13F | Citadel Advisors Llc | 48.437 | -42,57 | 2.598 | -38,87 | ||||
| 2026-01-29 | 13F | Sanctuary Advisors, LLC | 9.784 | 9,50 | 525 | 16,44 | ||||
| 2026-02-06 | 13F | Global Retirement Partners, LLC | 12.193 | 52,28 | 654 | 62,03 | ||||
| 2026-02-17 | 13F | Citadel Advisors Llc | Call | 4.600 | 247 | |||||
| 2026-01-14 | 13F | Spire Wealth Management | 443 | 182,17 | 24 | 228,57 | ||||
| 2025-10-31 | 13F | Cullen/frost Bankers, Inc. | 0 | -100,00 | 0 | -100,00 | ||||
| 2026-02-17 | 13F | Trexquant Investment LP | 6.376 | -87,99 | 342 | -87,25 | ||||
| 2026-01-30 | 13F | Catalytic Wealth RIA, LLC | 7.149 | 37,93 | 383 | 46,74 | ||||
| 2026-02-12 | 13F | Quadrant Capital Group Llc | 72.088 | 47,08 | 3.866 | 56,65 | ||||
| 2026-02-17 | 13F | Mercer Global Advisors Inc /adv | 8.516 | 5,16 | 457 | 12,04 | ||||
| 2026-01-16 | 13F | Augustine Asset Management Inc | 6.362 | 0,00 | 341 | 6,56 | ||||
| 2026-02-17 | 13F | Warren Averett Asset Management, LLC | 4.558 | 244 | ||||||
| 2026-02-13 | 13F | Mml Investors Services, Llc | 8.848 | 46,81 | 475 | 56,44 | ||||
| 2026-02-05 | 13F | Allworth Financial LP | 1.703 | 12,48 | 91 | 19,74 | ||||
| 2026-01-16 | 13F | Perigon Wealth Management, LLC | 4.813 | 258 | ||||||
| 2026-02-11 | 13F | Jpmorgan Chase & Co | 163.354 | -39,38 | 8.761 | -35,46 | ||||
| 2026-02-12 | 13F | Investment Research Partners LLC | 14.233 | -1,06 | 763 | 0,79 | ||||
| 2026-01-23 | 13F | Natural Investments, Llc | 28.874 | 0,75 | 2 | 0,00 | ||||
| 2026-02-17 | 13F | CWM Advisors, LLC | 1.654 | 89 | ||||||
| 2026-02-17 | 13F | Engineers Gate Manager LP | 4.985 | -41,99 | 267 | -38,19 | ||||
| 2026-02-13 | 13F | JustInvest LLC | 92.413 | 13,91 | 4.956 | 21,29 | ||||
| 2026-02-17 | 13F | Point72 Asset Management, L.P. | 109.417 | 5.868 | ||||||
| 2026-02-13 | 13F | Schroder Investment Management Group | 45.586 | 5,83 | 2.454 | 13,30 | ||||
| 2025-10-24 | 13F | Pinnacle Bancorp, Inc. | 0 | -100,00 | 0 | -100,00 | ||||
| 2026-02-02 | 13F | Oppenheimer Asset Management Inc. | 23.225 | 7,15 | 1.246 | 14,12 | ||||
| 2026-02-17 | 13F | Qube Research & Technologies Ltd | 27.405 | -64,46 | 1.470 | -62,17 | ||||
| 2025-11-14 | 13F | Wetherby Asset Management Inc | 46.440 | -1,34 | 2.339 | 10,02 | ||||
| 2026-02-13 | 13F | Resources Investment Advisors, LLC. | 8.122 | -11,85 | 436 | -6,25 | ||||
| 2026-02-13 | 13F | PCM Encore, LLC | 24.962 | 1.339 | ||||||
| 2026-01-28 | 13F | CAPROCK Group, Inc. | 6.438 | 13,65 | 345 | 28,25 | ||||
| 2026-02-06 | 13F | Pnc Financial Services Group, Inc. | 27.994 | 12,26 | 1.501 | 19,51 | ||||
| 2026-01-12 | 13F | Legacy Wealth Asset Management, LLC | 17.950 | 0,13 | 963 | 6,65 | ||||
| 2026-02-11 | 13F | LPL Financial LLC | 39.246 | 5,03 | 2.105 | 11,80 | ||||
| 2026-02-17 | 13F | Tower Research Capital LLC (TRC) | 5.708 | -33,20 | 306 | -28,84 | ||||
| 2026-01-29 | 13F | Calamos Advisors LLC | 28.332 | -0,25 | 1.519 | 6,22 | ||||
| 2025-09-26 | NP | UUPIX - Ultraemerging Markets Profund Investor Class | 2.421 | 24,35 | 118 | 67,14 | ||||
| 2026-01-27 | 13F | WealthCollab, LLC | 1.372 | 2,24 | 74 | 8,96 | ||||
| 2026-02-13 | 13F | Maverick Capital Ltd | 14.071 | 755 | ||||||
| 2026-02-17 | 13F | Aqr Capital Management Llc | 17.110 | 60,19 | 918 | 70,45 | ||||
| 2026-02-17 | 13F | Voleon Capital Management Lp | 134.357 | 128,53 | 7.206 | 143,33 | ||||
| 2026-02-24 | 13F | DGS Capital Management, LLC | 30.256 | 5,94 | 1.623 | 12,80 | ||||
| 2026-01-28 | 13F | WPG Advisers, LLC | 66 | 4,76 | 4 | 0,00 | ||||
| 2026-02-13 | 13F | Ariadne Wealth Management, LP | 6.752 | -0,56 | 471 | 27,64 | ||||
| 2025-09-25 | NP | WRAAX - Wilmington Global Alpha Equities Fund Class A Shares | 6.002 | -10,27 | 292 | 21,67 | ||||
| 2025-09-24 | NP | SNTKX - Steward International Enhanced Index Fund Class A | 10.365 | -45,92 | 505 | -39,28 | ||||
| 2026-01-30 | 13F | Ares Financial Consulting, LLC | 35 | 2 | ||||||
| 2026-02-12 | 13F | Johnson Financial Group, Inc. | 0 | -100,00 | 0 | |||||
| 2025-09-25 | NP | DFCEX - Emerging Markets Core Equity Portfolio - Institutional Class This fund is a listed as child fund of Dimensional Fund Advisors Lp and if that institution has disclosed ownership in this security, then these positions will not be double counted when calculating total shares and total value | 269.770 | 0,00 | 13.138 | 35,35 | ||||
| 2026-02-17 | 13F | London & Capital Asset Management Ltd | 2.012.715 | 107.882 | ||||||
| 2026-02-13 | 13F | Ieq Capital, Llc | 42.139 | 23,29 | 2.260 | 31,26 | ||||
| 2026-02-11 | 13F | Franklin Resources Inc | 6.240 | 0,08 | 335 | 6,37 | ||||
| 2026-02-17 | 13F | Shelton Capital Management | 11.735 | 0,00 | 629 | 6,43 | ||||
| 2026-01-22 | 13F | Financial Consulate, Inc | 42 | 2 | ||||||
| 2026-02-20 | 13F | Kovitz Investment Group Partners, LLC | 0 | -100,00 | 0 | |||||
| 2026-02-13 | 13F | Dynamic Technology Lab Private Ltd | 7.012 | 376 | ||||||
| 2025-09-25 | NP | DFEM - Dimensional Emerging Markets Core Equity 2 ETF | 51.201 | -5,93 | 2.493 | 27,32 | ||||
| 2026-02-03 | 13F | Ballentine Partners, LLC | 27.141 | 5,10 | 1.456 | 11,92 | ||||
| 2026-02-04 | 13F | Drive Wealth Management, Llc | 4.642 | 3,32 | 249 | 9,73 | ||||
| 2026-02-03 | 13F | NewEdge Wealth, LLC | 92.609 | 3,83 | 4.967 | 5,21 | ||||
| 2026-02-09 | 13F | Harbour Investments, Inc. | 71 | 0,00 | 4 | 0,00 | ||||
| 2026-02-17 | 13F | Lazard Asset Management Llc | 1.671.184 | 5,99 | 89.626 | 12,85 | ||||
| 2026-02-17 | 13F | EFG International AG | 35.300 | 1.893 | ||||||
| 2026-02-11 | 13F | Capital Research Global Investors | 71.133 | 3.829 | ||||||
| 2026-02-06 | 13F | HighTower Advisors, LLC | 7.961 | 16,99 | 427 | 24,56 | ||||
| 2026-02-02 | 13F | Qrg Capital Management, Inc. | 16.879 | 20,00 | 905 | 27,82 | ||||
| 2025-10-21 | 13F | Simon Quick Advisors, Llc | 0 | -100,00 | 0 | -100,00 | ||||
| 2026-01-05 | 13F | GAMMA Investing LLC | 3.812 | 10,75 | 204 | 17,92 | ||||
| 2026-02-13 | 13F | Wells Fargo & Company/mn | 111.688 | 8,29 | 5.990 | 15,28 | ||||
| 2026-01-16 | 13F | Empirical Financial Services, LLC d.b.a. Empirical Wealth Management | 6.236 | 334 | ||||||
| 2026-01-29 | 13F | UBS Group AG | 151.613 | 129,14 | 8.131 | 144,03 | ||||
| 2026-01-23 | 13F | Westside Investment Management, Inc. | 2.125 | 3,06 | 115 | 9,62 | ||||
| 2025-09-25 | NP | JETIX - abrdn Global Equity Impact Fund Institutional Class | 23.550 | 4,82 | 1.147 | 41,83 | ||||
| 2025-09-25 | NP | DFSE - Dimensional Emerging Markets Sustainability Core 1 ETF | 2.715 | 0,00 | 132 | 36,08 | ||||
| 2026-02-12 | 13F | Skopos Labs, Inc. | 9.223 | 112,76 | 501 | 129,36 | ||||
| 2026-01-15 | 13F | Boston Common Asset Management, LLC | 5.065 | 0,00 | 272 | 6,27 | ||||
| 2026-02-13 | 13F | Mariner, LLC | 42.792 | 13,14 | 2.297 | 20,58 | ||||
| 2026-02-11 | 13F | Deutsche Bank Ag\ | 56.577 | 40,27 | 3.034 | 49,38 | ||||
| 2026-02-17 | 13F | GeoWealth Management, LLC | 8.584 | 30,42 | 460 | 38,97 | ||||
| 2025-11-14 | 13F | Axa S.a. | 0 | -100,00 | 0 | |||||
| 2026-02-03 | 13F | SBI Securities Co., Ltd. | 202 | -0,98 | 11 | 0,00 | ||||
| 2026-01-08 | 13F | Tuttle Tactical Management LLC | 6.073 | 326 | ||||||
| 2026-02-13 | 13F | Barclays Plc | 5.592 | 429,55 | 300 | 464,15 | ||||
| 2026-01-28 | 13F | DekaBank Deutsche Girozentrale | 11.779 | 0,00 | 0 | |||||
| 2026-02-17 | 13F | Glenmede Trust Co Na | 5.391 | 289 | ||||||
| 2026-01-28 | 13F | Oversea-Chinese Banking CORP Ltd | 22.016 | 8,92 | 1.181 | 15,91 | ||||
| 2026-02-17 | 13F | Advisory Services Network, LLC | 0 | -100,00 | 0 | |||||
| 2025-10-23 | 13F | Hosking Partners LLP | 0 | -100,00 | 0 | |||||
| 2026-02-12 | 13F | Rossby Financial, LCC | 36 | 2 | ||||||
| 2026-01-12 | 13F | Abound Wealth Management | 28 | 40,00 | 2 | 0,00 | ||||
| 2026-02-13 | 13F | Sanders Capital, LLC | 157.486 | -2,66 | 8.446 | 3,63 | ||||
| 2026-01-30 | 13F/A | M&t Bank Corp | 5.027 | 270 | ||||||
| 2026-02-06 | 13F | IFP Advisors, Inc | 13 | -38,10 | 1 | -100,00 | ||||
| 2026-02-11 | 13F | Brandes Investment Partners, Lp | 61.268 | -1,26 | 3.286 | 5,12 | ||||
| 2026-02-17 | 13F | Two Sigma Investments, Lp | 272.390 | 31,25 | 14.608 | 39,75 | ||||
| 2026-02-10 | 13F | Acadian Asset Management Llc | 157.390 | -6,78 | 8 | 0,00 | ||||
| 2026-02-17 | 13F | Russell Investments Group, Ltd. | 31.696 | -0,89 | 1.700 | 5,59 | ||||
| 2026-02-17 | 13F | Two Sigma Advisers, Lp | 68.400 | -7,82 | 3.668 | -1,85 | ||||
| 2026-02-13 | 13F | Transamerica Financial Advisors, Inc. | 11 | 1 | ||||||
| 2026-01-14 | 13F | Jfs Wealth Advisors, Llc | 613 | 0,00 | 33 | 6,67 | ||||
| 2026-02-02 | 13F | CENTRAL TRUST Co | 1 | -96,67 | 0 | -100,00 | ||||
| 2026-01-23 | 13F | Assetmark, Inc | 3.492 | 6,30 | 187 | 13,33 | ||||
| 2026-02-13 | 13F | Kestra Advisory Services, LLC | 705 | 38 | ||||||
| 2026-02-12 | 13F | Canopy Partners, LLC | 4.906 | 1,97 | 263 | 8,68 | ||||
| 2026-01-22 | 13F | Massachusetts Financial Services Co /ma/ | 7.319 | 393 | ||||||
| 2026-02-06 | 13F | Pzena Investment Management Llc | 911.788 | -4,30 | 48.899 | 1,89 | ||||
| 2026-02-13 | 13F | Smartleaf Asset Management LLC | 2.496 | 32,27 | 134 | 42,55 | ||||
| 2026-02-17 | 13F | Raymond James Financial Inc | 42.606 | 58,80 | 2.285 | 69,06 | ||||
| 2026-01-12 | 13F | Foster Group, Inc. | 4.556 | 2,41 | 244 | 8,93 | ||||
| 2026-02-13 | 13F | Arkadios Wealth Advisors | 5.601 | 17,57 | 300 | 25,52 | ||||
| 2026-02-05 | 13F | Gabelli Funds Llc | 43.976 | 6,87 | 2.358 | 13,80 | ||||
| 2026-02-13 | 13F | Colony Group, LLC | 8.181 | 439 | ||||||
| 2026-01-08 | 13F | True Wealth Design, LLC | 74 | 64,44 | 4 | 50,00 | ||||
| 2026-01-16 | 13F | Ronald Blue Trust, Inc. | 29.463 | -6,37 | 1.580 | -0,25 | ||||
| 2025-11-12 | 13F | Ranmore Fund Management Ltd | 0 | -100,00 | 0 | -100,00 | ||||
| 2026-02-04 | 13F | Argos Wealth Advisors, LLC | 4.336 | 233 | ||||||
| 2026-01-21 | 13F | Yousif Capital Management, Llc | 39.451 | 0,00 | 2.195 | 10,47 | ||||
| 2026-02-09 | 13F | Coldstream Capital Management Inc | 0 | -100,00 | 0 | |||||
| 2026-02-13 | 13F | Verition Fund Management LLC | 25.542 | -0,31 | 1.370 | 6,12 | ||||
| 2025-11-07 | 13F | Fifth Third Bancorp | 0 | -100,00 | 0 | |||||
| 2025-11-14 | 13F | Balyasny Asset Management Llc | 0 | -100,00 | 0 | -100,00 | ||||
| 2026-02-10 | 13F | Bank of New York Mellon Corp | 13.406 | 38,43 | 719 | 47,43 | ||||
| 2026-02-12 | 13F | Arbiter Partners Capital Management LLC | 138.169 | 0,73 | 7.410 | 7,25 | ||||
| 2025-11-13 | 13F | Guggenheim Capital Llc | 0 | -100,00 | 0 | -100,00 | ||||
| 2026-02-10 | 13F | Envestnet Asset Management Inc | 216.862 | 0,04 | 11.630 | 6,51 | ||||
| 2026-02-12 | 13F | Principal Securities, Inc. | 0 | -100,00 | 0 | -100,00 | ||||
| 2026-02-18 | 13F | Beacon Pointe Advisors, LLC | 10.080 | 0,80 | 4 | |||||
| 2026-03-04 | 13F | Rehmann Capital Advisory Group | 4.444 | 9,43 | 238 | 16,67 | ||||
| 2026-02-06 | 13F | Larson Financial Group LLC | 158 | 2.533,33 | 8 | |||||
| 2026-02-12 | 13F | Jane Street Group, Llc | 0 | -100,00 | 0 | |||||
| 2025-09-25 | NP | Dfa Investment Trust Co - The Emerging Markets Series This fund is a listed as child fund of Dimensional Fund Advisors Lp and if that institution has disclosed ownership in this security, then these positions will not be double counted when calculating total shares and total value | 27.159 | -22,08 | 1.323 | 5,42 | ||||
| 2026-02-17 | 13F | SageView Advisory Group, LLC | 406 | -76,45 | 22 | -98,40 | ||||
| 2026-02-12 | 13F | Renaissance Technologies Llc | 70.800 | -25,40 | 3.797 | -20,56 | ||||
| 2026-02-12 | 13F | CIBC Private Wealth Group, LLC | 186 | 10,71 | 10 | 12,50 | ||||
| 2025-10-31 | 13F | Whittier Trust Co | 0 | -100,00 | 0 | -100,00 | ||||
| 2026-02-13 | 13F | Golden State Wealth Management, LLC | 0 | -100,00 | 0 | |||||
| 2026-01-12 | 13F | Kozak & Associates, Inc. | 69 | 0,00 | 4 | 0,00 | ||||
| 2026-02-12 | 13F | BRYN MAWR TRUST Co | 0 | -100,00 | 0 | -100,00 | ||||
| 2026-03-03 | 13F/A | Caitong International Asset Management Co., Ltd | 329 | 2.430,77 | 18 | |||||
| 2026-02-03 | 13F | Ethic Inc. | 32.359 | 2,96 | 1.735 | 9,60 | ||||
| 2026-02-13 | 13F | Promethos Capital, LLC | 201.026 | -13,10 | 10.781 | 2,62 | ||||
| 2025-11-12 | 13F | NewSquare Capital LLC | 0 | -100,00 | 0 | -100,00 | ||||
| 2026-01-20 | 13F | Signaturefd, Llc | 28.018 | 0,94 | 1.503 | 7,44 | ||||
| 2026-02-06 | 13F | Profund Advisors Llc | 10.863 | -6,25 | 583 | -0,17 | ||||
| 2026-02-13 | 13F | Y-Intercept (Hong Kong) Ltd | 32.812 | 1.760 | ||||||
| 2026-02-06 | 13F | Plan A Wealth LLC | 15.058 | 3,05 | 808 | 9,65 | ||||
| 2026-02-11 | 13F | Cerity Partners LLC | 41.432 | -2,53 | 2.222 | 3,74 | ||||
| 2026-01-23 | 13F | Farther Finance Advisors, LLC | 4.657 | 106,52 | 250 | 120,35 | ||||
| 2026-02-17 | 13F | Ameriprise Financial Inc | 9.189 | 3,63 | 493 | 10,31 |
Other Listings
| US:SHG | 61,20 $ |