Grundlæggende statistik
| Institutionelle aktier (lange) | 13.106.437 - 55,77% (ex 13D/G) - change of -2,25MM shares -14,67% MRQ |
| Institutionel værdi (lang) | $ 637.514 USD ($1000) |
Institutionelt ejerskab og aktionærer
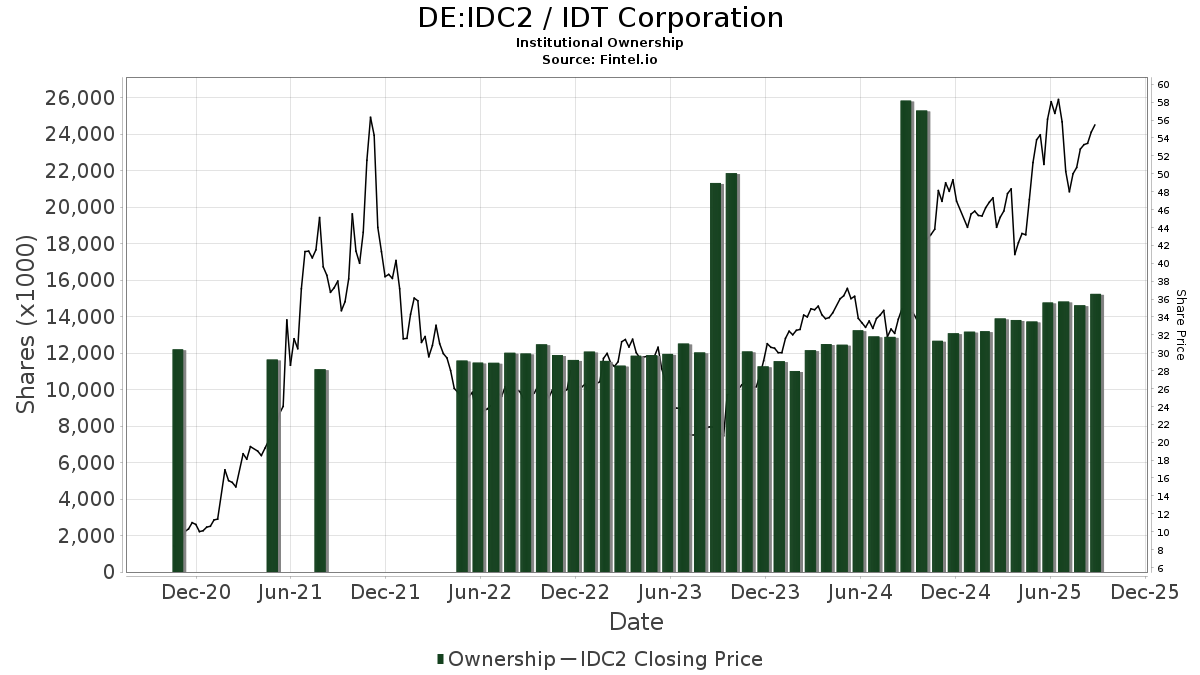
IDT Corporation (DE:IDC2) har 200 institutionelle ejere og aktionærer, der har indsendt 13D/G- eller 13F-formularer til Securities Exchange Commission (SEC). Disse institutioner har i alt 13,106,437 aktier. Største aktionærer omfatter BlackRock, Inc., Vanguard Group Inc, Renaissance Technologies Llc, Dimensional Fund Advisors Lp, Geode Capital Management, Llc, State Street Corp, Kahn Brothers Group Inc /de/, Cooke & Bieler Lp, Deutsche Bank Ag\, and Charles Schwab Investment Management Inc .
IDT Corporation (DB:IDC2) institutionel ejerskabsstruktur viser aktuelle positioner i virksomheden efter institutioner og fonde, samt seneste ændringer i positionsstørrelse. Større aktionærer kan omfatte individuelle investorer, investeringsforeninger, hedgefonde eller institutioner. Skema 13D angiver, at investoren besidder (eller besidder) mere end 5 % af virksomheden og har til hensigt (eller har til hensigt at) aktivt at forfølge en ændring i forretningsstrategi. Skema 13G indikerer en passiv investering på over 5%.
The share price as of April 24, 2026 is 43,56 / share. Previously, on April 28, 2025, the share price was 42,28 / share. This represents an increase of 3,03% over that period.
Fondens stemningsscore
Fund Sentiment Score (fka Ownership Accumulation Score) finder de aktier, der bliver mest købt af fonde. Det er resultatet af en sofistikeret, multi-faktor kvantitativ model, der identificerer virksomheder med de højeste niveauer af institutionel akkumulering. Scoringsmodellen bruger en kombination af den samlede stigning i oplyste ejere, ændringerne i porteføljeallokeringer i disse ejere og andre målinger. Tallet går fra 0 til 100, hvor højere tal indikerer et højere niveau af akkumulering for sine jævnaldrende, og 50 er gennemsnittet.
Opdateringsfrekvens: Dagligt
Se Ownership Explorer, som giver en liste over højest rangerende virksomheder.
AI+ Ask Fintel’s AI assistant about IDT Corporation.
Select a question to share a public post with an AI-crafted answer.
Thinking of good questions…
13F og NPORT arkivering
Detaljer om 13F-arkivering er gratis. Detaljer om NP-ansøgninger kræver et premium-medlemskab. Grønne rækker angiver nye positioner. Røde rækker angiver lukkede positioner. Klik på linket ikon for at se den fulde transaktionshistorik.
Opgrader
for at låse premium-data op og eksportere til Excel ![]() .
.
| Fil dato | Kilde | Investor | Type | Gennemsnitlig pris (Øst) |
Aktier | Δ Aktier (%) |
Rapporteret Værdi ($1000) |
Δ Værdi (%) |
Port Alloc (%) |
|
|---|---|---|---|---|---|---|---|---|---|---|
| 2025-11-14 | 13F | Alta Fox Capital Management, Llc | 0 | -100,00 | 0 | -100,00 | ||||
| 2026-01-26 | 13F | Cwm, Llc | 1.475 | -32,59 | 0 | |||||
| 2026-02-12 | 13F | Principal Securities, Inc. | 0 | -100,00 | 0 | -100,00 | ||||
| 2026-02-17 | 13F | XTX Topco Ltd | 0 | -100,00 | 0 | |||||
| 2026-02-13 | 13F | Parkside Financial Bank & Trust | 10 | 0,00 | 1 | |||||
| 2026-02-13 | 13F | Pinnacle Wealth Planning Services, Inc. | 14 | 1 | ||||||
| 2026-02-17 | 13F | PDT Partners, LLC | 23.134 | -27,46 | 1.185 | -29,02 | ||||
| 2026-04-15 | 13F | Merit Financial Group, LLC | 4.888 | 3,78 | 240 | -0,41 | ||||
| 2026-02-11 | 13F | Cerity Partners LLC | 142.191 | -2,07 | 7.282 | -4,13 | ||||
| 2026-02-12 | 13F | Aviva Plc | 9.639 | 26,90 | 494 | 24,18 | ||||
| 2026-02-17 | 13F | Lazard Asset Management Llc | 89.370 | 22,69 | 4.577 | 20,10 | ||||
| 2026-02-06 | 13F | Covestor Ltd | 135 | -0,74 | 0 | |||||
| 2026-02-17 | 13F | Engineers Gate Manager LP | 16.343 | -46,42 | 837 | -47,59 | ||||
| 2026-02-06 | 13F | EverSource Wealth Advisors, LLC | 10 | -82,46 | 1 | -100,00 | ||||
| 2026-02-13 | 13F | Quarry LP | 281 | -83,04 | 14 | -83,72 | ||||
| 2026-02-13 | 13F | State Street Corp | 489.236 | -7,80 | 25.054 | -9,85 | ||||
| 2026-02-10 | 13F | Acadian Asset Management Llc | 205.622 | -47,76 | 11 | -50,00 | ||||
| 2026-02-13 | 13F | Great West Life Assurance Co /can/ | 2.099 | 0,00 | 0 | |||||
| 2026-02-11 | 13F | Parallel Advisors, LLC | 718 | -6,14 | 37 | -10,00 | ||||
| 2026-02-09 | 13F | Employees Retirement System of Texas | 0 | -100,00 | 0 | |||||
| 2025-11-18 | 13F | Pictet Asset Management Holding SA | 0 | -100,00 | 0 | |||||
| 2026-04-13 | 13F | Hm Payson & Co | 2.950 | 0,00 | 145 | -4,64 | ||||
| 2026-04-22 | 13F | Advocate Investing Services LLC | 3.699 | 0,00 | 182 | -4,23 | ||||
| 2026-02-12 | 13F | State Board Of Administration Of Florida Retirement System | 4.332 | -82,47 | 222 | -82,89 | ||||
| 2026-02-13 | 13F | Sei Investments Co | 12.097 | -36,54 | 619 | -37,91 | ||||
| 2025-10-30 | 13F | Ridgewood Investments LLC | 0 | -100,00 | 0 | |||||
| 2025-11-06 | 13F | ProShare Advisors LLC | 0 | -100,00 | 0 | -100,00 | ||||
| 2026-02-17 | 13F | Aquatic Capital Management LLC | 4.495 | 230 | ||||||
| 2025-11-21 | 13F | Nebula Research & Development LLC | 0 | -100,00 | 0 | -100,00 | ||||
| 2026-02-17 | 13F | Emmett Investment Management, LP | 25.529 | -44,99 | 1.291 | -45,06 | ||||
| 2026-01-28 | 13F | Arizona State Retirement System | 5.869 | -6,84 | 301 | -8,81 | ||||
| 2026-04-24 | 13F | Root Financial Partners, LLC | 28 | 1 | ||||||
| 2026-02-17 | 13F | Optiver Holding B.V. | 14 | -81,58 | 1 | -100,00 | ||||
| 2026-01-30 | 13F | Us Bancorp \de\ | 428 | -0,47 | 22 | -4,55 | ||||
| 2026-02-11 | 13F | CSM Advisors, LLC | 103.950 | 107,42 | 5 | 150,00 | ||||
| 2026-02-17 | 13F | Millennium Management Llc | 274.623 | -13,29 | 14.063 | -15,11 | ||||
| 2026-02-13 | 13F | Police & Firemen's Retirement System of New Jersey | 4.500 | 0,00 | 230 | -2,13 | ||||
| 2026-02-17 | 13F | Brevan Howard Capital Management LP | 6.315 | 323 | ||||||
| 2026-01-23 | 13F | Assetmark, Inc | 5 | 0,00 | 0 | |||||
| 2026-02-13 | 13F | First Trust Advisors Lp | 49.945 | -92,22 | 2.558 | -92,39 | ||||
| 2026-02-17 | 13F | Qube Research & Technologies Ltd | 242.031 | -2,63 | 12.394 | -4,68 | ||||
| 2026-02-13 | 13F | Arrowstreet Capital, Limited Partnership | 0 | -100,00 | 0 | |||||
| 2026-02-10 | 13F | Bnp Paribas Arbitrage, Sa | 34.202 | 48,69 | 1.751 | 45,55 | ||||
| 2025-11-14 | 13F | Occudo Quantitative Strategies Lp | 0 | -100,00 | 0 | |||||
| 2026-02-12 | 13F | Renaissance Technologies Llc | 974.806 | -7,38 | 49.920 | -9,33 | ||||
| 2025-10-27 | 13F | Pacific Capital Partners Ltd | 0 | -100,00 | 0 | -100,00 | ||||
| 2026-02-13 | 13F | BNP Paribas Asset Management Holding S.A. | 151 | 46,60 | 0 | |||||
| 2026-02-17 | 13F | Tudor Investment Corp Et Al | 16.274 | 9,15 | 833 | 6,93 | ||||
| 2026-02-09 | 13F | Cooke & Bieler Lp | 391.126 | 20.030 | ||||||
| 2026-02-13 | 13F | Verition Fund Management LLC | 4.072 | 209 | ||||||
| 2026-02-09 | 13F | Quest Partners LLC | 4.474 | 284,69 | 229 | 281,67 | ||||
| 2026-01-29 | 13F | Vanguard Group Inc | 1.298.086 | -0,73 | 66.475 | -2,82 | ||||
| 2026-02-17 | 13F | Citadel Advisors Llc | Put | 0 | -100,00 | 0 | ||||
| 2026-02-02 | 13F | Principal Financial Group Inc | 20.883 | 44,13 | 1.069 | 41,22 | ||||
| 2026-02-17 | 13F | Creative Planning | 19.758 | 208,04 | 1.012 | 201,79 | ||||
| 2026-02-17 | 13F | Point72 Asset Management, L.P. | 104.331 | 5.343 | ||||||
| 2026-04-21 | 13F | Vise Technologies, Inc. | 4.995 | 0,00 | 256 | 0,00 | ||||
| 2026-01-26 | 13F | Moran Wealth Management, LLC | 11.594 | 21,90 | 594 | 19,32 | ||||
| 2026-02-13 | 13F | Martingale Asset Management L P | 23.417 | -1,67 | 1.199 | -3,69 | ||||
| 2026-02-17 | 13F | T. Rowe Price Investment Management, Inc. | 0 | -100,00 | 0 | |||||
| 2026-02-11 | 13F | Simplex Trading, Llc | Call | 0 | -100,00 | 0 | ||||
| 2026-02-12 | 13F | DRW Securities, LLC | 0 | -100,00 | 0 | -100,00 | ||||
| 2025-10-31 | 13F | JustInvest LLC | 0 | -100,00 | 0 | |||||
| 2026-02-13 | 13F | Morgan Stanley | 226.835 | 19,03 | 11.616 | 16,53 | ||||
| 2026-02-13 | 13F | Jacobs Levy Equity Management, Inc | 292.599 | 72,99 | 14.984 | 69,34 | ||||
| 2026-01-29 | 13F | Copeland Capital Management, LLC | 1.286 | 0,00 | 66 | -2,99 | ||||
| 2026-02-12 | 13F | Aristides Capital LLC | 3.988 | -40,82 | 204 | -15,70 | ||||
| 2025-11-14 | 13F | Walleye Trading LLC | Call | 0 | -100,00 | 0 | ||||
| 2026-02-05 | 13F | Allworth Financial LP | 89 | -77,69 | 5 | -80,00 | ||||
| 2026-02-17 | 13F | Citadel Advisors Llc | Call | 12.100 | 12,04 | 620 | 9,75 | |||
| 2025-11-14 | 13F | Walleye Trading LLC | Put | 0 | -100,00 | 0 | ||||
| 2026-02-11 | 13F | Los Angeles Capital Management Llc | 9.486 | -38,94 | 481 | -40,89 | ||||
| 2026-02-17 | 13F | Citadel Advisors Llc | 122.221 | 143,98 | 6.259 | 138,85 | ||||
| 2026-01-29 | 13F | UBS Group AG | 124.505 | 527,55 | 6.376 | 514,75 | ||||
| 2026-02-13 | 13F | MAI Capital Management | 332 | 0,00 | 17 | 0,00 | ||||
| 2026-02-17 | 13F | VARCOV Co. | 4.926 | 252 | ||||||
| 2026-02-17 | 13F | Aqr Capital Management Llc | 76.050 | 0,65 | 3.895 | -1,47 | ||||
| 2026-04-16 | 13F | Diversified Trust Co | 5.277 | 9,19 | 259 | 4,86 | ||||
| 2026-02-17 | 13F | Northern Trust Corp | 154.029 | -5,51 | 7.888 | -7,51 | ||||
| 2026-01-15 | 13F | Nisa Investment Advisors, Llc | 185 | -29,92 | 9 | -30,77 | ||||
| 2026-02-17 | 13F | Alliancebernstein L.p. | 42.162 | 0,00 | 2.159 | -2,09 | ||||
| 2026-02-11 | 13F | Simplex Trading, Llc | Put | 0 | -100,00 | 0 | ||||
| 2026-02-12 | 13F | Dimensional Fund Advisors Lp | 806.268 | -6,51 | 41.289 | -8,51 | ||||
| 2026-02-18 | 13F | Vident Advisory, LLC | 14.132 | 724 | ||||||
| 2026-01-26 | 13F | Mirae Asset Global Investments Co., Ltd. | 0 | -100,00 | 0 | -100,00 | ||||
| 2026-02-17 | 13F | MIRAE ASSET GLOBAL ETFS HOLDINGS Ltd. | 7.588 | 0,50 | 389 | -1,52 | ||||
| 2026-02-02 | 13F | Danske Bank A/s | 100 | 0,00 | 5 | 0,00 | ||||
| 2026-02-13 | 13F | Smartleaf Asset Management LLC | 265 | 159,80 | 14 | 116,67 | ||||
| 2026-02-11 | 13F | Deutsche Bank Ag\ | 374.647 | 13,56 | 19.186 | 11,17 | ||||
| 2026-02-17 | 13F | Polymer Capital Management (US) LLC | 6.861 | 351 | ||||||
| 2026-04-06 | 13F | GAMMA Investing LLC | 456 | -2,15 | 22 | -4,35 | ||||
| 2026-02-17 | 13F | Gotham Asset Management, LLC | 21.371 | 31,06 | 1.094 | 28,40 | ||||
| 2026-02-12 | 13F | Federated Hermes, Inc. | 28 | -48,15 | 1 | -50,00 | ||||
| 2026-02-13 | 13F | Mariner, LLC | 4.887 | 4,47 | 250 | 2,46 | ||||
| 2026-02-17 | 13F | Two Sigma Advisers, Lp | 34.000 | -26,57 | 1.741 | -28,12 | ||||
| 2026-02-10 | 13F | Intech Investment Management Llc | 9.142 | 4,41 | 468 | 2,18 | ||||
| 2026-02-13 | 13F | Dynamic Technology Lab Private Ltd | 8.890 | -27,66 | 455 | -29,24 | ||||
| 2026-02-11 | 13F | O'shaughnessy Asset Management, Llc | 15.801 | -31,59 | 809 | -33,03 | ||||
| 2025-11-14 | 13F | Point72 Asia (Singapore) Pte. Ltd. | 1.075 | 56 | ||||||
| 2026-01-27 | 13F | WealthCollab, LLC | 26 | 1 | ||||||
| 2026-02-03 | 13F | SBI Securities Co., Ltd. | 0 | -100,00 | 0 | |||||
| 2026-02-13 | 13F | Segall Bryant & Hamill, Llc | 25.531 | 0,08 | 1.307 | -2,02 | ||||
| 2026-02-17 | 13F | Quantinno Capital Management LP | 6.694 | 343 | ||||||
| 2025-11-14 | 13F | Wolverine Trading, Llc | 6.912 | 443 | ||||||
| 2026-02-09 | 13F | Hartland & Co., LLC | 0 | -100,00 | 0 | |||||
| 2025-11-14 | 13F | Wolverine Trading, Llc | Call | 3.800 | 244 | |||||
| 2026-04-23 | 13F | SJS Investment Consulting Inc. | 5 | 0 | ||||||
| 2026-02-13 | 13F | Rhumbline Advisers | 25.815 | -11,56 | 1.322 | -13,37 | ||||
| 2026-02-17 | 13F | Ameriprise Financial Inc | 25.722 | 237,25 | 1.317 | 230,08 | ||||
| 2026-01-20 | 13F | Harbor Capital Advisors, Inc. | 2.509 | -17,52 | 0 | |||||
| 2026-02-13 | 13F | Citigroup Inc | 3.033 | -48,44 | 155 | -49,51 | ||||
| 2025-11-13 | 13F | Mackenzie Financial Corp | 0 | -100,00 | 0 | -100,00 | ||||
| 2026-04-07 | 13F | Signaturefd, Llc | 275 | 121,77 | 14 | 116,67 | ||||
| 2026-02-17 | 13F | Dark Forest Capital Management Lp | 29.743 | 240,62 | 1.523 | 233,99 | ||||
| 2026-02-09 | 13F | New Age Alpha Advisors, LLC | 298 | 0,00 | 15 | 0,00 | ||||
| 2026-02-05 | 13F | Amalgamated Bank | 511 | -3,77 | 0 | |||||
| 2026-02-02 | 13F | Seizert Capital Partners, Llc | 5.023 | 257 | ||||||
| 2026-02-12 | 13F | Hrt Financial Lp | 134.511 | 338,92 | 7 | 500,00 | ||||
| 2026-02-12 | 13F | Nuveen, LLC | 163.595 | -44,41 | 8.378 | -45,58 | ||||
| 2026-02-13 | 13F | Virtus ETF Advisers LLC | 3.240 | 0,00 | 166 | -2,37 | ||||
| 2026-04-27 | 13F | Y-Intercept (Hong Kong) Ltd | 10.333 | 17,45 | 507 | 12,67 | ||||
| 2026-02-17 | 13F | Two Sigma Investments, Lp | 82.558 | -33,19 | 4.228 | -34,60 | ||||
| 2026-02-10 | 13F | Connor, Clark & Lunn Investment Management Ltd. | 31.501 | -15,60 | 1.613 | -17,37 | ||||
| 2026-02-05 | 13F | PAX Financial Group, LLC | 8.787 | 68,01 | 450 | 64,47 | ||||
| 2026-02-12 | 13F | BlackRock, Inc. | 1.729.572 | 1,32 | 88.571 | -0,81 | ||||
| 2026-02-12 | 13F | New York State Common Retirement Fund | 5.329 | 0,00 | 273 | -2,16 | ||||
| 2026-02-09 | 13F | Legal & General Group Plc | 31.115 | -0,68 | 1.593 | -2,75 | ||||
| 2026-02-17 | 13F | Trexquant Investment LP | 23.750 | -74,02 | 1.216 | -74,57 | ||||
| 2026-02-11 | 13F | Meeder Asset Management Inc | 922 | 426,86 | 47 | 422,22 | ||||
| 2025-11-13 | 13F | Bank Of Montreal /can/ | 0 | -100,00 | 0 | -100,00 | ||||
| 2026-02-10 | 13F/A | Northwestern Mutual Wealth Management Co | 81 | 4 | ||||||
| 2026-01-21 | 13F | Flagship Harbor Advisors, Llc | 500 | 26 | ||||||
| 2026-02-02 | 13F | Cornerstone Planning Group LLC | 23 | -11,54 | 1 | 0,00 | ||||
| 2026-02-13 | 13F | Barclays Plc | 68.552 | -25,22 | 3.511 | -26,80 | ||||
| 2026-02-17 | 13F | Susquehanna International Group, Llp | Call | 5.000 | -12,28 | 256 | -14,09 | |||
| 2026-02-17 | 13F | Janus Henderson Group Plc | 8.681 | -57,10 | 445 | -58,03 | ||||
| 2026-04-20 | 13F | Ritholtz Wealth Management | 9.924 | -22,38 | 487 | -25,54 | ||||
| 2026-01-16 | 13F | Empirical Financial Services, LLC d.b.a. Empirical Wealth Management | 10.117 | 16,78 | 518 | 14,35 | ||||
| 2025-11-12 | 13F | Simplex Trading, Llc | 0 | -100,00 | 0 | |||||
| 2026-02-17 | 13F | Susquehanna International Group, Llp | 21.742 | -45,54 | 1.113 | -46,70 | ||||
| 2026-02-17 | 13F | D. E. Shaw & Co., Inc. | 234.545 | -7,69 | 12.011 | -9,62 | ||||
| 2026-02-12 | 13F | Jane Street Group, Llc | 119.813 | 6.136 | ||||||
| 2026-01-28 | 13F | Teacher Retirement System Of Texas | 0 | -100,00 | 0 | |||||
| 2026-02-06 | 13F | Americana Partners, LLC | 29.166 | 0,00 | 1.494 | -2,10 | ||||
| 2026-02-17 | 13F | Susquehanna International Group, Llp | Put | 0 | -100,00 | 0 | -100,00 | |||
| 2026-04-13 | 13F | IFP Advisors, Inc | 827 | -0,96 | 41 | -4,76 | ||||
| 2026-02-10 | 13F | Rothschild Investment Llc | 15 | 0,00 | 1 | |||||
| 2026-02-20 | 13F | Sunbelt Securities, Inc. | 0 | -100,00 | 0 | |||||
| 2026-02-17 | 13F | Balyasny Asset Management Llc | 6.169 | -30,87 | 316 | -32,40 | ||||
| 2026-02-17 | 13F | Graham Capital Management, L.P. | 7.037 | 32,85 | 360 | 29,96 | ||||
| 2026-02-11 | 13F | Inceptionr Llc | 0 | -100,00 | 0 | |||||
| 2026-01-28 | 13F | Klp Kapitalforvaltning As | 4.600 | 9,52 | 236 | 7,31 | ||||
| 2025-11-10 | 13F | Axq Capital, Lp | 0 | -100,00 | 0 | -100,00 | ||||
| 2026-02-17 | 13F | Price T Rowe Associates Inc /md/ | 13.765 | 4,78 | 1 | |||||
| 2026-02-03 | 13F | Mitsubishi UFJ Kokusai Asset Management Co., Ltd. | 1.984 | -18,52 | 100 | -21,26 | ||||
| 2026-02-12 | 13F | Alps Advisors Inc | 6.946 | 1,11 | 356 | -1,11 | ||||
| 2026-02-17 | 13F | Bank Of America Corp /de/ | 61.205 | 139,24 | 3.134 | 134,23 | ||||
| 2026-04-24 | 13F | Strs Ohio | 0 | -100,00 | 0 | |||||
| 2026-02-17 | 13F | State Of Wisconsin Investment Board | 13.528 | 14,18 | 693 | 11,79 | ||||
| 2026-02-06 | 13F | Mraz, Amerine & Associates, Inc. | 5.218 | 0,00 | 267 | -1,84 | ||||
| 2025-11-12 | 13F | Creekmur Asset Management LLC | 0 | 0 | ||||||
| 2026-02-12 | 13F | Kahn Brothers Group Inc /de/ | 392.011 | -0,09 | 20.075 | -2,19 | ||||
| 2026-02-11 | 13F | Vestcor Inc | 17.224 | 392,96 | 1 | |||||
| 2026-01-28 | 13F | DekaBank Deutsche Girozentrale | 3.391 | 0,00 | 0 | |||||
| 2026-02-17 | 13F | Canada Pension Plan Investment Board | 12.200 | 625 | ||||||
| 2026-02-17 | 13F | Weiss Asset Management LP | 21.558 | 1.104 | ||||||
| 2026-02-09 | 13F | Harbour Investments, Inc. | 323 | -6,65 | 17 | -11,11 | ||||
| 2026-02-17 | 13F | Man Group plc | 21.467 | -52,04 | 1.099 | -53,05 | ||||
| 2025-11-13 | 13F | Entropy Technologies, LP | 0 | -100,00 | 0 | |||||
| 2026-02-04 | 13F | Versor Investments LP | 7.112 | -3,45 | 364 | -5,45 | ||||
| 2026-02-13 | 13F | Ubs Asset Management Americas Inc | 27.271 | 3,60 | 1.397 | 1,45 | ||||
| 2026-01-30 | 13F | CBOE Vest Financial, LLC | 0 | -100,00 | 0 | |||||
| 2025-11-12 | 13F | Gabelli Funds Llc | 0 | -100,00 | 0 | |||||
| 2026-02-13 | 13F | Battery Global Advisors, LLC | 20 | 6 | ||||||
| 2025-11-12 | 13F | Quantbot Technologies LP | 0 | -100,00 | 0 | -100,00 | ||||
| 2025-11-14 | 13F | Cubist Systematic Strategies, LLC | 50.468 | -6,39 | 2.640 | -28,35 | ||||
| 2026-02-13 | 13F | Manufacturers Life Insurance Company, The | 8.368 | -4,56 | 429 | -6,55 | ||||
| 2026-04-16 | 13F | SG Americas Securities, LLC | 10.401 | -28,77 | 1 | |||||
| 2026-02-12 | 13F | Quadrant Capital Group Llc | 316 | 0,00 | 16 | 0,00 | ||||
| 2026-02-13 | 13F | SRS Capital Advisors, Inc. | 51 | -87,97 | 3 | -90,91 | ||||
| 2026-04-15 | 13F | Exchange Traded Concepts, Llc | 4.845 | -9,18 | 238 | -13,19 | ||||
| 2026-02-11 | 13F | Group One Trading, L.p. | Put | 0 | -100,00 | 0 | -100,00 | |||
| 2026-04-13 | 13F | True Wealth Design, LLC | 3 | 50,00 | 0 | |||||
| 2026-02-17 | 13F/A | Laurion Capital Management LP | 13.683 | 701 | ||||||
| 2026-02-12 | 13F | Swiss National Bank | 42.000 | 1,94 | 2.151 | -0,23 | ||||
| 2026-02-10 | 13F | Goldman Sachs Group Inc | 122.591 | -11,34 | 6.278 | -13,22 | ||||
| 2026-02-11 | 13F | Hughes Financial Services, LLC | 3 | 0 | ||||||
| 2026-02-19 | 13F | Invesco Ltd. | 31.931 | 6,72 | 1.635 | 4,47 | ||||
| 2026-02-17 | 13F | Tower Research Capital LLC (TRC) | 1.517 | 74,37 | 78 | 71,11 | ||||
| 2026-01-28 | 13F | Universal- Beteiligungs- und Servicegesellschaft mbH | 8.099 | -1,89 | 415 | -3,94 | ||||
| 2026-02-13 | 13F | Prudential Financial Inc | 6.415 | -61,90 | 329 | -62,73 | ||||
| 2025-11-14 | 13F | Petrus Trust Company, LTA | 0 | -100,00 | 0 | -100,00 | ||||
| 2026-02-06 | 13F | Pnc Financial Services Group, Inc. | 255 | 200,00 | 13 | 225,00 | ||||
| 2026-02-09 | 13F | Royce & Associates Lp | 172.367 | 474,94 | 8.827 | 462,88 | ||||
| 2026-04-20 | 13F | State of Alaska, Department of Revenue | 734 | 0,00 | 0 | |||||
| 2026-03-06 | 13F | Hsbc Holdings Plc | 19.395 | 9,84 | 997 | 5,29 | ||||
| 2026-02-10 | 13F | Semanteon Capital Management, LP | 0 | -100,00 | 0 | |||||
| 2026-02-17 | 13F | Public Employees Retirement System Of Ohio | 10.080 | 447,83 | 516 | 437,50 | ||||
| 2026-02-11 | 13F | Group One Trading, L.p. | 266 | 60,24 | 14 | 62,50 | ||||
| 2026-04-07 | 13F | Farther Finance Advisors, LLC | 85 | -2,30 | 4 | 0,00 | ||||
| 2026-02-11 | 13F | Group One Trading, L.p. | Call | 100 | -80,00 | 5 | -80,77 | |||
| 2026-02-13 | 13F | Panagora Asset Management Inc | 73.947 | 0,44 | 3.787 | -1,69 | ||||
| 2026-02-17 | 13F | New Vernon Capital Holdings II LLC | 4.136 | 212 | ||||||
| 2026-02-17 | 13F | Russell Investments Group, Ltd. | 97.411 | 0,16 | 4.988 | -5,40 | ||||
| 2026-01-29 | 13F | Comerica Bank | 994 | 51 | ||||||
| 2026-02-13 | 13F | Victory Capital Management Inc | 33.292 | 16,97 | 1.705 | 14,52 | ||||
| 2026-02-12 | 13F | MetLife Investment Management, LLC | 9.323 | 0,00 | 477 | -2,05 | ||||
| 2025-11-13 | 13F | Norges Bank | 0 | -100,00 | 0 | -100,00 | ||||
| 2026-02-17 | 13F | Royal Bank Of Canada | 465 | 143,46 | 24 | 140,00 | ||||
| 2026-04-08 | 13F | Wealth Enhancement Advisory Services, Llc | 181.423 | -45,10 | 8.794 | -48,31 | ||||
| 2026-02-17 | 13F | Raymond James Financial Inc | 6.435 | 330 | ||||||
| 2026-02-17 | 13F | Susquehanna Portfolio Strategies, LLC | 25.118 | 408,46 | 1.286 | 398,45 | ||||
| 2026-02-09 | 13F | Geode Capital Management, Llc | 559.849 | 22,08 | 28.675 | 19,51 | ||||
| 2026-01-30 | 13F | New York State Teachers Retirement System | 1.408 | 0,00 | 0 | |||||
| 2026-02-04 | 13F | Pacer Advisors, Inc. | 0 | -100,00 | 0 | |||||
| 2026-02-13 | 13F | Toroso Investments, LLC | 0 | -100,00 | 0 | |||||
| 2026-02-17 | 13F | Fmr Llc | 136.660 | 26,56 | 6.998 | 23,90 | ||||
| 2026-01-29 | 13F | Quent Capital, LLC | 22 | 0,00 | 1 | 0,00 | ||||
| 2026-02-06 | 13F | Bare Financial Services, Inc | 0 | -100,00 | 0 | |||||
| 2026-02-17 | 13F | Magnetar Financial LLC | 16.674 | 196,53 | 854 | 190,14 | ||||
| 2026-01-27 | 13F | Zurcher Kantonalbank (Zurich Cantonalbank) | 4.889 | -59,08 | 250 | -60,00 | ||||
| 2026-02-17 | 13F | Veradace Capital Management LLC | 41.179 | 2.109 | ||||||
| 2026-02-10 | 13F | Bank of New York Mellon Corp | 116.519 | 1,76 | 5.967 | -0,38 | ||||
| 2026-02-06 | 13F | Larson Financial Group LLC | 201 | 402,50 | 10 | 400,00 | ||||
| 2026-02-13 | 13F | Charles Schwab Investment Management Inc | 299.718 | 3,57 | 15.349 | 1,39 | ||||
| 2026-02-17 | 13F | Advisor Group Holdings, Inc. | 4.659 | -32,49 | 239 | -46,15 | ||||
| 2026-02-17 | 13F | California State Teachers Retirement System | 19.466 | -0,08 | 997 | -2,26 | ||||
| 2026-02-18 | 13F | State of Tennessee, Treasury Department | 5.509 | 268 | ||||||
| 2026-04-21 | 13F | PharVision Advisers, LLC | 0 | -100,00 | 0 | |||||
| 2026-02-12 | 13F | Steward Partners Investment Advisory, Llc | 6.339 | -16,91 | 325 | -18,80 | ||||
| 2026-02-10 | 13F | State of Wyoming | 5.186 | -21,63 | 266 | -23,41 | ||||
| 2026-02-17 | 13F | Susquehanna Fundamental Investments, Llc | 0 | -100,00 | 0 | |||||
| 2026-02-11 | 13F | Franklin Resources Inc | 37.192 | 13,86 | 1.905 | 11,48 | ||||
| 2026-02-13 | 13F | Squarepoint Ops LLC | 0 | -100,00 | 0 | |||||
| 2026-04-10 | 13F/A | OP Asset Management Ltd | 71.705 | 189,48 | 3.521 | 177,60 | ||||
| 2026-02-13 | 13F | Centiva Capital, LP | 0 | -100,00 | 0 | |||||
| 2026-04-22 | 13F | Sterling Capital Management LLC | 204 | -31,77 | 10 | -33,33 | ||||
| 2026-01-14 | 13F | Hennion & Walsh Asset Management, Inc. | 14.262 | 17,07 | 730 | 14,60 | ||||
| 2026-02-12 | 13F | Campbell & CO Investment Adviser LLC | 9.658 | -13,72 | 495 | -15,56 | ||||
| 2026-02-06 | 13F | Gsa Capital Partners Llp | 0 | -100,00 | 0 | |||||
| 2026-02-17 | 13F | Aster Capital Management (DIFC) Ltd | 0 | -100,00 | 0 | |||||
| 2025-11-13 | 13F | Jump Financial, LLC | 0 | -100,00 | 0 | |||||
| 2025-11-14 | 13F | Point72 Europe (London) LLP | 184 | 10 | ||||||
| 2026-02-13 | 13F | Marshall Wace, Llp | 0 | -100,00 | 0 | |||||
| 2026-02-13 | 13F | American Century Companies Inc | 64.058 | -10,86 | 3.280 | -12,74 | ||||
| 2026-04-06 | 13F | Versant Capital Management, Inc | 126 | -11,89 | 6 | -14,29 | ||||
| 2026-02-11 | 13F | Ameritas Investment Partners, Inc. | 1.360 | 70 | ||||||
| 2026-02-13 | 13F | Wells Fargo & Company/mn | 34.636 | 43,80 | 1.774 | 40,83 | ||||
| 2026-04-13 | 13F | Massmutual Trust Co Fsb/adv | 8 | -76,47 | 0 | -100,00 | ||||
| 2026-02-04 | 13F | Virginia Retirement Systems Et Al | 19.100 | -21,72 | 978 | -23,35 | ||||
| 2026-02-13 | 13F | Healthcare Of Ontario Pension Plan Trust Fund | 16.100 | 0,00 | 824 | -2,14 | ||||
| 2026-02-14 | 13F | Rockefeller Capital Management L.P. | 399 | 20 | ||||||
| 2026-02-17 | 13F | Algert Global Llc | 146.176 | -3,19 | 7 | 0,00 | ||||
| 2026-02-17 | 13F | Advisory Services Network, LLC | 0 | -100,00 | 0 | |||||
| 2026-02-11 | 13F | Jpmorgan Chase & Co | 46.741 | -40,26 | 2.394 | -41,52 | ||||
| 2026-02-13 | 13F | Caitong International Asset Management Co., Ltd | 0 | -100,00 | 0 | |||||
| 2026-02-17 | 13F | Kemnay Advisory Services Inc. | 1.883 | 96 |
Other Listings
| US:IDT | 51,79 $ |