Grundlæggende statistik
| Institutionelle ejere | 286 total, 283 long only, 0 short only, 3 long/short - change of -3,72% MRQ |
| Del pris | 23,00 |
| Gennemsnitlig porteføljeallokering | 0.0724 % - change of -33,73% MRQ |
| Institutionelle aktier (lange) | 73.296.137 (ex 13D/G) - change of 4,42MM shares 6,43% MRQ |
| Institutionel værdi (lang) | $ 2.236.602 USD ($1000) |
Institutionelt ejerskab og aktionærer
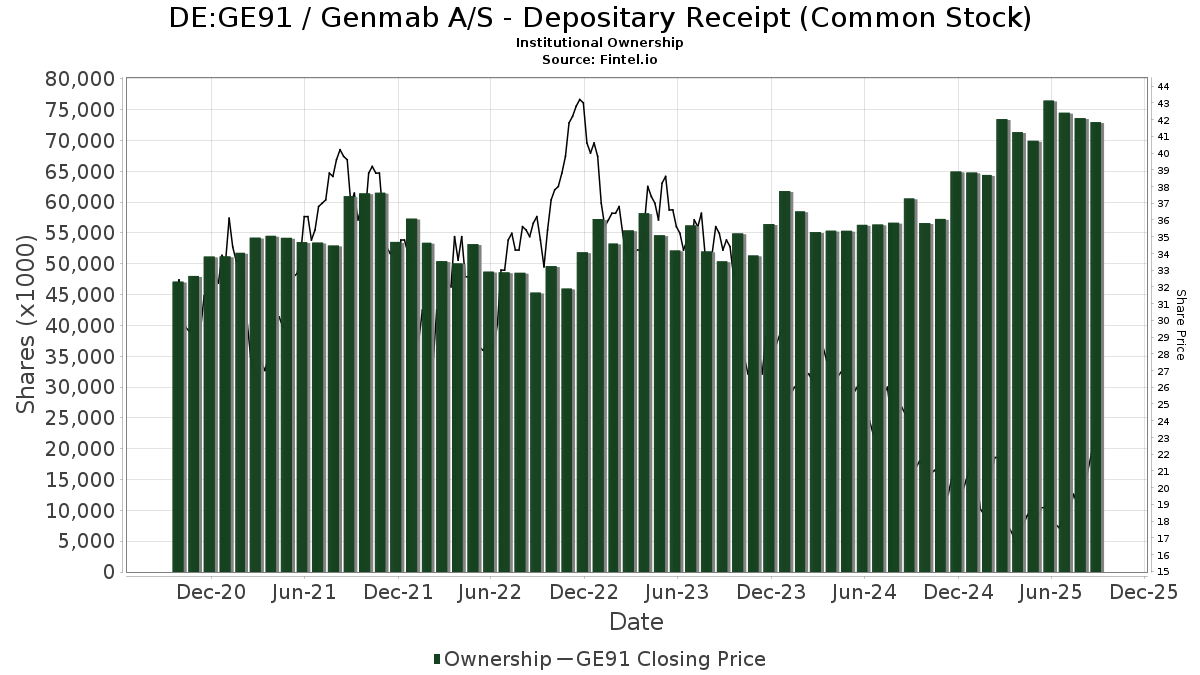
Genmab A/S - Depositary Receipt (Common Stock) (DE:GE91) har 286 institutionelle ejere og aktionærer, der har indsendt 13D/G- eller 13F-formularer til Securities Exchange Commission (SEC). Disse institutioner har i alt 73,296,137 aktier. Største aktionærer omfatter Orbis Allan Gray Ltd, Alliancebernstein L.p., Paradigm Biocapital Advisors LP, Arrowstreet Capital, Limited Partnership, BlackRock, Inc., Renaissance Technologies Llc, Harding Loevner Lp, Morgan Stanley, First Trust Advisors Lp, and Goldman Sachs Group Inc .
Genmab A/S - Depositary Receipt (Common Stock) (DB:GE91) institutionel ejerskabsstruktur viser aktuelle positioner i virksomheden efter institutioner og fonde, samt seneste ændringer i positionsstørrelse. Større aktionærer kan omfatte individuelle investorer, investeringsforeninger, hedgefonde eller institutioner. Skema 13D angiver, at investoren besidder (eller besidder) mere end 5 % af virksomheden og har til hensigt (eller har til hensigt at) aktivt at forfølge en ændring i forretningsstrategi. Skema 13G indikerer en passiv investering på over 5%.
The share price as of April 24, 2026 is 23,00 / share. Previously, on May 2, 2025, the share price was 18,90 / share. This represents an increase of 21,69% over that period.
Fondens stemningsscore
Fund Sentiment Score (fka Ownership Accumulation Score) finder de aktier, der bliver mest købt af fonde. Det er resultatet af en sofistikeret, multi-faktor kvantitativ model, der identificerer virksomheder med de højeste niveauer af institutionel akkumulering. Scoringsmodellen bruger en kombination af den samlede stigning i oplyste ejere, ændringerne i porteføljeallokeringer i disse ejere og andre målinger. Tallet går fra 0 til 100, hvor højere tal indikerer et højere niveau af akkumulering for sine jævnaldrende, og 50 er gennemsnittet.
Opdateringsfrekvens: Dagligt
Se Ownership Explorer, som giver en liste over højest rangerende virksomheder.
AI+ Ask Fintel’s AI assistant about Genmab A/S - Depositary Receipt (Common Stock).
Select a question to share a public post with an AI-crafted answer.
Thinking of good questions…
13F og NPORT arkivering
Detaljer om 13F-arkivering er gratis. Detaljer om NP-ansøgninger kræver et premium-medlemskab. Grønne rækker angiver nye positioner. Røde rækker angiver lukkede positioner. Klik på linket ikon for at se den fulde transaktionshistorik.
Opgrader
for at låse premium-data op og eksportere til Excel ![]() .
.
| Fil dato | Kilde | Investor | Type | Gennemsnitlig pris (Øst) |
Aktier | Δ Aktier (%) |
Rapporteret Værdi ($1000) |
Δ Værdi (%) |
Port Alloc (%) |
|
|---|---|---|---|---|---|---|---|---|---|---|
| 2026-02-12 | 13F | Mark Sheptoff Financial Planning, Llc | 1.400 | 0,00 | 43 | 2,38 | ||||
| 2026-02-17 | 13F | Citadel Advisors Llc | Put | 13.200 | 29,41 | 407 | 30,13 | |||
| 2026-02-17 | 13F | Laird Norton Trust Company, Llc | 15.839 | 488 | ||||||
| 2026-02-17 | 13F | Citadel Advisors Llc | Call | 26.900 | -10,33 | 829 | -10,00 | |||
| 2026-02-13 | 13F | Knollwood Investment Advisory, LLC | 7.300 | 0,00 | 225 | 0,45 | ||||
| 2026-02-23 | 13F | Virtu Financial LLC | 22.620 | 1 | ||||||
| 2026-04-07 | 13F | Retirement Wealth Solutions LLC | 3 | -78,57 | 0 | |||||
| 2026-02-13 | 13F | Ubs Asset Management Americas Inc | 6.096 | 188 | ||||||
| 2026-02-17 | 13F | Citadel Advisors Llc | 19.102 | -62,89 | 588 | -62,74 | ||||
| 2026-02-13 | 13F | Level Four Advisory Services, Llc | 61.027 | -9,38 | 1.880 | -9,01 | ||||
| 2026-02-17 | 13F | Susquehanna International Group, Llp | Call | 15.400 | 25,20 | 474 | 25,73 | |||
| 2026-04-27 | 13F | Sound Income Strategies, LLC | 721 | 728,74 | 20 | 850,00 | ||||
| 2026-02-17 | 13F | Susquehanna International Group, Llp | 612.323 | 3.310,89 | 18.860 | 3.328,91 | ||||
| 2026-02-09 | 13F | Harbour Investments, Inc. | 168 | 0,00 | 5 | 0,00 | ||||
| 2026-02-12 | 13F | BlackRock, Inc. | 4.593.901 | 33,14 | 141.492 | 33,70 | ||||
| 2026-02-17 | 13F | Susquehanna International Group, Llp | Put | 22.900 | 705 | |||||
| 2026-02-09 | 13F | Smithfield Trust Co | 60 | 0 | ||||||
| 2026-02-05 | 13F | Atria Investments Llc | 42.462 | 43,64 | 1.308 | 44,26 | ||||
| 2026-04-13 | 13F | True Wealth Design, LLC | 291 | 0,00 | 8 | -12,50 | ||||
| 2026-02-17 | 13F | Trexquant Investment LP | 0 | -100,00 | 0 | |||||
| 2026-02-05 | 13F | Bessemer Group Inc | 784 | 174,13 | 0 | |||||
| 2026-02-09 | 13F | Annis Gardner Whiting Capital Advisors, LLC | 362 | 11 | ||||||
| 2026-04-13 | 13F | IFP Advisors, Inc | 102 | 2,00 | 3 | -33,33 | ||||
| 2026-02-04 | 13F | Ameritas Advisory Services, LLC | 0 | -100,00 | 0 | |||||
| 2026-02-17 | 13F | Ishara Investments LP | 70.000 | 2.156 | ||||||
| 2026-04-20 | 13F | Ronald Blue Trust, Inc. | 11.609 | -1,11 | 311 | -13,85 | ||||
| 2026-02-13 | 13F | Ingalls & Snyder Llc | 73.105 | -31,85 | 2 | -33,33 | ||||
| 2025-11-13 | 13F | Riggs Asset Managment Co. Inc. | 0 | -100,00 | 0 | -100,00 | ||||
| 2026-02-13 | 13F | Stifel Financial Corp | 39.931 | 78,10 | 1.230 | 78,89 | ||||
| 2026-02-13 | 13F | Capital Square, LLC | 7.462 | 230 | ||||||
| 2026-02-17 | 13F | Graham Capital Management, L.P. | 0 | -100,00 | 0 | |||||
| 2026-04-16 | 13F | SG Americas Securities, LLC | 8.887 | 36,26 | 0 | |||||
| 2026-02-17 | 13F | Superstring Capital Management Lp | 29.162 | 898 | ||||||
| 2026-02-13 | 13F | Squarepoint Ops LLC | 0 | -100,00 | 0 | |||||
| 2026-04-23 | 13F | North Star Investment Management Corp. | 543 | 108,85 | 15 | 75,00 | ||||
| 2026-02-17 | 13F | Pinnacle Financial Partners, Inc. | 47.315 | 1.457 | ||||||
| 2026-01-15 | 13F | Burns Matteson Capital Management, LLC | 7.584 | 234 | ||||||
| 2026-02-13 | 13F | Citigroup Inc | 38.239 | -61,30 | 1.178 | -61,16 | ||||
| 2026-02-12 | 13F | Principal Securities, Inc. | 0 | -100,00 | 0 | -100,00 | ||||
| 2026-01-16 | 13F | Tema Etfs Llc | 0 | -100,00 | 0 | -100,00 | ||||
| 2026-02-11 | 13F | IMA Wealth, Inc. | 41 | 1 | ||||||
| 2026-02-10 | 13F | Godfrey Financial Associates, Inc. | 4 | 0 | ||||||
| 2026-02-12 | 13F | Brinker Capital Investments, LLC | 23.899 | 21,36 | 736 | 22,06 | ||||
| 2025-11-07 | 13F | Skandinaviska Enskilda Banken AB (publ) | 0 | -100,00 | 0 | -100,00 | ||||
| 2026-04-30 | 13F | Kestra Advisory Services, LLC | 9.988 | 218,80 | 268 | 178,13 | ||||
| 2026-02-10 | 13F/A | Northwestern Mutual Wealth Management Co | 33 | 26,92 | 1 | |||||
| 2026-02-17 | 13F | Glenmede Trust Co Na | 14.843 | 12,51 | 457 | 77,13 | ||||
| 2026-04-16 | 13F | Security National Bank | 45 | 0,00 | 1 | 0,00 | ||||
| 2026-01-22 | 13F | Pinnacle Bancorp, Inc. | 0 | -100,00 | 0 | -100,00 | ||||
| 2026-04-29 | 13F | Frank, Rimerman Advisors LLC | 0 | -100,00 | 0 | |||||
| 2026-04-30 | 13F | Manning & Napier Advisors Llc | 54 | -25,00 | 1 | -50,00 | ||||
| 2026-02-17 | 13F | Wiley Bros.-aintree Capital, Llc | 8.831 | 272 | ||||||
| 2026-04-24 | 13F | Root Financial Partners, LLC | 30 | 36,36 | 1 | |||||
| 2026-02-13 | 13F | Mml Investors Services, Llc | 39.249 | 3,32 | 1.209 | 3,69 | ||||
| 2025-11-07 | 13F | Sierra Ocean, Llc | 0 | -100,00 | 0 | |||||
| 2026-04-08 | 13F | Arlington Trust Co LLC | 24 | 1 | ||||||
| 2026-02-11 | 13F | Franklin Resources Inc | 30.650 | -2,20 | 944 | -1,77 | ||||
| 2026-02-13 | 13F | Barclays Plc | 5 | 0,00 | 0 | -100,00 | ||||
| 2026-04-14 | 13F | Perpetual Ltd | 758.503 | -8,31 | 20.351 | -20,13 | ||||
| 2026-01-29 | 13F | IMC-Chicago, LLC | 27.537 | 127,30 | 848 | 128,57 | ||||
| 2026-01-30 | 13F/A | M&t Bank Corp | 9.131 | 14,70 | 281 | 15,16 | ||||
| 2026-04-21 | 13F | One Wealth Advisors, LLC | 13.820 | 0,97 | 371 | -12,11 | ||||
| 2026-02-17 | 13F | Advisory Services Network, LLC | 0 | -100,00 | 0 | |||||
| 2026-02-17 | 13F | NEOS Investment Management LLC | 140.733 | 6,58 | 4.335 | 7,04 | ||||
| 2026-02-17 | 13F | SageView Advisory Group, LLC | 470 | 14 | ||||||
| 2026-05-01 | 13F | Fifth Third Bancorp | 47.371 | -2,66 | 1.271 | -15,22 | ||||
| 2026-04-22 | 13F | JNBA Financial Advisors | 0 | -100,00 | 0 | |||||
| 2026-02-10 | 13F | Principia Wealth Advisory, LLC | 33 | -2,94 | 1 | 0,00 | ||||
| 2026-02-17 | 13F | Tower Research Capital LLC (TRC) | 110.659 | 10.834,68 | 3.408 | 10.893,55 | ||||
| 2026-02-02 | 13F | Montag A & Associates Inc | 0 | -100,00 | 0 | |||||
| 2026-02-13 | 13F | SRS Capital Advisors, Inc. | 2.945 | 38,46 | 91 | 38,46 | ||||
| 2026-02-13 | 13F | Ieq Capital, Llc | 17.121 | 7,66 | 527 | 8,21 | ||||
| 2026-02-03 | 13F | Crossmark Global Holdings, Inc. | 23.479 | -43,85 | 723 | -43,60 | ||||
| 2026-02-06 | 13F | Global Retirement Partners, LLC | 6.963 | 25,23 | 214 | 25,88 | ||||
| 2026-02-13 | 13F | Kilter Group LLC | 17 | 0,00 | 1 | |||||
| 2026-02-17 | 13F | Agf Management Ltd | 9.056 | 0,00 | 279 | 0,36 | ||||
| 2026-04-08 | 13F | Wealth Enhancement Advisory Services, Llc | 13.861 | -6,46 | 381 | -22,24 | ||||
| 2026-02-12 | 13F | Bank Of Montreal /can/ | 52.852 | 23,50 | 1.628 | 24,01 | ||||
| 2026-04-17 | 13F | Braeburn Wealth Management LLC | 0 | -100,00 | 0 | |||||
| 2026-04-20 | 13F | YANKCOM Partnership | 100 | 0,00 | 3 | -33,33 | ||||
| 2026-04-28 | 13F | DGS Capital Management, LLC | 10.173 | -44,11 | 273 | -51,43 | ||||
| 2026-02-13 | 13F | Alyeska Investment Group, L.P. | 506.661 | 15.605 | ||||||
| 2026-02-17 | 13F | Orbis Allan Gray Ltd | 14.418.462 | 30,15 | 444.089 | 30,71 | ||||
| 2026-02-13 | 13F | Colony Group, LLC | 6.862 | 211 | ||||||
| 2026-02-12 | 13F | Quadrant Capital Group Llc | 22.396 | -2,09 | 690 | -1,71 | ||||
| 2026-04-16 | 13F | Terra Nova Asset Management LLC | 42.644 | -29,63 | 1.144 | -38,69 | ||||
| 2026-02-17 | 13F | Russell Investments Group, Ltd. | 710.587 | -13,63 | 21.886 | -13,26 | ||||
| 2026-02-17 | 13F | Engineers Gate Manager LP | 29.301 | 118,79 | 902 | 120,00 | ||||
| 2025-11-14 | 13F | Point72 Asset Management, L.P. | 0 | -100,00 | 0 | |||||
| 2026-02-13 | 13F | Great West Life Assurance Co /can/ | 4.522 | 43,42 | 0 | |||||
| 2026-04-23 | 13F | Oppenheimer Asset Management Inc. | 457.508 | 25,43 | 12.275 | 9,26 | ||||
| 2026-02-17 | 13F | Captrust Financial Advisors | 50.435 | 77,70 | 1.553 | 78,51 | ||||
| 2026-02-17 | 13F | Quadrature Capital Ltd | 79.851 | 124,92 | 2.459 | 126,01 | ||||
| 2026-02-12 | 13F | Callan Family Office, LLC | 56.072 | 60,13 | 1.727 | 60,95 | ||||
| 2026-02-17 | 13F | Cape Investment Advisory, Inc. | 44 | 1 | ||||||
| 2026-02-12 | 13F | Pitcairn Co | 0 | -100,00 | 0 | |||||
| 2026-02-09 | 13F | Geode Capital Management, Llc | 46.761 | 14,39 | 1.440 | 14,92 | ||||
| 2026-01-27 | 13F | Evergreen Capital Management Llc | 22.350 | 14,04 | 688 | 14,48 | ||||
| 2026-04-24 | 13F | UMA Financial Services, Inc. | 165 | 0,00 | 4 | -20,00 | ||||
| 2026-04-24 | 13F | Abacus Wealth Partners, LLC | 0 | -100,00 | 0 | |||||
| 2026-04-27 | 13F | Marotta Asset Management | 11.720 | -1,26 | 319 | -12,60 | ||||
| 2026-04-09 | 13F | Park Place Capital Corp | 90 | 0,00 | 2 | 0,00 | ||||
| 2026-02-17 | 13F/A | United Capital Management of KS, Inc. | 9.000 | 277 | ||||||
| 2025-11-07 | 13F | Synovus Financial Corp | 34.883 | 0,24 | 1.070 | 48,89 | ||||
| 2026-02-12 | 13F | DRW Securities, LLC | 26.354 | 209,03 | 812 | 215,56 | ||||
| 2026-04-22 | 13F | Sterling Capital Management LLC | 19.862 | -8,55 | 533 | -20,36 | ||||
| 2026-04-03 | 13F | Hickory Point Bank & Trust | 25 | 1 | ||||||
| 2026-02-10 | 13F | Daiwa Securities Group Inc. | 159 | 0,00 | 0 | |||||
| 2026-01-22 | 13F | Bear Mountain Capital, Inc. | 0 | -100,00 | 0 | |||||
| 2026-02-13 | 13F | JustInvest LLC | 73.654 | -7,07 | 2.269 | -6,67 | ||||
| 2026-04-13 | 13F | Creative Financial Designs Inc /adv | 21 | -32,26 | 1 | |||||
| 2026-02-06 | 13F | Pnc Financial Services Group, Inc. | 29.833 | 15,11 | 919 | 15,62 | ||||
| 2026-04-21 | 13F | Aaron Wealth Advisors LLC | 9.285 | 17,38 | 249 | 2,47 | ||||
| 2026-01-26 | 13F | Merit Financial Group, LLC | 0 | -100,00 | 0 | |||||
| 2026-02-10 | 13F | CIBC World Markets Inc. | 367.282 | 31,20 | 11.312 | 31,76 | ||||
| 2026-04-17 | 13F | CENTRAL TRUST Co | 14 | -17,65 | 0 | |||||
| 2025-11-14 | 13F | Point72 Hong Kong Ltd | 10.015 | -34,87 | 307 | -3,15 | ||||
| 2026-02-17 | 13F | Aquatic Capital Management LLC | 23.781 | 141,31 | 732 | 142,38 | ||||
| 2026-04-21 | 13F | Financial Consulate, Inc | 270 | 28,57 | 7 | 16,67 | ||||
| 2026-04-29 | 13F | Skopos Labs, Inc. | 35.823 | 22,74 | 961 | 1,26 | ||||
| 2026-04-28 | 13F | Abel Hall, LLC | 0 | -100,00 | 0 | |||||
| 2026-04-30 | 13F | Private Trust Co Na | 0 | -100,00 | 0 | |||||
| 2026-02-11 | 13F | Cerity Partners LLC | 40.593 | 6,14 | 1.250 | 6,66 | ||||
| 2026-02-17 | 13F | Mercer Global Advisors Inc /adv | 26.528 | -7,01 | 817 | -6,52 | ||||
| 2026-04-15 | 13F | Bayforest Capital Ltd | 0 | -100,00 | 0 | |||||
| 2026-02-11 | 13F | Zions Bancorporation, National Association /ut/ | 27 | 0,00 | 1 | |||||
| 2026-04-06 | 13F | Washington Trust Advisors, Inc. | 196 | -18,67 | 5 | -28,57 | ||||
| 2026-02-03 | 13F | Ballentine Partners, LLC | 6.929 | 213 | ||||||
| 2026-02-10 | 13F | Private Wealth Asset Management, LLC | 35 | 0,00 | 1 | 0,00 | ||||
| 2025-11-14 | 13F | Gts Securities Llc | 0 | -100,00 | 0 | -100,00 | ||||
| 2026-02-06 | 13F | Larson Financial Group LLC | 222 | 692,86 | 7 | |||||
| 2026-02-13 | 13F | Verition Fund Management LLC | 0 | -100,00 | 0 | |||||
| 2026-02-13 | 13F | Marshall Wace, Llp | 358.440 | 11.040 | ||||||
| 2026-04-28 | 13F | AdvisorShares Investments LLC | 30.853 | 2,16 | 828 | -11,08 | ||||
| 2026-04-20 | 13F | Jfs Wealth Advisors, Llc | 129 | 0,00 | 3 | 0,00 | ||||
| 2026-02-02 | 13F | Benjamin Edwards Inc | 16.454 | -13,40 | 507 | -13,06 | ||||
| 2026-02-13 | 13F | First Trust Advisors Lp | 1.335.273 | -20,87 | 41.126 | -20,53 | ||||
| 2026-02-17 | 13F | Raymond James Financial Inc | 47.856 | 34,55 | 1.486 | 36,33 | ||||
| 2026-03-04 | 13F | SHP Wealth Management | 21 | 1 | ||||||
| 2026-02-13 | 13F | Parkside Financial Bank & Trust | 334 | 0,00 | 10 | 0,00 | ||||
| 2026-02-13 | 13F | American Century Companies Inc | 431.552 | 15,99 | 13.292 | 16,49 | ||||
| 2026-02-03 | 13F | Gallacher Capital Management LLC | 21.565 | -0,49 | 664 | 0,00 | ||||
| 2026-02-10 | 13F | Bank of New York Mellon Corp | 56.479 | 2,18 | 1.740 | 2,60 | ||||
| 2026-02-13 | 13F | Pinnacle Wealth Planning Services, Inc. | 1.495 | 46 | ||||||
| 2026-02-17 | 13F | Harding Loevner Lp | 3.370.143 | -3,28 | 103.853 | -2,82 | ||||
| 2026-02-13 | 13F | Avidity Partners Management LP | 0 | -100,00 | 0 | |||||
| 2025-11-14 | 13F | Binnacle Investments Inc | 39 | 0,00 | 1 | |||||
| 2026-04-21 | 13F | Vise Technologies, Inc. | 16.544 | 0,00 | 510 | 0,00 | ||||
| 2026-02-10 | 13F | Acadian Asset Management Llc | 1.044 | 0,00 | 0 | |||||
| 2026-02-05 | 13F | Elyxium Wealth, LLC | 201 | 6 | ||||||
| 2026-02-17 | 13F | Paradigm Biocapital Advisors LP | 7.039.834 | 84,44 | 216.827 | 85,22 | ||||
| 2025-11-13 | 13F | Nemes Rush Group LLC | 0 | -100,00 | 0 | -100,00 | ||||
| 2026-02-10 | 13F | Grandfield & Dodd, Llc | 38.098 | -2,64 | 1.173 | -2,25 | ||||
| 2026-04-22 | 13F | Pictet Asset Management Holding SA | 1.077.471 | -1,92 | 28.909 | -14,56 | ||||
| 2026-01-28 | 13F | Financial Perspectives, Inc | 1.333 | 0,00 | 41 | 2,50 | ||||
| 2026-04-24 | 13F | Keybank National Association/oh | 30.530 | -14,56 | 819 | -25,55 | ||||
| 2026-02-11 | 13F | Stirlingshire Investments, Inc. | 13.772 | 424 | ||||||
| 2026-04-08 | 13F | E Fund Management (Hong Kong) Co., Ltd. | 533 | 14 | ||||||
| 2026-01-30 | 13F | Mitsubishi UFJ Trust & Banking Corp | 61.452 | 1,06 | 1.893 | 1,45 | ||||
| 2026-02-12 | 13F | Steward Partners Investment Advisory, Llc | 80 | 0,00 | 2 | 0,00 | ||||
| 2026-04-27 | 13F | Qrg Capital Management, Inc. | 65.822 | 7,45 | 1.766 | -6,36 | ||||
| 2026-04-07 | 13F | Park Avenue Securities Llc | 15.364 | -14,02 | 0 | |||||
| 2026-02-24 | 13F | MidFirst Bank | 1.830 | 56 | ||||||
| 2026-02-12 | 13F | Folketrygdfondet | 174.805 | 0,00 | 5.384 | 0,41 | ||||
| 2026-02-06 | 13F | Vestmark Advisory Solutions, Inc. | 109.358 | 3.368 | ||||||
| 2026-02-09 | 13F | Hartland & Co., LLC | 677 | 67,16 | 21 | 66,67 | ||||
| 2026-02-17 | 13F | Bellevue Group AG | 3.009 | 0,00 | 93 | 0,00 | ||||
| 2026-01-27 | 13F | Regions Financial Corp | 14.783 | 15,43 | 455 | 16,07 | ||||
| 2026-04-27 | 13F | V-Square Quantitative Management LLC | 1.267 | 34 | ||||||
| 2026-04-30 | 13F | Independence Bank of Kentucky | 0 | -100,00 | 0 | |||||
| 2026-04-29 | 13F | American Capital Advisory, LLC | 0 | -100,00 | 0 | |||||
| 2026-02-17 | 13F | Banco Bilbao Vizcaya Argentaria, S.a. | 7.180 | 223 | ||||||
| 2026-02-17 | 13F | Qube Research & Technologies Ltd | 39.455 | 1.215 | ||||||
| 2026-04-30 | 13F | Mv Capital Management, Inc. | 37 | 270,00 | 1 | |||||
| 2026-02-13 | 13F | Flow Traders U.s. Llc | 0 | -100,00 | 0 | |||||
| 2026-02-10 | 13F | Goldman Sachs Group Inc | 1.333.303 | 19,19 | 41.066 | 19,70 | ||||
| 2026-04-07 | 13F | Farther Finance Advisors, LLC | 1.885 | -2,73 | 51 | -13,56 | ||||
| 2026-02-13 | 13F | Mariner, LLC | 55.800 | 17,29 | 1.721 | 17,89 | ||||
| 2026-01-23 | 13F | Assetmark, Inc | 233.852 | 2.423,76 | 7.203 | 2.435,92 | ||||
| 2026-02-09 | 13F | Summitry Llc | 10.603 | 48,54 | 327 | 49,54 | ||||
| 2026-01-30 | 13F | Us Bancorp \de\ | 129.343 | 13,61 | 3.984 | 14,09 | ||||
| 2026-02-17 | 13F | Optiver Holding B.V. | 125.914 | 3.878 | ||||||
| 2026-04-17 | 13F | Brown, Lisle/cummings, Inc. | 77 | 2 | ||||||
| 2026-02-13 | 13F | Transamerica Financial Advisors, Inc. | 152 | 5 | ||||||
| 2026-04-27 | 13F | Ethic Inc. | 21.700 | 5,52 | 582 | -8,06 | ||||
| 2026-02-04 | 13F | Summit Wealth Group Llc / Co | 0 | -100,00 | 0 | -100,00 | ||||
| 2026-02-17 | 13F | Creative Planning | 130.583 | 12,72 | 4.022 | 13,17 | ||||
| 2026-04-22 | 13F | Advocate Investing Services LLC | 0 | -100,00 | 0 | |||||
| 2026-01-27 | 13F | WealthCollab, LLC | 357 | 0,00 | 11 | 0,00 | ||||
| 2026-02-17 | 13F | Advisor Group Holdings, Inc. | 1.236 | -43,69 | 38 | -41,54 | ||||
| 2026-02-19 | 13F | CI Private Wealth, LLC | 17.469 | 10,95 | 535 | 10,79 | ||||
| 2026-01-15 | 13F | Allspring Global Investments Holdings, LLC | 7.131 | 8,16 | 226 | 7,14 | ||||
| 2026-02-11 | 13F | Arrowpoint Investment Partners (Singapore) Pte. Ltd. | 43.228 | 1.331 | ||||||
| 2026-02-17 | 13F | Ancora Advisors, LLC | 638 | 20 | ||||||
| 2026-04-10 | 13F | Abound Wealth Management | 7 | 0,00 | 0 | |||||
| 2026-01-28 | 13F | CAPROCK Group, Inc. | 9.434 | 291 | ||||||
| 2025-11-14 | 13F | Ubs Oconnor Llc | 0 | -100,00 | 0 | -100,00 | ||||
| 2026-01-29 | 13F | UBS Group AG | 184.191 | 124,16 | 5.673 | 125,12 | ||||
| 2026-02-04 | 13F | Madison Asset Management, LLC | 66.491 | 8,13 | 2.048 | 8,59 | ||||
| 2026-01-28 | 13F | Eagle Global Advisors Llc | 249.310 | 1,98 | 7.679 | 2,41 | ||||
| 2026-02-18 | 13F | Vident Advisory, LLC | 39.707 | 11,39 | 1.223 | 11,80 | ||||
| 2026-02-17 | 13F | AIMZ Investment Advisors, LLC | 163.310 | -0,73 | 5.030 | -0,32 | ||||
| 2026-04-06 | 13F | Versant Capital Management, Inc | 13.620 | 27,83 | 365 | 11,28 | ||||
| 2026-04-22 | 13F | Spire Wealth Management | 0 | -100,00 | 0 | |||||
| 2026-02-13 | 13F | Wealth Alliance | 14.104 | -0,35 | 434 | 0,00 | ||||
| 2026-04-30 | 13F | Nisa Investment Advisors, Llc | 16 | 0 | ||||||
| 2026-02-11 | 13F | Syon Capital Llc | 7.492 | 231 | ||||||
| 2026-02-17 | 13F | Cetera Investment Advisers | 83.924 | 13,42 | 2.585 | 13,88 | ||||
| 2026-04-15 | 13F | DAVENPORT & Co LLC | 44.901 | 0,31 | 1.205 | -12,63 | ||||
| 2025-11-13 | 13F | Clear Street Markets Llc | 0 | -100,00 | 0 | -100,00 | ||||
| 2026-04-28 | 13F | Integrated Advisors Network LLC | 7.635 | 205 | ||||||
| 2026-04-17 | 13F | Bell Investment Advisors, Inc | 336 | 15,46 | 9 | 12,50 | ||||
| 2026-02-13 | 13F | Umb Bank N A/mo | 1.123 | 10,86 | 35 | 9,68 | ||||
| 2026-04-06 | 13F | GAMMA Investing LLC | 3.417 | -28,14 | 92 | -37,67 | ||||
| 2026-02-11 | 13F | LPL Financial LLC | 438.018 | 17,98 | 13.491 | 18,48 | ||||
| 2026-04-06 | 13F | Miller Global Investments, LLC | 77 | 0,00 | 2 | 0,00 | ||||
| 2026-02-12 | 13F | Hollencrest Capital Management | 30.931 | 953 | ||||||
| 2026-04-30 | 13F | LRI Investments, LLC | 774 | 32,76 | 21 | 17,65 | ||||
| 2026-01-26 | 13F | Cwm, Llc | 2.739 | 18,78 | 0 | |||||
| 2026-02-13 | 13F | Morgan Stanley | 1.834.439 | 9,55 | 56.501 | 10,01 | ||||
| 2026-02-13 | 13F | Nfj Investment Group, Llc | 0 | -100,00 | 0 | |||||
| 2026-04-21 | 13F | Founders Capital Management | 1.400 | 0,00 | 38 | -13,95 | ||||
| 2026-01-27 | 13F | Proffitt & Goodson Inc | 0 | -100,00 | 0 | |||||
| 2026-02-06 | 13F | Private Wealth Advisors, LLC | 131.653 | -2,55 | 4.055 | -2,15 | ||||
| 2025-11-13 | 13F | Glenmede Investment Management, LP | 14.137 | 2,01 | 434 | 51,40 | ||||
| 2026-02-13 | 13F | Deep Track Capital, LP | 0 | -100,00 | 0 | |||||
| 2026-02-17 | 13F | Bank Of America Corp /de/ | 339.917 | 3,60 | 10.469 | 4,04 | ||||
| 2025-11-06 | 13F | Whipplewood Advisors, LLC | 0 | -100,00 | 0 | |||||
| 2026-02-11 | 13F | Brandywine Global Investment Management, LLC | 1.031.464 | -26,99 | 31.769 | -26,68 | ||||
| 2025-11-14 | 13F | Jane Street Group, Llc | 0 | -100,00 | 0 | -100,00 | ||||
| 2026-04-27 | 13F | Y-Intercept (Hong Kong) Ltd | 44.668 | 1.198 | ||||||
| 2025-12-18 | 13F | Danske Bank A/s | 0 | -100,00 | 0 | |||||
| 2026-02-06 | 13F | EverSource Wealth Advisors, LLC | 3.032 | 39,21 | 93 | 40,91 | ||||
| 2026-02-12 | 13F | Federated Hermes, Inc. | 679.379 | 60,63 | 20.925 | 61,31 | ||||
| 2026-02-06 | 13F | Addison Advisors LLC | 300 | 0,00 | 9 | 0,00 | ||||
| 2025-11-14 | 13F | Wetherby Asset Management Inc | 7.475 | 229 | ||||||
| 2026-03-03 | 13F/A | Caitong International Asset Management Co., Ltd | 2.725 | -62,01 | 84 | -62,10 | ||||
| 2026-02-12 | 13F | Renaissance Technologies Llc | 3.492.850 | 23,79 | 107.580 | 24,32 | ||||
| 2026-02-10 | 13F | Natixis Advisors, L.p. | 83.121 | -57,14 | 3 | -60,00 | ||||
| 2026-02-02 | 13F | Cornerstone Planning Group LLC | 225 | 13,64 | 7 | 40,00 | ||||
| 2026-04-28 | 13F | ORG Wealth Partners, LLC | 300 | 101,34 | 8 | 100,00 | ||||
| 2026-02-17 | 13F | Signature Equity Partners, LLC | 69 | 2 | ||||||
| 2026-02-13 | 13F | Virtus ETF Advisers LLC | 27.495 | 0,00 | 847 | 0,36 | ||||
| 2026-02-12 | 13F | Barometer Capital Management Inc. | 0 | -100,00 | 0 | |||||
| 2026-02-04 | 13F | Community Bank, N.A. | 1.523 | 0,00 | 47 | 0,00 | ||||
| 2026-02-18 | 13F | GWM Advisors LLC | 71 | -94,26 | 2 | -94,59 | ||||
| 2026-02-13 | 13F | Glen Eagle Advisors, LLC | 200 | 6 | ||||||
| 2026-02-10 | 13F | Rothschild Investment Llc | 2.555 | 0,67 | 79 | 1,30 | ||||
| 2026-02-17 | 13F | Fmr Llc | 1.057.340 | -5,57 | 32.566 | -5,17 | ||||
| 2026-02-20 | 13F | Dorsey Wright & Associates | 44.837 | 1.381 | ||||||
| 2026-01-28 | 13F | Salomon & Ludwin, LLC | 241 | 0,00 | 8 | -12,50 | ||||
| 2026-04-28 | 13F | Bogart Wealth, LLC | 146 | 0,00 | 4 | -25,00 | ||||
| 2026-02-12 | 13F | Hrt Financial Lp | 49.232 | -26,43 | 2 | -50,00 | ||||
| 2026-04-15 | 13F | FNY Investment Advisers, LLC | 0 | -100,00 | 0 | |||||
| 2026-02-11 | 13F | Manchester Capital Management LLC | 366 | 11 | ||||||
| 2026-04-08 | 13F | Legacy Wealth Asset Management, LLC | 38.680 | 75,59 | 1.038 | 52,95 | ||||
| 2026-02-20 | 13F/A | Prestige Wealth Management Group LLC | 0 | -100,00 | 0 | |||||
| 2026-02-12 | 13F | Dimensional Fund Advisors Lp | 55.623 | -1,26 | 1.713 | -0,81 | ||||
| 2026-02-12 | 13F | Brown Brothers Harriman & Co | 160 | -87,92 | 5 | -90,00 | ||||
| 2026-01-26 | 13F | Mirae Asset Global Investments Co., Ltd. | 2.840 | 75,20 | 87 | 77,55 | ||||
| 2026-02-13 | 13F | Arrowstreet Capital, Limited Partnership | 4.978.058 | 36,64 | 153.324 | 37,22 | ||||
| 2026-02-17 | 13F | Alliancebernstein L.p. | 10.877.094 | -0,70 | 335.014 | -0,28 | ||||
| 2025-11-12 | 13F | Simplex Trading, Llc | 0 | -100,00 | 0 | |||||
| 2026-02-17 | 13F | Two Sigma Advisers, Lp | 340.000 | -76,27 | 10.472 | -76,17 | ||||
| 2025-11-14 | 13F | Mount Yale Investment Advisors, LLC | 0 | -100,00 | 0 | -100,00 | ||||
| 2026-04-23 | 13F | SJS Investment Consulting Inc. | 0 | -100,00 | 0 | |||||
| 2026-02-12 | 13F | Rossby Financial, LCC | 3.304 | 102 | ||||||
| 2026-02-03 | 13F | NewEdge Wealth, LLC | 13.495 | 13,79 | 416 | 19,94 | ||||
| 2026-02-12 | 13F | BRYN MAWR TRUST Co | 0 | -100,00 | 0 | |||||
| 2026-05-01 | 13F | Diversify Wealth Management, Llc | 46.564 | 1.216 | ||||||
| 2026-02-17 | 13F | Royal Bank Of Canada | 147.498 | 27,05 | 4.543 | 27,58 | ||||
| 2026-04-21 | 13F | PDS Planning, Inc | 7.464 | -9,63 | 200 | -21,26 | ||||
| 2026-04-30 | 13F | Personal Cfo Solutions, Llc | 10.866 | 3,68 | 292 | -9,63 | ||||
| 2026-02-17 | 13F | Old Mission Capital Llc | 78.905 | 2.430 | ||||||
| 2026-02-17 | 13F | Northern Trust Corp | 957.029 | 8,47 | 29.476 | 8,93 | ||||
| 2026-02-13 | 13F | Pin Oak Investment Advisors Inc | 498 | 0,00 | 0 | -100,00 | ||||
| 2026-02-05 | 13F | AlphaCore Capital LLC | 17.984 | -11,99 | 554 | -11,66 | ||||
| 2026-02-12 | 13F | CIBC Private Wealth Group, LLC | 827 | 291,94 | 25 | 316,67 | ||||
| 2026-02-17 | 13F | Quantinno Capital Management LP | 246.910 | 17,67 | 7.605 | 18,17 | ||||
| 2026-02-13 | 13F | Smartleaf Asset Management LLC | 7.904 | 9,81 | 249 | 17,54 | ||||
| 2026-02-17 | 13F | Aqr Capital Management Llc | 82.227 | 11,57 | 2.533 | 12,04 | ||||
| 2026-02-05 | 13F | Allworth Financial LP | 1.170 | 4,00 | 36 | 5,88 | ||||
| 2026-04-29 | 13F | Envestnet Portfolio Solutions, Inc. | 0 | -100,00 | 0 | |||||
| 2026-02-17 | 13F | Tang Capital Management Llc | 0 | -100,00 | 0 | -100,00 | ||||
| 2026-04-15 | 13F | Gf Fund Management Co. Ltd. | 1.313 | 14,37 | 35 | 0,00 | ||||
| 2026-02-13 | 13F | Wells Fargo & Company/mn | 34.152 | 347,90 | 1.052 | 351,07 | ||||
| 2025-11-14 | 13F | Point72 Europe (London) LLP | 107.864 | -77,13 | 3.308 | -66,05 | ||||
| 2026-02-17 | 13F | Scientech Research LLC | 0 | -100,00 | 0 | |||||
| 2026-04-24 | 13F | Yousif Capital Management, Llc | 10.943 | 0,00 | 294 | -14,33 | ||||
| 2026-02-12 | 13F | Federation des caisses Desjardins du Quebec | 50 | 2 | ||||||
| 2026-04-23 | 13F | CWM Advisors, LLC | 1 | 0,00 | 0 | |||||
| 2026-02-13 | 13F | Atlas Capital Advisors Llc | 0 | -100,00 | 0 | |||||
| 2026-02-17 | 13F | Foresight Group Ltd Liability Partnership | 0 | -100,00 | 0 | |||||
| 2026-02-10 | 13F | Bnp Paribas Arbitrage, Sa | 47.638 | 57,36 | 1.467 | 58,08 | ||||
| 2026-02-17 | 13F | XTX Topco Ltd | 35.597 | 16,54 | 1.096 | 17,09 | ||||
| 2026-02-10 | 13F | Nomura Asset Management Co Ltd | 0 | 0 | ||||||
| 2025-11-14 | 13F | Cubist Systematic Strategies, LLC | 29.191 | -92,41 | 895 | -88,73 | ||||
| 2026-02-10 | 13F | Envestnet Asset Management Inc | 806.635 | -0,41 | 24.844 | 0,02 | ||||
| 2026-02-11 | 13F | Jpmorgan Chase & Co | 228.488 | 93,34 | 7.037 | 94,18 | ||||
| 2026-02-09 | 13F | Atlantic Trust, LLC | 0 | -100,00 | 0 | |||||
| 2026-04-27 | 13F | Truist Financial Corp | 42.057 | 9,32 | 1.128 | -4,73 | ||||
| 2026-02-13 | 13F | Sei Investments Co | 74.957 | 3,93 | 2.309 | 4,39 | ||||
| 2026-02-11 | 13F | GW&K Investment Management, LLC | 140 | 0 | ||||||
| 2026-02-13 | 13F | Advyzon Investment Management, LLC | 15.239 | 116,52 | 469 | 118,14 | ||||
| 2026-02-17 | 13F | Voloridge Investment Management, Llc | 84.302 | -35,56 | 2.597 | -35,29 | ||||
| 2026-02-23 | 13F | Beaird Harris Wealth Management, LLC | 3 | 0,00 | 0 | |||||
| 2026-02-13 | 13F | Pathstone Holdings, LLC | 21.510 | 9,15 | 663 | 9,60 | ||||
| 2026-04-27 | 13F | Td Private Client Wealth Llc | 5.200 | -37,80 | 140 | -45,91 | ||||
| 2026-02-04 | 13F | Abc Arbitrage Sa | 105.871 | 3.261 | ||||||
| 2026-02-13 | 13F | OMERS ADMINISTRATION Corp | 0 | -100,00 | 0 | |||||
| 2026-02-17 | 13F | Millennium Management Llc | 94.573 | 4,03 | 2.913 | 4,45 | ||||
| 2025-11-12 | 13F | NewSquare Capital LLC | 0 | -100,00 | 0 | |||||
| 2026-02-13 | 13F | MAI Capital Management | 307 | 8,48 | 9 | 12,50 | ||||
| 2026-02-17 | 13F | Fred Alger Management, Llc | 130.470 | 4.018 | ||||||
| 2026-01-29 | 13F | Sanctuary Advisors, LLC | 68.758 | 18,72 | 2.118 | 19,20 | ||||
| 2026-01-23 | 13F | Rsm Us Wealth Management Llc | 25.105 | -14,50 | 791 | -12,22 | ||||
| 2026-02-13 | 13F | Cornerstone Financial Management LLC | 71 | 2 | ||||||
| 2026-02-13 | 13F | Headlands Technologies LLC | 7.054 | -15,87 | 217 | -15,56 | ||||
| 2026-04-28 | 13F | SBI Securities Co., Ltd. | 370 | -83,66 | 10 | -86,96 | ||||
| 2026-02-11 | 13F | O'shaughnessy Asset Management, Llc | 15.122 | 65,36 | 466 | 66,07 | ||||
| 2026-02-13 | 13F | Neuberger Berman Group LLC | 56.921 | 22,97 | 1.753 | 23,54 | ||||
| 2025-11-13 | 13F | Deutsche Bank Ag\ | 0 | -100,00 | 0 | |||||
| 2026-05-01 | 13F | Hantz Financial Services, Inc. | 21.996 | -4,78 | 1 | |||||
| 2026-02-11 | 13F | Group One Trading, L.p. | 29.499 | 909 | ||||||
| 2026-02-13 | 13F | Rhumbline Advisers | 37.062 | 131,43 | 1.142 | 132,38 | ||||
| 2026-02-14 | 13F | Rockefeller Capital Management L.P. | 12.572 | 472,50 | 387 | 477,61 | ||||
| 2026-02-12 | 13F | Jane Street Group, Llc | Call | 39.400 | 138,79 | 1.214 | 139,72 | |||
| 2026-04-30 | 13F | Sequoia Financial Advisors, LLC | 27.136 | -16,08 | 728 | -26,83 | ||||
| 2026-02-12 | 13F | Jane Street Group, Llc | Put | 15.800 | 487 | |||||
| 2025-11-14 | 13F | Point72 Asia (Singapore) Pte. Ltd. | 0 | -100,00 | 0 | |||||
| 2026-02-17 | 13F | Two Sigma Investments, Lp | 895.843 | -35,61 | 27.592 | -35,34 | ||||
| 2026-02-17 | 13F | Ameriprise Financial Inc | 61.490 | 3,91 | 1.894 | 4,36 | ||||
| 2026-02-11 | 13F | Parallel Advisors, LLC | 4.202 | 1,52 | 129 | 2,38 | ||||
| 2026-02-03 | 13F | RFG Advisory, LLC | 0 | -100,00 | 0 | |||||
| 2026-02-13 | 13F | Charles Schwab Investment Management Inc | 110.799 | 9,51 | 3.413 | 9,96 | ||||
| 2026-01-22 | 13F/A | Cresset Asset Management, LLC | 0 | -100,00 | 0 | |||||
| 2026-04-30 | 13F | Cromwell Holdings LLC | 1.077 | -29,65 | 29 | -40,43 | ||||
| 2026-04-07 | 13F | Signaturefd, Llc | 15.780 | 4,72 | 423 | -8,84 | ||||
| 2026-02-17 | 13F | Snowden Capital Advisors LLC | 8.061 | 19,05 | 248 | 19,81 | ||||
| 2026-02-17 | 13F | Balyasny Asset Management Llc | 379.364 | 11.684 | ||||||
| 2026-02-06 | 13F | Cullen/frost Bankers, Inc. | 95 | 26,67 | 3 | 0,00 | ||||
| 2026-04-30 | 13F | First Horizon Corp | 940 | -1,67 | 25 | -13,79 | ||||
| 2026-02-11 | 13F | Dorsey & Whitney Trust CO LLC | 8.086 | 0,06 | 249 | 0,81 | ||||
| 2026-02-13 | 13F | Strategic Global Advisors, LLC | 0 | -100,00 | 0 | |||||
| 2026-02-13 | 13F | Hudson Bay Capital Management LP | 325.000 | 22,64 | 10.010 | 23,17 | ||||
| 2026-02-17 | 13F | Boothbay Fund Management, Llc | 0 | -100,00 | 0 | |||||
| 2026-04-28 | 13F | Flagship Harbor Advisors, Llc | 0 | -100,00 | 0 | |||||
| 2026-04-02 | 13F | Ares Financial Consulting, LLC | 363 | 10 | ||||||
| 2026-04-16 | 13F | Everstar Asset Management, LLC | 0 | -100,00 | 0 | |||||
| 2026-02-17 | 13F | Ninepoint Partners LP | 67 | 2 | ||||||
| 2026-02-17 | 13F | Capital Fund Management S.a. | 0 | -100,00 | 0 | |||||
| 2026-04-28 | 13F | China Universal Asset Management Co., Ltd. | 11.424 | 19,94 | 307 | 4,44 | ||||
| 2026-02-17 | 13F | Jones Financial Companies Lllp | 1.844 | -5,48 | 57 | 0,00 | ||||
| 2026-04-14 | 13F | Nbc Securities, Inc. | 47 | 0,00 | 1 | 0,00 | ||||
| 2026-02-18 | 13F | Mackenzie Financial Corp | 0 | -100,00 | 0 | |||||
| 2026-04-24 | 13F | Stegent Equity Advisors, Inc. | 0 | -100,00 | 0 | |||||
| 2025-11-14 | 13F | Jain Global LLC | 0 | -100,00 | 0 | |||||
| 2026-02-17 | 13F | Ikarian Capital, LLC | 0 | -100,00 | 0 | |||||
| 2026-04-20 | 13F | Kestra Private Wealth Services, Llc | 0 | -100,00 | 0 | |||||
| 2026-04-28 | 13F | SBI Okasan Asset Management Co.Ltd. | 25.600 | 23,67 | 661 | -1,78 | ||||
| 2026-02-09 | 13F | Huntington National Bank | 360 | -41,56 | 11 | -38,89 | ||||
| 2026-02-17 | 13F | Woodline Partners LP | 369.188 | -19,60 | 11.371 | -19,26 |
Other Listings
| US:GMAB | 26,46 $ |