Grundlæggende statistik
| Institutionelle ejere | 162 total, 162 long only, 0 short only, 0 long/short - change of -4,71% MRQ |
| Del pris | 27,00 |
| Gennemsnitlig porteføljeallokering | 0.1656 % - change of -11,59% MRQ |
| Institutionelle aktier (lange) | 23.352.610 (ex 13D/G) - change of -2,22MM shares -8,68% MRQ |
| Institutionel værdi (lang) | $ 690.764 USD ($1000) |
Institutionelt ejerskab og aktionærer
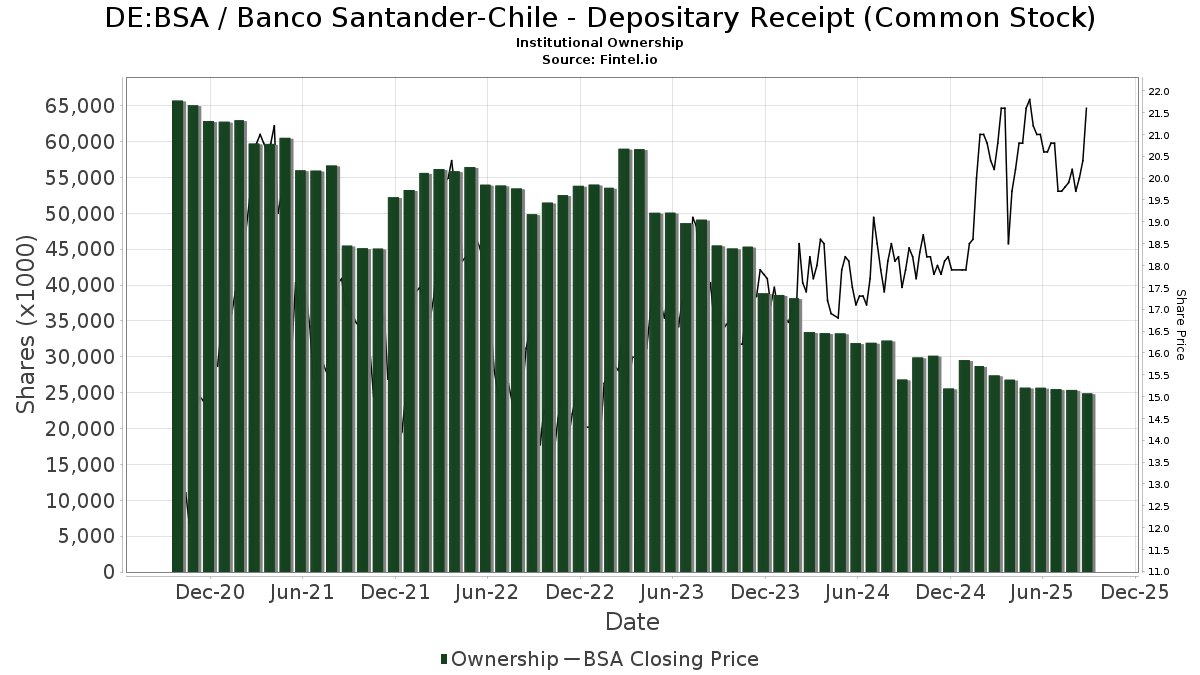
Banco Santander-Chile - Depositary Receipt (Common Stock) (DE:BSA) har 162 institutionelle ejere og aktionærer, der har indsendt 13D/G- eller 13F-formularer til Securities Exchange Commission (SEC). Disse institutioner har i alt 23,352,610 aktier. Største aktionærer omfatter Franklin Resources Inc, Jpmorgan Chase & Co, Vanguard Group Inc, USS Investment Management Ltd, Allspring Global Investments Holdings, LLC, BlackRock, Inc., INCA Investments LLC, EMGAX - Wells Fargo Emerging Markets Equity Fund Class A, RWC Asset Management LLP, and VGTSX - Vanguard Total International Stock Index Fund Investor Shares .
Banco Santander-Chile - Depositary Receipt (Common Stock) (DB:BSA) institutionel ejerskabsstruktur viser aktuelle positioner i virksomheden efter institutioner og fonde, samt seneste ændringer i positionsstørrelse. Større aktionærer kan omfatte individuelle investorer, investeringsforeninger, hedgefonde eller institutioner. Skema 13D angiver, at investoren besidder (eller besidder) mere end 5 % af virksomheden og har til hensigt (eller har til hensigt at) aktivt at forfølge en ændring i forretningsstrategi. Skema 13G indikerer en passiv investering på over 5%.
The share price as of March 10, 2026 is 27,00 / share. Previously, on March 11, 2025, the share price was 20,20 / share. This represents an increase of 33,66% over that period.
Fondens stemningsscore
Fund Sentiment Score (fka Ownership Accumulation Score) finder de aktier, der bliver mest købt af fonde. Det er resultatet af en sofistikeret, multi-faktor kvantitativ model, der identificerer virksomheder med de højeste niveauer af institutionel akkumulering. Scoringsmodellen bruger en kombination af den samlede stigning i oplyste ejere, ændringerne i porteføljeallokeringer i disse ejere og andre målinger. Tallet går fra 0 til 100, hvor højere tal indikerer et højere niveau af akkumulering for sine jævnaldrende, og 50 er gennemsnittet.
Opdateringsfrekvens: Dagligt
Se Ownership Explorer, som giver en liste over højest rangerende virksomheder.
AI+ Ask Fintel’s AI assistant about Banco Santander-Chile - Depositary Receipt (Common Stock).
Select a question to share a public post with an AI-crafted answer.
Thinking of good questions…
13F og NPORT arkivering
Detaljer om 13F-arkivering er gratis. Detaljer om NP-ansøgninger kræver et premium-medlemskab. Grønne rækker angiver nye positioner. Røde rækker angiver lukkede positioner. Klik på linket ikon for at se den fulde transaktionshistorik.
Opgrader
for at låse premium-data op og eksportere til Excel ![]() .
.
| Fil dato | Kilde | Investor | Type | Gennemsnitlig pris (Øst) |
Aktier | Δ Aktier (%) |
Rapporteret Værdi ($1000) |
Δ Værdi (%) |
Port Alloc (%) |
|
|---|---|---|---|---|---|---|---|---|---|---|
| 2025-09-25 | NP | VEU - Vanguard FTSE All-World ex-US Index Fund ETF Shares | 232.369 | -1,86 | 5.347 | -6,26 | ||||
| 2026-01-27 | 13F | WealthCollab, LLC | 222 | 0,00 | 7 | 20,00 | ||||
| 2026-02-11 | 13F | Simplex Trading, Llc | 1.168 | 16,80 | 36 | |||||
| 2025-11-12 | 13F | Fox Run Management, L.l.c. | 0 | -100,00 | 0 | |||||
| 2026-02-06 | 13F | Global Retirement Partners, LLC | 6.755 | 11.750,88 | 210 | 20.900,00 | ||||
| 2026-01-23 | 13F | Westside Investment Management, Inc. | 44 | 1 | ||||||
| 2025-09-25 | NP | JNBAX - JPMorgan Income Builder Fund Class A | 19.195 | 0,00 | 442 | -4,55 | ||||
| 2026-02-04 | 13F | INCA Investments LLC | 1.064.274 | 48,81 | 33.110 | 74,70 | ||||
| 2026-02-05 | 13F | DnB Asset Management AS | 176.088 | -29,46 | 5.478 | -17,15 | ||||
| 2026-02-12 | 13F | Quadrant Capital Group Llc | 18.767 | 227,12 | 584 | 283,55 | ||||
| 2026-02-03 | 13F | Ethic Inc. | 38.858 | 38,78 | 1.209 | 62,80 | ||||
| 2025-10-08 | 13F/A | New York State Common Retirement Fund | 0 | -100,00 | 0 | -100,00 | ||||
| 2026-02-03 | 13F | Encompass More Asset Management | 0 | -100,00 | 0 | |||||
| 2025-11-14 | 13F | Two Sigma Advisers, Lp | 0 | -100,00 | 0 | |||||
| 2026-02-19 | 13F | Invesco Ltd. | 43.551 | 18,33 | 1.355 | 38,87 | ||||
| 2026-02-10 | 13F | Goldman Sachs Group Inc | 77.303 | 5,10 | 2.405 | 23,35 | ||||
| 2026-01-22 | 13F | Financial Consulate, Inc | 9 | 0 | ||||||
| 2026-02-11 | 13F | Parallel Advisors, LLC | 2.819 | 5,34 | 88 | 24,29 | ||||
| 2026-01-26 | 13F | KBC Group NV | 12.788 | 0,00 | 0 | |||||
| 2026-02-13 | 13F | Ubs Oconnor Llc | 0 | -100,00 | 0 | |||||
| 2026-02-17 | 13F | Millennium Management Llc | 271.827 | 221,02 | 8.457 | 277,00 | ||||
| 2025-11-12 | 13F | NewSquare Capital LLC | 0 | -100,00 | 0 | |||||
| 2026-02-12 | 13F | Brown Brothers Harriman & Co | 1 | 0 | ||||||
| 2026-01-27 | 13F | GHP Investment Advisors, Inc. | 915 | 0,00 | 28 | 16,67 | ||||
| 2026-01-29 | 13F | Vanguard Group Inc | 1.599.117 | 0,36 | 49.749 | 17,81 | ||||
| 2026-02-17 | 13F | Edmond De Rothschild Holding S.a. | 23.688 | -26,18 | 737 | -13,41 | ||||
| 2026-02-17 | 13F | Two Sigma Investments, Lp | 47.412 | -25,08 | 1.475 | -12,05 | ||||
| 2026-02-13 | 13F | PCM Encore, LLC | 8.410 | 262 | ||||||
| 2026-02-13 | 13F | MAI Capital Management | 26 | 0,00 | 1 | |||||
| 2025-09-25 | NP | DFA INVESTMENT DIMENSIONS GROUP INC - Emerging Markets Social Core Equity Portfolio Shares | 4.755 | 0,00 | 109 | -4,39 | ||||
| 2026-02-12 | 13F | Rossby Financial, LCC | 1 | 0,00 | 0 | |||||
| 2025-11-05 | 13F | Savant Capital, LLC | 0 | -100,00 | 0 | -100,00 | ||||
| 2026-01-29 | 13F | UBS Group AG | 78.855 | 69,37 | 2.453 | 98,95 | ||||
| 2026-02-13 | 13F | SRS Capital Advisors, Inc. | 381 | 1.170,00 | 12 | |||||
| 2026-02-13 | 13F | Rhumbline Advisers | 13.439 | 0,00 | 418 | 17,42 | ||||
| 2026-02-13 | 13F | Focused Alpha, Llc | 8.990 | 280 | ||||||
| 2026-02-17 | 13F | Royal Bank Of Canada | 170 | 117,95 | 5 | 150,00 | ||||
| 2025-11-14 | 13F | Susquehanna International Group, Llp | 0 | -100,00 | 0 | |||||
| 2026-02-12 | 13F | Brinker Capital Investments, LLC | 34.537 | -7,36 | 1.074 | 8,81 | ||||
| 2025-09-25 | NP | EMRSX - JPMorgan Emerging Markets Research Enhanced Equity Fund Class R6 | 143.403 | -37,43 | 3.300 | -40,25 | ||||
| 2026-02-17 | 13F | Engineers Gate Manager LP | 0 | -100,00 | 0 | |||||
| 2026-01-12 | 13F | Abound Wealth Management | 0 | -100,00 | 0 | |||||
| 2025-09-25 | NP | DFA INVESTMENT DIMENSIONS GROUP INC - Emerging Markets Sustainability Core 1 Portfolio Institutional Class This fund is a listed as child fund of Dimensional Fund Advisors Lp and if that institution has disclosed ownership in this security, then these positions will not be double counted when calculating total shares and total value | 7.781 | 0,00 | 179 | -4,28 | ||||
| 2025-09-25 | NP | DFCEX - Emerging Markets Core Equity Portfolio - Institutional Class This fund is a listed as child fund of Dimensional Fund Advisors Lp and if that institution has disclosed ownership in this security, then these positions will not be double counted when calculating total shares and total value | 286.879 | 0,00 | 6.601 | -4,47 | ||||
| 2025-09-25 | NP | DEXC - Dimensional Emerging Markets ex China Core Equity ETF | 2.370 | 19,88 | 55 | 14,89 | ||||
| 2026-02-12 | 13F | Banco BTG Pactual S.A. | 26.000 | 809 | ||||||
| 2026-02-13 | 13F | Resources Investment Advisors, LLC. | 6.754 | 210 | ||||||
| 2025-09-25 | NP | EMGAX - Wells Fargo Emerging Markets Equity Fund Class A | 1.060.492 | -2,75 | 24.402 | -7,11 | ||||
| 2026-02-05 | 13F | Thrivent Financial For Lutherans | 27.310 | 89,96 | 1 | |||||
| 2026-02-11 | 13F | Syon Capital Llc | 8.413 | 262 | ||||||
| 2025-11-12 | 13F | William Blair Investment Management, Llc | 0 | -100,00 | 0 | |||||
| 2026-02-10 | 13F/A | Northwestern Mutual Wealth Management Co | 676 | 0,00 | 21 | 23,53 | ||||
| 2026-02-10 | 13F | Eurizon Capital SGR S.p.A. | 22.914 | 713 | ||||||
| 2025-11-07 | 13F | Sierra Ocean, Llc | 0 | -100,00 | 0 | |||||
| 2026-02-12 | 13F | Renaissance Technologies Llc | 626.218 | 8,71 | 19.482 | 27,63 | ||||
| 2026-01-21 | 13F | Yousif Capital Management, Llc | 7.298 | 240 | ||||||
| 2026-01-14 | 13F | Jfs Wealth Advisors, Llc | 112 | 0,00 | 3 | 50,00 | ||||
| 2026-02-06 | 13F | Larson Financial Group LLC | 166 | 0,00 | 5 | 25,00 | ||||
| 2026-01-23 | 13F | Robeco Institutional Asset Management B.V. | 763.326 | -8,33 | 23.747 | 7,62 | ||||
| 2025-11-14 | 13F | Cubist Systematic Strategies, LLC | 0 | -100,00 | 0 | |||||
| 2026-02-12 | 13F | Skopos Labs, Inc. | 24.199 | 47,07 | 757 | 73,62 | ||||
| 2026-02-12 | 13F | BRYN MAWR TRUST Co | 0 | -100,00 | 0 | |||||
| 2026-01-29 | 13F | Quent Capital, LLC | 194 | 0,00 | 6 | 20,00 | ||||
| 2026-02-17 | 13F | Graham Capital Management, L.P. | 12.668 | 394 | ||||||
| 2026-02-17 | 13F | Public Employees Retirement System Of Ohio | 17.525 | -23,38 | 545 | -10,07 | ||||
| 2026-02-13 | 13F | Parkside Financial Bank & Trust | 49 | 0,00 | 2 | 0,00 | ||||
| 2025-10-30 | 13F | Twin Peaks Wealth Advisors, LLC | 0 | -100,00 | 0 | |||||
| 2025-11-14 | 13F | Dark Forest Capital Management Lp | 17.949 | 0,00 | 453 | 0,00 | ||||
| 2026-02-17 | 13F | Fmr Llc | 9.804 | -1,61 | 305 | 15,53 | ||||
| 2026-01-23 | 13F | Sumitomo Mitsui Trust Holdings, Inc. | 42.969 | -17,63 | 1.337 | -3,33 | ||||
| 2026-02-10 | 13F | Connor, Clark & Lunn Investment Management Ltd. | 226.966 | -21,48 | 7.061 | -7,82 | ||||
| 2026-02-13 | 13F | JustInvest LLC | 25.225 | 9,71 | 785 | 28,74 | ||||
| 2026-02-06 | 13F | Pnc Financial Services Group, Inc. | 10.874 | -5,20 | 338 | 11,55 | ||||
| 2025-11-14 | 13F | XTX Topco Ltd | 0 | -100,00 | 0 | -100,00 | ||||
| 2026-01-16 | 13F | Standard Life Aberdeen plc | 405.588 | -43,04 | 12.618 | -32,33 | ||||
| 2026-01-14 | 13F | Hennion & Walsh Asset Management, Inc. | 11.087 | 345 | ||||||
| 2026-02-13 | 13F | Caitong International Asset Management Co., Ltd | 594 | 5.300,00 | 18 | |||||
| 2026-01-08 | 13F | True Wealth Design, LLC | 75 | 0,00 | 2 | 100,00 | ||||
| 2026-02-17 | 13F | Tower Research Capital LLC (TRC) | 347 | -50,07 | 11 | -44,44 | ||||
| 2026-02-13 | 13F | Atlas Capital Advisors Llc | 6.676 | -15,46 | 208 | 4,02 | ||||
| 2026-02-10 | 13F | Acadian Asset Management Llc | 51.408 | 2 | ||||||
| 2025-09-25 | NP | DFAE - Dimensional Emerging Core Equity Market ETF | 50.672 | 27,26 | 1.166 | 21,48 | ||||
| 2026-01-26 | 13F | Mirae Asset Global Investments Co., Ltd. | 2.940 | 6,02 | 91 | 24,66 | ||||
| 2026-02-17 | 13F | Qube Research & Technologies Ltd | 545.480 | 3,79 | 16.970 | 21,84 | ||||
| 2025-11-13 | 13F | Quadrature Capital Ltd | 0 | -100,00 | 0 | |||||
| 2025-09-25 | NP | DFSE - Dimensional Emerging Markets Sustainability Core 1 ETF | 4.314 | 0,00 | 99 | -3,88 | ||||
| 2026-02-17 | 13F | Quantinno Capital Management LP | 66.095 | 33,99 | 2.056 | 57,31 | ||||
| 2025-09-25 | NP | DFEM - Dimensional Emerging Markets Core Equity 2 ETF | 16.113 | 5,09 | 371 | 0,27 | ||||
| 2026-02-02 | 13F | Advisors Preferred, LLC | 20.272 | 632 | ||||||
| 2025-09-25 | NP | VT - Vanguard Total World Stock Index Fund ETF Shares | 27.100 | 0,00 | 624 | -4,45 | ||||
| 2026-02-13 | 13F | Sei Investments Co | 133.243 | -29,12 | 4.145 | -16,78 | ||||
| 2026-02-17 | 13F | Henry James International Management Inc. | 51.002 | -0,05 | 1.587 | 17,31 | ||||
| 2026-01-23 | 13F | Farther Finance Advisors, LLC | 1.511 | 199,80 | 47 | 261,54 | ||||
| 2026-02-12 | 13F | Dimensional Fund Advisors Lp | 585.760 | 3,40 | 18.226 | 21,44 | ||||
| 2026-01-23 | 13F | Assetmark, Inc | 75 | 0,00 | 2 | 100,00 | ||||
| 2025-11-13 | 13F | Marshall Wace, Llp | 0 | -100,00 | 0 | |||||
| 2025-09-25 | NP | PRLAX - T. Rowe Price Latin America Fund This fund is a listed as child fund of Price T Rowe Associates Inc /md/ and if that institution has disclosed ownership in this security, then these positions will not be double counted when calculating total shares and total value | 218.550 | 0,00 | 5.029 | -4,48 | ||||
| 2026-02-10 | 13F | Natixis Advisors, L.p. | 0 | -100,00 | 0 | |||||
| 2026-02-12 | 13F | Advisors Asset Management, Inc. | 3.398 | 29,10 | 106 | 52,17 | ||||
| 2026-02-17 | 13F | Bank Of America Corp /de/ | 294.128 | -6,74 | 9.150 | 9,49 | ||||
| 2026-02-05 | 13F | Allworth Financial LP | 266 | 18,75 | 8 | 60,00 | ||||
| 2026-01-30 | 13F | Mitsubishi UFJ Trust & Banking Corp | 62.876 | 28,79 | 1.957 | 51,35 | ||||
| 2026-02-17 | 13F | Jump Financial, LLC | 44.120 | 1.373 | ||||||
| 2026-02-17 | 13F | SageView Advisory Group, LLC | 54 | 2 | ||||||
| 2025-09-25 | NP | TWAAX - Thrivent International Allocation Fund Class A | 1.715 | -21,90 | 39 | -7,14 | ||||
| 2026-02-17 | 13F | Russell Investments Group, Ltd. | 10.859 | 0,00 | 338 | 17,42 | ||||
| 2026-02-18 | 13F | Vident Advisory, LLC | 32.634 | 6,55 | 1.015 | 25,15 | ||||
| 2025-12-01 | 13F/A | Cantor Fitzgerald, L. P. | 0 | -100,00 | 0 | -100,00 | ||||
| 2026-01-26 | 13F | Private Trust Co Na | 50 | 0,00 | 2 | 0,00 | ||||
| 2026-01-30 | 13F | Us Bancorp \de\ | 634 | 7,82 | 20 | 26,67 | ||||
| 2025-11-14 | 13F | Aquatic Capital Management LLC | 0 | -100,00 | 0 | |||||
| 2026-01-20 | 13F | Signaturefd, Llc | 1.977 | 0,00 | 62 | 17,31 | ||||
| 2025-09-25 | NP | DEHP - Dimensional Emerging Markets High Profitability ETF | 11.395 | 2.748,75 | 262 | 2.811,11 | ||||
| 2026-01-14 | 13F | Spire Wealth Management | 0 | -100,00 | 0 | |||||
| 2026-02-09 | 13F | Hantz Financial Services, Inc. | 20.499 | 39,24 | 1 | |||||
| 2026-02-12 | 13F | Qtron Investments LLC | 0 | -100,00 | 0 | |||||
| 2026-02-13 | 13F | Mariner, LLC | 32.148 | 4,80 | 1.000 | 23,15 | ||||
| 2026-02-24 | 13F | Bell Investment Advisors, Inc | 76 | 85,37 | 2 | 100,00 | ||||
| 2025-11-14 | 13F | National Bank Of Canada /fi/ | 0 | -100,00 | 0 | |||||
| 2026-02-17 | 13F | Laird Norton Trust Company, Llc | 17.061 | 531 | ||||||
| 2026-01-15 | 13F | Allspring Global Investments Holdings, LLC | 1.285.616 | -32,24 | 40.111 | -20,07 | ||||
| 2026-02-13 | 13F | Smartleaf Asset Management LLC | 1.486 | 739,55 | 47 | 1.050,00 | ||||
| 2026-01-27 | 13F | Zurcher Kantonalbank (Zurich Cantonalbank) | 136.278 | 13,61 | 4.240 | 33,39 | ||||
| 2026-02-17 | 13F | Citadel Advisors Llc | 99.792 | -18,82 | 3.105 | -4,70 | ||||
| 2025-11-13 | 13F | Riggs Asset Managment Co. Inc. | 0 | -100,00 | 0 | |||||
| 2026-02-13 | 13F | Verition Fund Management LLC | 12.712 | -72,84 | 395 | -68,15 | ||||
| 2026-02-13 | 13F | Wells Fargo & Company/mn | 3.949 | 22,72 | 123 | 43,53 | ||||
| 2026-02-10 | 13F | Bnp Paribas Arbitrage, Sa | 18.170 | 363.300,00 | 565 | |||||
| 2026-02-03 | 13F | Sequoia Financial Advisors, LLC | 7.027 | 219 | ||||||
| 2026-02-17 | 13F | Advisor Group Holdings, Inc. | 571 | 4,96 | 18 | 21,43 | ||||
| 2025-09-25 | NP | Thrivent Core Funds - Thrivent Core Emerging Markets Equity Fund | 12.662 | -31,59 | 291 | -19,39 | ||||
| 2026-02-03 | 13F | SBI Securities Co., Ltd. | 110.371 | -1,22 | 3.434 | 15,98 | ||||
| 2026-02-11 | 13F | Jpmorgan Chase & Co | 2.471.398 | -20,62 | 76.885 | -6,81 | ||||
| 2026-02-17 | 13F | Seldon Capital Lp | 7.943 | 0,00 | 247 | 17,62 | ||||
| 2026-02-14 | 13F | Rockefeller Capital Management L.P. | 373 | 492,06 | 12 | 1.000,00 | ||||
| 2025-09-25 | NP | DAADX - Emerging Markets ex China Core Equity Portfolio Institutional Class | 8.394 | 0,00 | 193 | -4,46 | ||||
| 2026-02-13 | 13F | Ubs Asset Management Americas Inc | 395 | 12 | ||||||
| 2026-02-17 | 13F | Aqr Capital Management Llc | 16.165 | -68,94 | 503 | -63,60 | ||||
| 2026-01-26 | 13F | Cwm, Llc | 1.079 | -17,95 | 0 | |||||
| 2025-09-25 | NP | DFAX - Dimensional World ex U.S. Core Equity 2 ETF | 7.208 | 18,13 | 166 | 13,01 | ||||
| 2026-02-17 | 13F | FIL Ltd | 128.029 | 0,00 | 3.983 | 17,39 | ||||
| 2026-02-17 | 13F | Price T Rowe Associates Inc /md/ | 134.397 | -23,74 | 4 | 0,00 | ||||
| 2026-01-30 | 13F | Cardinal Capital Management | 102.880 | 0,77 | 3.201 | 18,30 | ||||
| 2026-02-10 | 13F | Nomura Asset Management Co Ltd | 20.700 | 0,00 | 644 | 17,34 | ||||
| 2026-02-05 | 13F | Abacus Wealth Partners, LLC | 13.476 | 419 | ||||||
| 2026-01-23 | 13F | TT International Asset Management LTD | 550.315 | -40,92 | 17 | -99,94 | ||||
| 2025-09-25 | NP | VGTSX - Vanguard Total International Stock Index Fund Investor Shares | 775.887 | 0,00 | 17.853 | -4,48 | ||||
| 2025-09-25 | NP | DFA INVESTMENT DIMENSIONS GROUP INC - World ex U.S. Core Equity Portfolio Institutional Class Shares | 600 | 0,00 | 14 | -7,14 | ||||
| 2026-01-30 | 13F | R Squared Ltd | 7.638 | -45,85 | 238 | -36,46 | ||||
| 2026-01-26 | 13F | Patriot Financial Group Insurance Agency, LLC | 7.560 | -5,50 | 235 | 10,85 | ||||
| 2026-02-13 | 13F | Arrowstreet Capital, Limited Partnership | 410.258 | 61,15 | 12.763 | 89,19 | ||||
| 2026-02-13 | 13F | USS Investment Management Ltd | 1.561.544 | 45,55 | 48.603 | 71,11 | ||||
| 2025-09-26 | NP | UBPIX - Ultralatin America Profund Investor Class | 3.520 | 14,06 | 81 | 8,11 | ||||
| 2025-11-06 | 13F | Candriam Luxembourg S.C.A. | 0 | -100,00 | 0 | |||||
| 2026-02-13 | 13F | Pinnacle Wealth Planning Services, Inc. | 1.981 | 62 | ||||||
| 2026-02-13 | 13F | State Street Corp | 421.349 | -1,11 | 13.108 | 16,09 | ||||
| 2026-01-16 | 13F | Ronald Blue Trust, Inc. | 16.904 | -6,72 | 526 | 9,38 | ||||
| 2026-02-02 | 13F | Strs Ohio | 111.648 | -14,86 | 3.473 | -0,03 | ||||
| 2026-02-09 | 13F | Genus Capital Management Inc. | 8.003 | -19,99 | 249 | -6,42 | ||||
| 2026-01-27 | 13F | TD Waterhouse Canada Inc. | 10.540 | -9,33 | 328 | 6,51 | ||||
| 2026-02-11 | 13F | Allianz Asset Management GmbH | 0 | -100,00 | 0 | |||||
| 2026-01-05 | 13F | GAMMA Investing LLC | 735 | 31,48 | 23 | 57,14 | ||||
| 2026-02-18 | 13F | GWM Advisors LLC | 170 | 0,00 | 5 | 25,00 | ||||
| 2025-09-25 | NP | VEIEX - Vanguard Emerging Markets Stock Index Fund Investor Shares | 474.037 | 0,00 | 10.908 | -4,48 | ||||
| 2026-02-13 | 13F | Neuberger Berman Group LLC | 68.149 | 0,59 | 2.127 | 18,89 | ||||
| 2026-02-11 | 13F | RWC Asset Management LLP | 806.568 | -5,21 | 25.092 | 11,28 | ||||
| 2025-09-25 | NP | Dfa Investment Trust Co - The Emerging Markets Series This fund is a listed as child fund of Dimensional Fund Advisors Lp and if that institution has disclosed ownership in this security, then these positions will not be double counted when calculating total shares and total value | 83.901 | 8,19 | 1.931 | 3,32 | ||||
| 2026-02-12 | 13F | BlackRock, Inc. | 1.116.573 | 27,62 | 34.737 | 49,82 | ||||
| 2026-02-17 | 13F | Jones Financial Companies Lllp | 113 | 59,15 | 4 | 200,00 | ||||
| 2026-02-19 | 13F | CI Private Wealth, LLC | 9.385 | 231 | ||||||
| 2025-11-14 | 13F | D. E. Shaw & Co., Inc. | 0 | -100,00 | 0 | |||||
| 2026-01-08 | 13F | Tuttle Tactical Management LLC | 6.767 | 211 | ||||||
| 2026-02-17 | 13F | Ancora Advisors, LLC | 8 | 0 | ||||||
| 2026-01-23 | 13F | Deprince Race & Zollo Inc | 108.284 | 3.369 | ||||||
| 2026-02-03 | 13F | Ballentine Partners, LLC | 8.824 | -18,17 | 275 | -3,86 | ||||
| 2026-02-12 | 13F | Jane Street Group, Llc | 0 | -100,00 | 0 | |||||
| 2025-11-14 | 13F | Point72 Asset Management, L.P. | 0 | -100,00 | 0 | |||||
| 2025-11-14 | 13F | Binnacle Investments Inc | 294 | 0,00 | 8 | 0,00 | ||||
| 2025-10-02 | 13F | Investors Research Corp | 0 | -100,00 | 0 | |||||
| 2026-02-12 | 13F | Sit Investment Associates Inc | 0 | -100,00 | 0 | |||||
| 2026-02-11 | 13F | Franklin Resources Inc | 3.110.882 | -0,27 | 96.780 | 17,08 | ||||
| 2026-02-13 | 13F | Citigroup Inc | 36.377 | 26,01 | 1.132 | 47,84 | ||||
| 2025-10-22 | 13F | Geneos Wealth Management Inc. | 0 | -100,00 | 0 | |||||
| 2026-02-13 | 13F | Morgan Stanley | 511.923 | -13,44 | 15.926 | 1,61 | ||||
| 2026-02-09 | 13F | Legal & General Group Plc | 4.647 | 0,00 | 145 | 17,07 | ||||
| 2026-02-13 | 13F | American Century Companies Inc | 396.627 | 25,55 | 12.339 | 47,40 | ||||
| 2026-02-17 | 13F | Northern Trust Corp | 162.541 | 3,91 | 5.057 | 21,98 | ||||
| 2026-02-03 | 13F | Crossmark Global Holdings, Inc. | 6.833 | -19,75 | 213 | -5,78 | ||||
| 2026-01-29 | 13F | Sava Infond d.o.o. | 20.000 | 53,85 | 622 | 80,81 | ||||
| 2026-01-29 | 13F | Pictet Asset Management Holding SA | 14.521 | 0,00 | 452 | 17,45 | ||||
| 2026-02-12 | 13F | Raiffeisen Bank International AG | 6.200 | 194 | ||||||
| 2026-02-13 | 13F | Barclays Plc | 2.666 | 703,01 | 83 | 925,00 | ||||
| 2026-01-30 | 13F | Carrera Capital Advisors | 88.178 | 1,38 | 2.743 | 19,05 | ||||
| 2025-11-14 | 13F | Raymond James Financial Inc | 0 | -100,00 | 0 | |||||
| 2026-02-06 | 13F | EverSource Wealth Advisors, LLC | 1.035 | -21,41 | 32 | -5,88 | ||||
| 2026-02-17 | 13F | Creative Planning | 31.353 | 56,64 | 975 | 83,96 | ||||
| 2025-10-27 | 13F | Rwc Asset Advisors (us) Llc | 0 | -100,00 | 0 |
Other Listings
| US:BSAC | 32,75 $ |