Grundlæggende statistik
| Institutionelle ejere | 82 total, 82 long only, 0 short only, 0 long/short - change of -38,57% MRQ |
| Gennemsnitlig porteføljeallokering | 0.1705 % - change of -41,33% MRQ |
| Institutionelle aktier (lange) | 39.373.680 (ex 13D/G) - change of -29,70MM shares -43,00% MRQ |
| Institutionel værdi (lang) | $ 2.249.689 USD ($1000) |
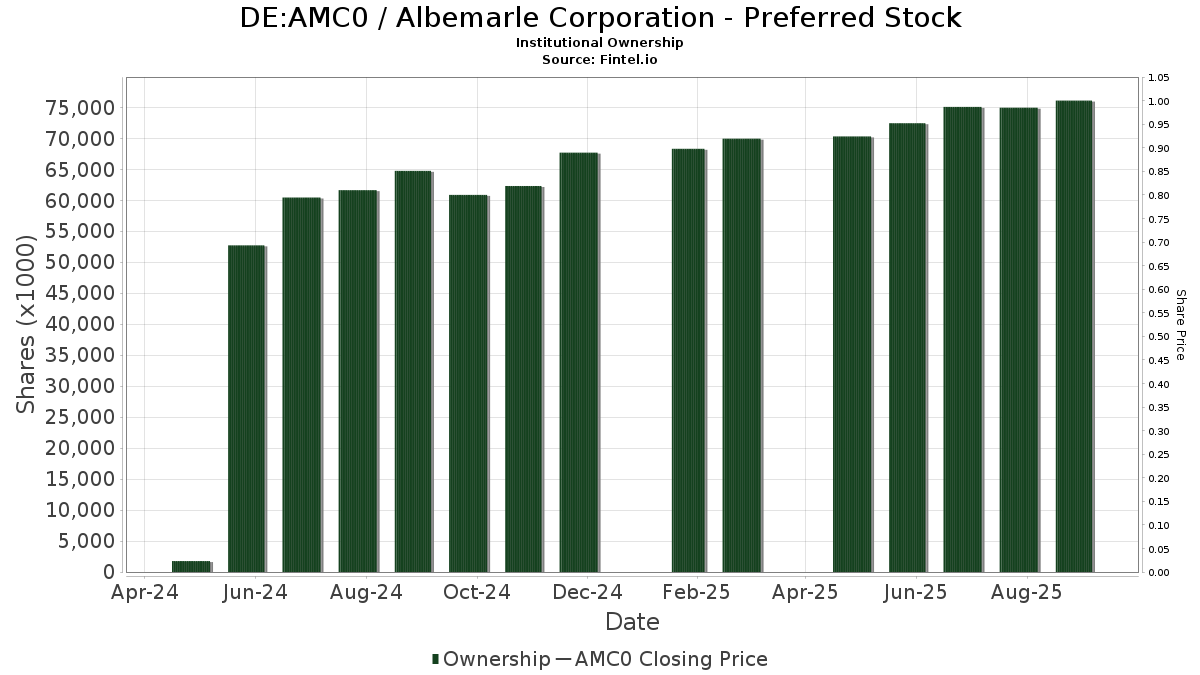
Institutionelt ejerskab og aktionærer
Albemarle Corporation - Preferred Stock (DE:AMC0) har 82 institutionelle ejere og aktionærer, der har indsendt 13D/G- eller 13F-formularer til Securities Exchange Commission (SEC). Disse institutioner har i alt 39,373,680 aktier. Største aktionærer omfatter Franklin Resources Inc, Capital World Investors, BlackRock, Inc., Two Sigma Investments, Lp, Voya Investment Management Llc, D. E. Shaw & Co., Inc., Wolverine Asset Management Llc, Van Eck Associates Corp, Calamos Advisors LLC, and Susquehanna Advisors Group, Inc. .
Albemarle Corporation - Preferred Stock (DB:AMC0) institutionel ejerskabsstruktur viser aktuelle positioner i virksomheden efter institutioner og fonde, samt seneste ændringer i positionsstørrelse. Større aktionærer kan omfatte individuelle investorer, investeringsforeninger, hedgefonde eller institutioner. Skema 13D angiver, at investoren besidder (eller besidder) mere end 5 % af virksomheden og har til hensigt (eller har til hensigt at) aktivt at forfølge en ændring i forretningsstrategi. Skema 13G indikerer en passiv investering på over 5%.
Fondens stemningsscore
Fund Sentiment Score (fka Ownership Accumulation Score) finder de aktier, der bliver mest købt af fonde. Det er resultatet af en sofistikeret, multi-faktor kvantitativ model, der identificerer virksomheder med de højeste niveauer af institutionel akkumulering. Scoringsmodellen bruger en kombination af den samlede stigning i oplyste ejere, ændringerne i porteføljeallokeringer i disse ejere og andre målinger. Tallet går fra 0 til 100, hvor højere tal indikerer et højere niveau af akkumulering for sine jævnaldrende, og 50 er gennemsnittet.
Opdateringsfrekvens: Dagligt
Se Ownership Explorer, som giver en liste over højest rangerende virksomheder.
AI+ Ask Fintel’s AI assistant about Albemarle Corporation - Preferred Stock.
Select a question to share a public post with an AI-crafted answer.
Thinking of good questions…
13F og NPORT arkivering
Detaljer om 13F-arkivering er gratis. Detaljer om NP-ansøgninger kræver et premium-medlemskab. Grønne rækker angiver nye positioner. Røde rækker angiver lukkede positioner. Klik på linket ikon for at se den fulde transaktionshistorik.
Opgrader
for at låse premium-data op og eksportere til Excel ![]() .
.
| Fil dato | Kilde | Investor | Type | Gennemsnitlig pris (Øst) |
Aktier | Δ Aktier (%) |
Rapporteret Værdi ($1000) |
Δ Værdi (%) |
Port Alloc (%) |
|
|---|---|---|---|---|---|---|---|---|---|---|
| 2026-02-06 | 13F | IFP Advisors, Inc | 0 | -100,00 | 0 | -100,00 | ||||
| 2026-02-17 | 13F | Magnetar Financial LLC | 250.000 | 150,00 | 14.730 | 282,67 | ||||
| 2026-01-29 | 13F | Calamos Wealth Management LLC | 6.700 | 398 | ||||||
| 2026-02-17 | 13F | Css Llc/il | 49.843 | 2.938 | ||||||
| 2026-02-13 | 13F | State Street Corp | 643.520 | 0,23 | 37.923 | 53,02 | ||||
| 2026-02-17 | 13F | Advisory Services Network, LLC | 4.630 | -4,83 | 275 | 48,91 | ||||
| 2026-01-29 | 13F | Comerica Bank | 560 | -32,93 | 33 | 6,45 | ||||
| 2026-02-17 | 13F | Lazard Asset Management Llc | 1 | |||||||
| 2026-02-17 | 13F | Fmr Llc | 528.100 | -23,58 | 31.079 | 18,07 | ||||
| 2026-02-06 | 13F | Keystone Financial Group | 28.750 | -1,63 | 1.707 | 54,20 | ||||
| 2026-02-19 | 13F | Invesco Ltd. | 152.800 | 19,56 | 9.075 | 87,44 | ||||
| 2026-02-11 | 13F | Capital International Sarl | 13.279 | 0,00 | 789 | 56,66 | ||||
| 2026-02-12 | 13F | Steward Partners Investment Advisory, Llc | 1.724 | -56,94 | 102 | -32,45 | ||||
| 2026-02-13 | 13F | Neuberger Berman Group LLC | 22.980 | 1.365 | ||||||
| 2026-02-13 | 13F | Walleye Capital LLC | 200.000 | 33,33 | 11.790 | 105,83 | ||||
| 2025-11-12 | 13F/A | Norges Bank | 150.000 | -50,00 | 6.750 | -51,78 | ||||
| 2026-02-17 | 13F | MIRAE ASSET GLOBAL ETFS HOLDINGS Ltd. | 1.030.675 | -14,94 | 61.212 | 33,36 | ||||
| 2025-11-14 | 13F | Anson Funds Management LP | 0 | -100,00 | 0 | -100,00 | ||||
| 2026-02-17 | 13F | Cnh Partners Llc | 0 | -100,00 | 0 | |||||
| 2026-02-17 | 13F | BlueCrest Capital Management Ltd | 143.217 | 8.506 | ||||||
| 2026-02-13 | 13F | Warberg Asset Management LLC | 12.034 | 709 | ||||||
| 2026-01-22 | 13F | Pinnacle Bancorp, Inc. | 28 | 0,00 | 2 | 0,00 | ||||
| 2026-02-13 | 13F | Wells Fargo & Company/mn | 609.251 | 306,39 | 36.183 | 537,25 | ||||
| 2026-02-10 | 13F | Ssi Investment Management Llc | 395.920 | 22,96 | 23.300 | 89,98 | ||||
| 2026-02-12 | 13F | Laffer Investments | 35.520 | -0,52 | 2.099 | 53,59 | ||||
| 2026-01-23 | 13F | Portman Square Capital LLP | 691.000 | 591,00 | 40.734 | 966,61 | ||||
| 2026-02-17 | 13F | Agf Management Ltd | 26.000 | 0,00 | 1.544 | 56,91 | ||||
| 2026-02-11 | 13F | Capital World Investors | 4.064.183 | 0,10 | 241.372 | 56,94 | ||||
| 2026-02-17 | 13F | Wiley Bros.-aintree Capital, Llc | 4.251 | 250 | ||||||
| 2026-02-12 | 13F | Federated Hermes, Inc. | 37.000 | 0,00 | 2.197 | 56,82 | ||||
| 2026-02-05 | 13F | Td Private Client Wealth Llc | 36 | -12,20 | 2 | 100,00 | ||||
| 2026-02-12 | 13F | BlackRock, Inc. | 3.818.220 | -4,13 | 226.764 | 50,32 | ||||
| 2025-11-14 | 13F | Susquehanna International Group, Llp | 0 | -100,00 | 0 | |||||
| 2026-02-11 | 13F | Jpmorgan Chase & Co | 130.886 | 7.773 | ||||||
| 2026-02-12 | 13F | Voya Investment Management Llc | 2.700.000 | 160.353 | ||||||
| 2026-02-13 | 13F | Victory Capital Management Inc | 211.150 | -2,97 | 12.540 | 52,13 | ||||
| 2026-02-13 | 13F | Citigroup Inc | 143.820 | -47,40 | 8.541 | -17,53 | ||||
| 2026-01-23 | 13F | Farther Finance Advisors, LLC | 6.230 | 0,00 | 370 | 57,45 | ||||
| 2026-02-09 | 13F | Shufro Rose & Co Llc | 9.850 | -78,82 | 585 | -64,76 | ||||
| 2026-02-02 | 13F | Wolverine Asset Management Llc | 1.447.324 | 8,60 | 85.492 | 67,18 | ||||
| 2026-02-02 | 13F | Fifth Third Bancorp | 1.589 | 0,00 | 94 | 56,67 | ||||
| 2025-11-14 | 13F | Aequim Alternative Investments LP | 0 | -100,00 | 0 | -100,00 | ||||
| 2026-02-13 | 13F | MAI Capital Management | 23 | 1 | ||||||
| 2026-02-17 | 13F | Raymond James Financial Inc | 21.164 | -12,60 | 1.257 | 36,97 | ||||
| 2026-02-12 | 13F | Jane Street Group, Llc | 10.308 | 18,81 | 612 | 86,59 | ||||
| 2026-02-20 | 13F | Sunbelt Securities, Inc. | 1.250 | 0,00 | 74 | 57,45 | ||||
| 2026-02-13 | 13F | Morgan Stanley | 175.554 | -40,15 | 10.426 | -6,17 | ||||
| 2026-02-10 | 13F | Envestnet Asset Management Inc | 11.003 | 0,93 | 653 | 58,50 | ||||
| 2026-02-17 | 13F | Ameriprise Financial Inc | 805.435 | 49,65 | 47.402 | 131,24 | ||||
| 2025-11-13 | 13F | LGT Fund Management Co Ltd. | 0 | -100,00 | 0 | |||||
| 2026-02-05 | 13F | Thrivent Financial For Lutherans | 22 | 75,00 | ||||||
| 2026-02-13 | 13F | Lord, Abbett & Co. Llc | 30 | 52,63 | ||||||
| 2026-02-13 | 13F | Barclays Plc | 111.065 | -9,20 | 6.596 | 19,84 | ||||
| 2026-01-26 | 13F | AE Wealth Management LLC | 69 | 4 | ||||||
| 2026-02-12 | 13F | Nuveen, LLC | 0 | -100,00 | 0 | |||||
| 2026-02-13 | 13F | Context Capital Management, LLC | 550.000 | 0,00 | 32.664 | 56,78 | ||||
| 2026-02-11 | 13F | Franklin Resources Inc | 8.362.645 | -9,67 | 496.657 | 41,62 | ||||
| 2026-02-05 | 13F | Gabelli Funds Llc | 31.000 | -17,33 | 1.841 | 26,97 | ||||
| 2026-02-03 | 13F | Morse Asset Management, Inc | 14.275 | -22,16 | 843 | 21,12 | ||||
| 2026-02-17 | 13F | D. E. Shaw & Co., Inc. | 2.700.000 | 8,00 | 159.254 | 66,14 | ||||
| 2026-02-17 | 13F | Advisor Group Holdings, Inc. | 152 | 9 | ||||||
| 2026-02-09 | 13F | Advent Capital Management /de/ | 77.747 | 0,00 | 4.583 | 56,26 | ||||
| 2026-01-26 | 13F | Drum Hill Capital, LLC | 41.605 | -9,52 | 2.471 | 41,87 | ||||
| 2026-02-03 | 13F | Credit Industriel Et Commercial | 225.000 | 0,00 | 13.417 | 53,99 | ||||
| 2026-02-17 | 13F | Susquehanna Advisors Group, Inc. | 1.200.000 | 33,33 | 71.268 | 109,05 | ||||
| 2026-01-26 | 13F | Private Trust Co Na | 750 | 0,00 | 45 | 57,14 | ||||
| 2026-01-20 | 13F | AdvisorNet Financial, Inc | 11.798 | -1,34 | 701 | 54,87 | ||||
| 2025-10-08 | 13F/A | Westwood Holdings Group Inc | 0 | -100,00 | 0 | |||||
| 2026-02-10 | 13F | Skaana Management L.P. | 19.264 | 147,80 | 1.144 | 289,12 | ||||
| 2026-02-17 | 13F | Blair William & Co/il | 300 | 0,00 | 18 | 54,55 | ||||
| 2026-02-02 | 13F | Oppenheimer & Co Inc | 0 | -100,00 | 0 | |||||
| 2026-02-13 | 13F | Financial Sense Advisors, Inc. | 235.362 | -46,17 | 13.978 | -15,60 | ||||
| 2026-02-17 | 13F | Wellington Management Group Llp | 0 | -100,00 | 0 | |||||
| 2026-01-05 | 13F | Union Bancaire Privee, UBP SA | 27.500 | 1.397 | ||||||
| 2026-02-17 | 13F | Two Sigma Investments, Lp | 2.734.758 | 106,15 | 162.417 | 223,21 | ||||
| 2026-02-03 | 13F | RFG Advisory, LLC | 29.478 | 0,10 | 1.751 | 56,95 | ||||
| 2026-02-13 | 13F | Cutler Capital Management, LLC | 5.125 | 0,00 | 304 | 56,70 | ||||
| 2026-02-17 | 13F | Infrastructure Capital Advisors, Llc | 45.180 | 252,97 | 2.683 | 374,03 | ||||
| 2026-02-11 | 13F | Capital Research Global Investors | 0 | -100,00 | 0 | |||||
| 2026-02-17 | 13F | Sona Asset Management (us) Llc | 600.000 | 0,00 | 35.388 | 53,56 | ||||
| 2026-01-23 | 13F | Baillie Gifford & Co | 120.000 | 0,00 | 7.064 | 54,25 | ||||
| 2025-11-13 | 13F | Bank Of Montreal /can/ | 0 | -100,00 | 0 | |||||
| 2026-02-17 | 13F | Royal Bank Of Canada | 35 | 59,09 | ||||||
| 2025-11-13 | 13F | Capital International Investors | 0 | -100,00 | 0 | |||||
| 2026-02-17 | 13F | Tower Research Capital LLC (TRC) | 0 | -100,00 | 0 | |||||
| 2026-02-02 | 13F | Mutual Advisors, LLC | 3.551 | 211 | ||||||
| 2026-02-17 | 13F | Blackstone Group Inc | 0 | -100,00 | 0 | |||||
| 2026-02-13 | 13F | Sculptor Capital LP | 583.121 | 34.632 | ||||||
| 2026-01-07 | 13F | Central Pacific Bank - Trust Division | 12.850 | 42,46 | 763 | 123,75 | ||||
| 2026-02-17 | 13F | Kelly Lawrence W & Associates Inc/ca | 25.355 | 76,63 | 1.492 | 173,26 | ||||
| 2026-02-13 | 13F | Van Eck Associates Corp | 1.386.936 | -1,21 | 82 | 54,72 | ||||
| 2026-01-29 | 13F | Nbc Securities, Inc. | 311 | -0,96 | 18 | 63,64 | ||||
| 2026-02-12 | 13F | CIBC Private Wealth Group, LLC | 11 | 0,00 | 1 | |||||
| 2026-02-17 | 13F | Palisade Capital Management Llc/nj | 30.000 | -25,00 | 1.769 | 15,47 | ||||
| 2026-02-09 | 13F | Mizuho Securities Usa Llc | 135.500 | 171,00 | 7.714 | 344,61 | ||||
| 2026-02-09 | 13F | Morningstar Investment Management LLC | 0 | -100,00 | 0 | |||||
| 2026-01-29 | 13F | Calamos Advisors LLC | 1.236.486 | 21,25 | 73.435 | 90,11 | ||||
| 2026-02-13 | 13F | Tcfg Wealth Management, Llc | 12.150 | 1,67 | 722 | 59,51 | ||||
| 2026-02-06 | 13F | Global Retirement Partners, LLC | 34 | -2,86 | 2 | 100,00 | ||||
| 2025-11-14 | 13F | Janus Henderson Group Plc | 0 | -100,00 | 0 | |||||
| 2026-02-11 | 13F | LPL Financial LLC | 14.578 | 866 | -3,35 | |||||
| 2026-02-17 | 13F/A | Uniplan Investment Counsel, Inc. | 56.210 | -3,80 | 3.338 | 50,84 | ||||
| 2026-02-17 | 13F | Bank Of America Corp /de/ | 137.707 | -36,17 | 8.178 | 0,07 |