Grundlæggende statistik
| Institutionelle aktier (lange) | 91.662.204 - 97,31% (ex 13D/G) - change of -21,00MM shares -18,64% MRQ |
| Institutionel værdi (lang) | $ 1.052.205 USD ($1000) |
Institutionelt ejerskab og aktionærer
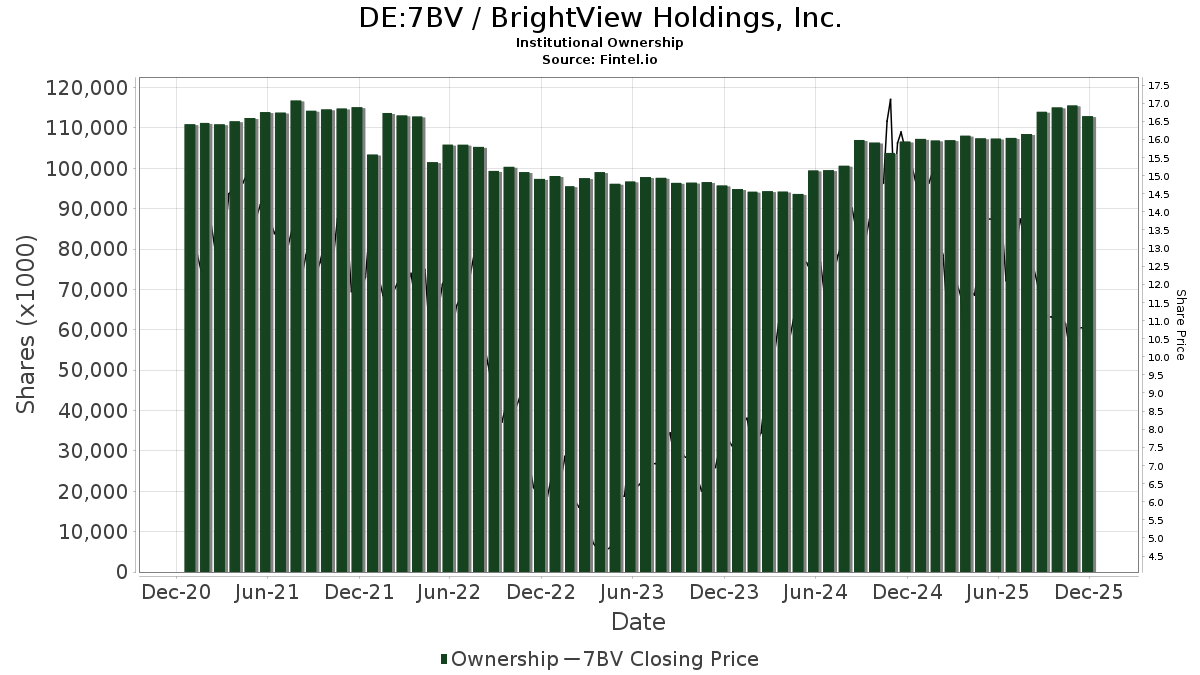
BrightView Holdings, Inc. (DE:7BV) har 185 institutionelle ejere og aktionærer, der har indsendt 13D/G- eller 13F-formularer til Securities Exchange Commission (SEC). Disse institutioner har i alt 91,662,204 aktier. Største aktionærer omfatter Kohlberg Kravis Roberts & Co. L.P., Vanguard Group Inc, BlackRock, Inc., Dimensional Fund Advisors Lp, Van Berkom & Associates Inc., Cooke & Bieler Lp, Harvey Partners, LLC, Fmr Llc, Newtyn Management, LLC, and Boston Partners .
BrightView Holdings, Inc. (DB:7BV) institutionel ejerskabsstruktur viser aktuelle positioner i virksomheden efter institutioner og fonde, samt seneste ændringer i positionsstørrelse. Større aktionærer kan omfatte individuelle investorer, investeringsforeninger, hedgefonde eller institutioner. Skema 13D angiver, at investoren besidder (eller besidder) mere end 5 % af virksomheden og har til hensigt (eller har til hensigt at) aktivt at forfølge en ændring i forretningsstrategi. Skema 13G indikerer en passiv investering på over 5%.
The share price as of April 2, 2026 is 9,90 / share. Previously, on April 4, 2025, the share price was 10,70 / share. This represents a decline of 7,48% over that period.
Fondens stemningsscore
Fund Sentiment Score (fka Ownership Accumulation Score) finder de aktier, der bliver mest købt af fonde. Det er resultatet af en sofistikeret, multi-faktor kvantitativ model, der identificerer virksomheder med de højeste niveauer af institutionel akkumulering. Scoringsmodellen bruger en kombination af den samlede stigning i oplyste ejere, ændringerne i porteføljeallokeringer i disse ejere og andre målinger. Tallet går fra 0 til 100, hvor højere tal indikerer et højere niveau af akkumulering for sine jævnaldrende, og 50 er gennemsnittet.
Opdateringsfrekvens: Dagligt
Se Ownership Explorer, som giver en liste over højest rangerende virksomheder.
AI+ Ask Fintel’s AI assistant about BrightView Holdings, Inc..
Select a question to share a public post with an AI-crafted answer.
Thinking of good questions…
13F og NPORT arkivering
Detaljer om 13F-arkivering er gratis. Detaljer om NP-ansøgninger kræver et premium-medlemskab. Grønne rækker angiver nye positioner. Røde rækker angiver lukkede positioner. Klik på linket ikon for at se den fulde transaktionshistorik.
Opgrader
for at låse premium-data op og eksportere til Excel ![]() .
.
| Fil dato | Kilde | Investor | Type | Gennemsnitlig pris (Øst) |
Aktier | Δ Aktier (%) |
Rapporteret Værdi ($1000) |
Δ Værdi (%) |
Port Alloc (%) |
|
|---|---|---|---|---|---|---|---|---|---|---|
| 2026-02-13 | 13F | Sei Investments Co | 181.334 | -2,73 | 2.298 | -8,01 | ||||
| 2025-11-13 | 13F | Portolan Capital Management, LLC | 0 | -100,00 | 0 | |||||
| 2026-02-09 | 13F | Optimize Financial Inc | 22.398 | 1,45 | 284 | -4,07 | ||||
| 2026-02-10 | 13F | Intech Investment Management Llc | 28.497 | 14,41 | 361 | 8,41 | ||||
| 2026-01-23 | 13F | State of Alaska, Department of Revenue | 6.402 | 0,00 | 0 | |||||
| 2026-01-28 | 13F | Universal- Beteiligungs- und Servicegesellschaft mbH | 51.951 | 139,49 | 658 | 126,90 | ||||
| 2026-01-13 | 13F | Kathmere Capital Management, LLC | 10.000 | 0,00 | 127 | -5,97 | ||||
| 2026-02-17 | 13F | Alliancebernstein L.p. | 1.783.588 | -1,56 | 22.598 | -6,92 | ||||
| 2026-01-23 | 13F | Farther Finance Advisors, LLC | 380 | 660,00 | 5 | |||||
| 2026-02-20 | 13F | Sunbelt Securities, Inc. | 0 | -100,00 | 0 | |||||
| 2026-02-13 | 13F | Contrarian Capital Management, L.l.c. | 0 | -100,00 | 0 | |||||
| 2026-02-11 | 13F | Picton Mahoney Asset Management | 0 | -100,00 | 0 | |||||
| 2026-02-17 | 13F | Fmr Llc | 2.422.745 | -0,25 | 30.696 | -5,69 | ||||
| 2026-02-05 | 13F | Dana Investment Advisors, Inc. | 509.486 | -0,13 | 6.455 | -5,56 | ||||
| 2026-02-09 | 13F | William Blair Investment Management, Llc | 0 | -100,00 | 0 | |||||
| 2026-01-29 | 13F | Dunhill Financial, LLC | 2 | 0 | ||||||
| 2026-02-12 | 13F | Voya Investment Management Llc | 11.054 | 0,00 | 140 | -5,41 | ||||
| 2026-02-10 | 13F/A | Northwestern Mutual Wealth Management Co | 421.784 | -0,08 | 5.344 | -5,52 | ||||
| 2026-02-05 | 13F | Amalgamated Bank | 2.258 | 12,12 | 0 | |||||
| 2026-02-10 | 13F | State of Wyoming | 66.936 | 94,67 | 848 | 84,35 | ||||
| 2026-02-17 | 13F | Lazard Asset Management Llc | 161.638 | 590,58 | 2.048 | 553,99 | ||||
| 2026-02-17 | 13F | D. E. Shaw & Co., Inc. | 588.382 | 162,75 | 7.455 | 148,47 | ||||
| 2026-02-09 | 13F | Penn Capital Management Co Inc | 210.323 | -11,33 | 2.665 | -16,17 | ||||
| 2026-02-13 | 13F | Wells Fargo & Company/mn | 87.095 | 41,35 | 1.103 | 33,70 | ||||
| 2026-02-17 | 13F | California State Teachers Retirement System | 57.369 | -3,09 | 727 | -8,45 | ||||
| 2025-11-13 | 13F | Glenmede Investment Management, LP | 10.384 | 139 | ||||||
| 2026-02-05 | 13F | Allworth Financial LP | 320 | -15,12 | 4 | -20,00 | ||||
| 2026-02-10 | 13F | Rothschild Investment Llc | 57 | 14,00 | 1 | |||||
| 2026-02-17 | 13F | Monimus Capital Management, Lp | 0 | -100,00 | 0 | |||||
| 2026-03-06 | 13F | Hsbc Holdings Plc | 14.994 | 190 | ||||||
| 2025-11-14 | 13F | Graham Capital Management, L.P. | 0 | -100,00 | 0 | |||||
| 2026-02-17 | 13F | XTX Topco Ltd | 148.170 | 192,48 | 1.877 | 176,84 | ||||
| 2026-02-17 | 13F | Wiley Bros.-aintree Capital, Llc | 0 | -100,00 | 0 | |||||
| 2026-02-10 | 13F | Savant Capital, LLC | 0 | -100,00 | 0 | |||||
| 2026-01-20 | 13F | Harbor Capital Advisors, Inc. | 174.021 | -8,65 | 2 | 0,00 | ||||
| 2026-02-09 | 13F | Cooke & Bieler Lp | 3.648.496 | 2,25 | 46.226 | -3,32 | ||||
| 2026-02-09 | 13F | Redmond Asset Management, LLC | 173.716 | 0,72 | 2.201 | -4,80 | ||||
| 2026-02-13 | 13F | Great West Life Assurance Co /can/ | 10.554 | -71,69 | 0 | |||||
| 2026-02-17 | 13F | Brevan Howard Capital Management LP | 47.939 | 130,71 | 607 | 118,35 | ||||
| 2025-11-14 | 13F | Point72 (DIFC) Ltd | 8.355 | 112 | ||||||
| 2026-02-09 | 13F | Royce & Associates Lp | 417.761 | 5.293 | ||||||
| 2026-02-17 | 13F | Russell Investments Group, Ltd. | 588.530 | 5,35 | 7.457 | -0,39 | ||||
| 2026-02-04 | 13F | Bailard, Inc. | 0 | -100,00 | 0 | |||||
| 2026-02-12 | 13F | Quadrant Capital Group Llc | 2.793 | 0,00 | 35 | -5,41 | ||||
| 2026-02-12 | 13F | Fuller & Thaler Asset Management, Inc. | 0 | -100,00 | 0 | |||||
| 2026-02-17 | 13F | Quantinno Capital Management LP | 29.373 | 116,33 | 372 | 105,52 | ||||
| 2026-02-13 | 13F | Marshall Wace, Llp | 0 | -100,00 | 0 | |||||
| 2026-02-06 | 13F | ProShare Advisors LLC | 13.138 | 6,90 | 166 | 1,22 | ||||
| 2026-02-12 | 13F | Dimensional Fund Advisors Lp | 5.076.380 | 3,15 | 64.318 | -2,47 | ||||
| 2026-02-06 | 13F | Pnc Financial Services Group, Inc. | 5 | 0 | ||||||
| 2026-02-17 | 13F | Qube Research & Technologies Ltd | 932.409 | 111,56 | 11.814 | 100,05 | ||||
| 2025-11-04 | 13F | Principal Financial Group Inc | 0 | -100,00 | 0 | |||||
| 2025-11-14 | 13F | Petrus Trust Company, LTA | 0 | -100,00 | 0 | |||||
| 2026-01-29 | 13F | DecisionPoint Financial, LLC | 41 | 0,00 | 1 | |||||
| 2026-02-17 | 13F | T. Rowe Price Investment Management, Inc. | 537.659 | -12,15 | 7 | -25,00 | ||||
| 2026-02-10 | 13F | Greenwich Wealth Management LLC | 55.000 | 0,00 | 1 | |||||
| 2026-02-17 | 13F | Tower Research Capital LLC (TRC) | 2.849 | 33,01 | 36 | 28,57 | ||||
| 2026-02-17 | 13F | Gilder Gagnon Howe & Co Llc | 661.302 | 0,05 | 8.379 | -5,40 | ||||
| 2026-02-06 | 13F | Larson Financial Group LLC | 0 | -100,00 | 0 | |||||
| 2026-02-11 | 13F | Jpmorgan Chase & Co | 124.342 | 109,61 | 1.575 | 98,36 | ||||
| 2026-02-06 | 13F | IFP Advisors, Inc | 1.969 | -9,47 | 25 | -17,24 | ||||
| 2026-01-26 | 13F | Cwm, Llc | 2.733 | -49,34 | 0 | |||||
| 2026-02-11 | 13F | Barrow Hanley Mewhinney & Strauss Llc | 104 | 0,00 | 1 | 0,00 | ||||
| 2026-02-05 | 13F | Plante Moran Financial Advisors, LLC | 530 | 7 | ||||||
| 2026-02-12 | 13F | CIBC Private Wealth Group, LLC | 662 | 0,00 | 8 | 0,00 | ||||
| 2026-02-17 | 13F | Balyasny Asset Management Llc | 86.176 | -44,79 | 1.092 | -47,82 | ||||
| 2026-01-30 | 13F | Us Bancorp \de\ | 486 | 0,00 | 6 | 0,00 | ||||
| 2026-01-29 | 13F | UBS Group AG | 212.286 | -14,96 | 2.690 | -19,59 | ||||
| 2026-02-17 | 13F | Boothbay Fund Management, Llc | 108.875 | 25,39 | 1.379 | 18,57 | ||||
| 2026-02-13 | 13F | National Bank Of Canada /fi/ | 3 | 0,00 | 0 | |||||
| 2026-02-12 | 13F | State Board Of Administration Of Florida Retirement System | 11.810 | 0,00 | 150 | -5,70 | ||||
| 2025-11-13 | 13F | Renaissance Technologies Llc | 0 | -100,00 | 0 | |||||
| 2026-02-12 | 13F | New York State Common Retirement Fund | 238.888 | 0,00 | 3.027 | -5,47 | ||||
| 2026-02-17 | 13F | Palisade Capital Management Llc/nj | 554.890 | -12,20 | 7.030 | -16,98 | ||||
| 2026-02-10 | 13F | Bnp Paribas Arbitrage, Sa | 15.936 | 9,02 | 202 | 3,08 | ||||
| 2026-02-10 | 13F | Bank of New York Mellon Corp | 263.200 | -10,23 | 3.335 | -15,12 | ||||
| 2026-02-11 | 13F | Capital World Investors | 0 | -100,00 | 0 | -100,00 | ||||
| 2026-02-12 | 13F | Nuveen, LLC | 125.276 | 0,00 | 1.587 | -5,42 | ||||
| 2026-02-17 | 13F | Bridgeway Capital Management Inc | 812.834 | -22,49 | 10.299 | -26,71 | ||||
| 2026-02-13 | 13F | Parkside Financial Bank & Trust | 72 | 0,00 | 1 | |||||
| 2026-01-30 | 13F | Jennison Associates Llc | 0 | -100,00 | 0 | |||||
| 2026-02-17 | 13F | Public Employees Retirement System Of Ohio | 2.185 | 11,31 | 28 | 3,85 | ||||
| 2026-02-12 | 13F | Swiss National Bank | 140.400 | 1,30 | 1.779 | -4,25 | ||||
| 2026-02-13 | 13F | Smartleaf Asset Management LLC | 482 | 0,21 | 6 | 0,00 | ||||
| 2026-02-17 | 13F | Cannell Capital Llc | 0 | -100,00 | 0 | |||||
| 2025-11-10 | 13F | Hartland & Co., LLC | 0 | -100,00 | 0 | |||||
| 2026-01-20 | 13F | Signaturefd, Llc | 2.476 | 0,00 | 31 | -6,06 | ||||
| 2026-02-13 | 13F | BNP Paribas Asset Management Holding S.A. | 688 | 31,05 | 0 | |||||
| 2026-01-29 | 13F | Vanguard Group Inc | 6.897.951 | -1,33 | 87.397 | -6,70 | ||||
| 2025-11-14 | 13F | Man Group plc | 0 | -100,00 | 0 | |||||
| 2026-02-05 | 13F | Bessemer Group Inc | 1.780.609 | -1,74 | 23 | -8,33 | ||||
| 2025-11-14 | 13F | Manatuck Hill Partners, LLC | 0 | -100,00 | 0 | |||||
| 2025-10-21 | 13F | True Wealth Design, LLC | 0 | -100,00 | 0 | |||||
| 2026-02-17 | 13F | MIRAE ASSET GLOBAL ETFS HOLDINGS Ltd. | 33.376 | -0,05 | 423 | -5,59 | ||||
| 2026-02-17 | 13F | Interval Partners, LP | 1.054.230 | -35,80 | 13.357 | -39,29 | ||||
| 2026-02-09 | 13F | Geode Capital Management, Llc | 1.676.006 | 0,22 | 21.239 | -5,23 | ||||
| 2026-02-13 | 13F | Colony Group, LLC | 30.294 | 384 | ||||||
| 2026-01-30 | 13F | Torren Management, LLC | 1.058 | 13 | ||||||
| 2026-01-28 | 13F | Arizona State Retirement System | 19.803 | -6,37 | 251 | -11,66 | ||||
| 2026-01-15 | 13F | Nisa Investment Advisors, Llc | 813 | 3,83 | 10 | 0,00 | ||||
| 2026-02-17 | 13F | Jump Financial, LLC | 18.526 | 235 | ||||||
| 2026-02-12 | 13F | BlackRock, Inc. | 5.288.550 | 0,84 | 67.006 | -4,65 | ||||
| 2026-02-17 | 13F | Mercer Global Advisors Inc /adv | 35.505 | 9,74 | 450 | 3,70 | ||||
| 2025-11-14 | 13F | Jain Global LLC | 0 | -100,00 | 0 | |||||
| 2026-01-15 | 13F | Highline Wealth Partners Llc | 0 | -100,00 | 0 | |||||
| 2026-02-17 | 13F | Voloridge Investment Management, Llc | 145.234 | 242,43 | 1.840 | 223,94 | ||||
| 2026-02-17 | 13F | Newtyn Management, LLC | 2.100.000 | -8,70 | 26.607 | -13,67 | ||||
| 2026-02-13 | 13F | Charles Schwab Investment Management Inc | 1.133.453 | 17,33 | 14.361 | 10,94 | ||||
| 2026-02-10 | 13F | Anchor Capital Advisors Llc | 76.665 | 9,87 | 971 | 3,85 | ||||
| 2026-02-13 | 13F | Sterling Capital Management LLC | 4.152 | -16,29 | 53 | -21,21 | ||||
| 2026-02-09 | 13F | Connors Investor Services Inc | 188.552 | 36,96 | 2.389 | 29,50 | ||||
| 2026-02-13 | 13F | Verition Fund Management LLC | 88.555 | 157,76 | 1.122 | 143,70 | ||||
| 2026-02-13 | 13F | Manufacturers Life Insurance Company, The | 34.771 | -1,41 | 441 | -6,78 | ||||
| 2026-02-13 | 13F | Diametric Capital, LP | 16.414 | 208 | ||||||
| 2026-01-21 | 13F | Capital Advisors, Ltd. LLC | 148 | 0,00 | 0 | |||||
| 2026-02-13 | 13F | Landscape Capital Management, L.l.c. | 0 | -100,00 | 0 | |||||
| 2026-02-17 | 13F | Dark Forest Capital Management Lp | 18.629 | -83,68 | 236 | -84,57 | ||||
| 2026-02-13 | 13F | Ieq Capital, Llc | 0 | -100,00 | 0 | |||||
| 2026-02-17 | 13F | Citadel Advisors Llc | 0 | -100,00 | 0 | -100,00 | ||||
| 2026-02-17 | 13F | Trexquant Investment LP | 294.293 | 8,04 | 3.729 | 2,14 | ||||
| 2026-01-09 | 13F | SG Americas Securities, LLC | 33.799 | -12,24 | 0 | |||||
| 2025-11-12 | 13F | Integrated Quantitative Investments LLC | 0 | -100,00 | 0 | |||||
| 2026-01-28 | 13F | Peregrine Capital Management Llc | 331.413 | -4,73 | 4.199 | -9,91 | ||||
| 2026-02-17 | 13F | Aqr Capital Management Llc | 84.089 | -39,96 | 1.065 | -43,23 | ||||
| 2026-02-12 | 13F | Commonwealth Equity Services, Llc | 10.016 | -0,30 | 127 | |||||
| 2026-02-13 | 13F | Boston Partners | 1.823.681 | 4,68 | 23.107 | -1,02 | ||||
| 2026-02-13 | 13F | Barclays Plc | 155.746 | 39,10 | 1.973 | 11,98 | ||||
| 2026-02-12 | 13F | Brown Brothers Harriman & Co | 40.009 | 52,72 | 507 | 44,16 | ||||
| 2025-11-14 | 13F | Skopos Labs, Inc. | 0 | -100,00 | 0 | |||||
| 2026-02-12 | 13F | Campbell & CO Investment Adviser LLC | 38.862 | -36,28 | 492 | -39,78 | ||||
| 2026-02-11 | 13F | Janney Montgomery Scott LLC | 0 | -100,00 | 0 | |||||
| 2025-11-13 | 13F | Prudential Financial Inc | 0 | -100,00 | 0 | |||||
| 2025-10-27 | 13F | First Horizon Corp | 0 | -100,00 | 0 | |||||
| 2026-02-13 | 13F | State Street Corp | 1.516.307 | 0,51 | 19.212 | -4,96 | ||||
| 2026-02-11 | 13F | Telemark Asset Management, LLC | 650.000 | -43,48 | 8.236 | -46,56 | ||||
| 2026-02-11 | 13F | Parallel Advisors, LLC | 79 | 0,00 | 1 | 0,00 | ||||
| 2026-02-11 | 13F | Deutsche Bank Ag\ | 53.152 | 39,26 | 673 | 31,70 | ||||
| 2026-02-13 | 13F | Ubs Asset Management Americas Inc | 139.193 | -10,22 | 1.764 | -15,12 | ||||
| 2026-01-30 | 13F | Rachor Investment Advisory Services, LLC | 19 | 0 | ||||||
| 2026-02-17 | 13F | Price T Rowe Associates Inc /md/ | 56.066 | 5,25 | 1 | |||||
| 2025-10-07 | 13F | Sonora Investment Management Group, LLC | 28.936 | -3,60 | 388 | -22,44 | ||||
| 2026-02-09 | 13F | Quest Partners LLC | 613 | -62,76 | 8 | -68,18 | ||||
| 2026-02-10 | 13F | Goldman Sachs Group Inc | 1.265.457 | -39,92 | 16.033 | -43,19 | ||||
| 2026-02-13 | 13F | Squarepoint Ops LLC | 12.260 | -65,99 | 155 | -67,91 | ||||
| 2026-01-27 | 13F | Zurcher Kantonalbank (Zurich Cantonalbank) | 14.401 | -39,49 | 182 | -42,77 | ||||
| 2026-02-13 | 13F | Dynamic Technology Lab Private Ltd | 0 | -100,00 | 0 | -100,00 | ||||
| 2026-02-17 | 13F | Voleon Capital Management Lp | 44.321 | 562 | ||||||
| 2026-02-17 | 13F | Susquehanna International Group, Llp | 25.307 | 321 | ||||||
| 2026-02-13 | 13F | Arrowstreet Capital, Limited Partnership | 785.485 | -18,55 | 9.952 | -22,99 | ||||
| 2026-02-06 | 13F | EverSource Wealth Advisors, LLC | 82 | -74,61 | 1 | -75,00 | ||||
| 2025-11-03 | 13F | Knights of Columbus Asset Advisors LLC | 0 | -100,00 | 0 | |||||
| 2026-02-17 | 13F | Millennium Management Llc | 1.206.746 | -44,19 | 15.289 | -47,23 | ||||
| 2026-02-18 | 13F | Mackenzie Financial Corp | 198.089 | 21,39 | 2.507 | 14,64 | ||||
| 2026-02-13 | 13F | Citigroup Inc | 10.405 | -8,45 | 132 | -13,82 | ||||
| 2026-02-11 | 13F | Empowered Funds, LLC | 419.134 | -14,31 | 5.310 | -18,98 | ||||
| 2026-02-12 | 13F | MetLife Investment Management, LLC | 40.330 | -3,82 | 511 | -9,09 | ||||
| 2026-02-12 | 13F | Federated Hermes, Inc. | 431.910 | 15,87 | 5.472 | 9,57 | ||||
| 2025-10-29 | 13F | GatePass Capital, LLC | 0 | -100,00 | 0 | -100,00 | ||||
| 2026-01-29 | 13F | Pictet Asset Management Holding SA | 11.882 | 0,00 | 151 | -5,66 | ||||
| 2026-02-12 | 13F | EntryPoint Capital, LLC | 15.813 | -77,12 | 200 | -78,38 | ||||
| 2026-02-02 | 13F | Strs Ohio | 42.800 | 16,62 | 542 | 10,39 | ||||
| 2026-02-17 | 13F | CWM Advisors, LLC | 36.973 | 9,14 | 468 | 3,31 | ||||
| 2026-02-17 | 13F | Algert Global Llc | 38.400 | 0 | ||||||
| 2026-02-17 | 13F | Aster Capital Management (DIFC) Ltd | 1.365 | 17 | ||||||
| 2026-02-13 | 13F | First Trust Advisors Lp | 235.040 | 89,11 | 2.978 | 78,80 | ||||
| 2026-02-18 | 13F | Pillsbury Lake Capital LLC | 489.973 | 6.208 | ||||||
| 2026-02-10 | 13F | Thompson Siegel & Walmsley Llc | 901.619 | -0,29 | 11 | -8,33 | ||||
| 2025-10-20 | 13F | Calamos Advisors LLC | 0 | -100,00 | 0 | |||||
| 2026-02-17 | 13F | Optiver Holding B.V. | 190 | -50,52 | 2 | -60,00 | ||||
| 2026-02-17 | 13F | Point72 Asset Management, L.P. | 430.547 | 1.329,30 | 5.455 | 1.253,60 | ||||
| 2026-02-17 | 13F | Advisor Group Holdings, Inc. | 151 | -41,92 | 2 | -66,67 | ||||
| 2026-02-04 | 13F | Ameritas Advisory Services, LLC | 0 | -100,00 | 0 | |||||
| 2026-02-09 | 13F | Legal & General Group Plc | 64.715 | 0,00 | 820 | -5,54 | ||||
| 2026-02-17 | 13F | Royal Bank Of Canada | 225.594 | -77,86 | 2.858 | -79,07 | ||||
| 2026-02-17 | 13F | Punch & Associates Investment Management, Inc. | 1.094.469 | -0,42 | 13.867 | -5,85 | ||||
| 2025-11-14 | 13F | Cubist Systematic Strategies, LLC | 158.489 | 2.124 | ||||||
| 2026-02-13 | 13F | Alyeska Investment Group, L.P. | 429.288 | -4,60 | 5.439 | -9,80 | ||||
| 2026-02-11 | 13F | Los Angeles Capital Management Llc | 204 | 3 | ||||||
| 2026-02-17 | 13F | Northern Trust Corp | 535.687 | -6,81 | 6.787 | -11,88 | ||||
| 2026-02-11 | 13F | Franklin Resources Inc | 53.979 | 21,77 | 684 | 15,18 | ||||
| 2026-02-06 | 13F | HighTower Advisors, LLC | 187.955 | 0,12 | 2.381 | -5,33 | ||||
| 2026-02-19 | 13F | Invesco Ltd. | 155.580 | -10,58 | 1.971 | -15,44 | ||||
| 2026-02-12 | 13F | Jane Street Group, Llc | 108.481 | -15,11 | 1.374 | -19,74 | ||||
| 2025-11-14 | 13F | Park West Asset Management LLC | 0 | -100,00 | 0 | |||||
| 2026-02-12 | 13F | Jane Street Group, Llc | Put | 10.700 | 136 | |||||
| 2026-02-06 | 13F | Gsa Capital Partners Llp | 60.698 | 73,11 | 1 | |||||
| 2026-02-10 | 13F | Envestnet Asset Management Inc | 17.513 | -28,94 | 222 | -33,03 | ||||
| 2026-02-12 | 13F | Hrt Financial Lp | 401.503 | 323,23 | 5 | 400,00 | ||||
| 2026-02-17 | 13F | AWH Capital, L.P. | 272.500 | 275,86 | 3.453 | 255,51 | ||||
| 2026-02-17 | 13F | Two Sigma Advisers, Lp | 873.600 | 104,78 | 11.069 | 93,63 | ||||
| 2026-02-17 | 13F | Prelude Capital Management, Llc | 149.992 | 8,40 | 1.900 | 2,48 | ||||
| 2026-01-29 | 13F | Comerica Bank | 961 | -6,88 | 12 | -7,69 | ||||
| 2026-02-11 | 13F | Mcmorgan & Co Llc | 17.410 | -85,70 | 221 | -86,51 | ||||
| 2026-02-13 | 13F | American Century Companies Inc | 137.696 | -10,04 | 1.745 | -14,97 | ||||
| 2026-01-28 | 13F | Klp Kapitalforvaltning As | 14.900 | 0,00 | 189 | -5,53 | ||||
| 2026-02-17 | 13F | Occudo Quantitative Strategies Lp | 0 | -100,00 | 0 | |||||
| 2025-11-14 | 13F | Walleye Capital LLC | 0 | -100,00 | 0 | |||||
| 2026-02-09 | 13F | Bleakley Financial Group, LLC | 103.577 | 31,02 | 1.312 | 23,89 | ||||
| 2026-02-17 | 13F | Kohlberg Kravis Roberts & Co. L.P. | 21.533.123 | 0,00 | 276.523 | -5,05 | ||||
| 2026-02-13 | 13F | Pathstone Holdings, LLC | 19.011 | -58,79 | 241 | -61,17 | ||||
| 2026-02-02 | 13F | Van Berkom & Associates Inc. | 4.858.860 | 6,60 | 62 | 0,00 | ||||
| 2026-02-17 | 13F | Creative Planning | 37.022 | 62,93 | 469 | 54,28 | ||||
| 2026-02-06 | 13F | Covestor Ltd | 41 | 95,24 | 0 | |||||
| 2026-02-11 | 13F | Private Management Group Inc | 589.437 | 7.468 | ||||||
| 2026-02-17 | 13F | Harvey Partners, LLC | 2.609.000 | -11,53 | 33.056 | -16,35 | ||||
| 2026-02-17 | 13F/A | RBF Capital, LLC | 0 | -100,00 | 0 | |||||
| 2026-02-13 | 13F | Y-Intercept (Hong Kong) Ltd | 147.586 | 1.870 | ||||||
| 2026-02-09 | 13F | Huntington National Bank | 1 | 0,00 | 0 | |||||
| 2026-02-13 | 13F | Morgan Stanley | 603.425 | 19,46 | 7.645 | 12,96 | ||||
| 2026-02-17 | 13F | Schonfeld Strategic Advisors LLC | 37.737 | -29,54 | 478 | -33,33 | ||||
| 2025-11-04 | 13F | Peterson Wealth Services | 0 | -100,00 | 0 | |||||
| 2026-02-13 | 13F | Entropy Technologies, LP | 0 | -100,00 | 0 | |||||
| 2026-02-17 | 13F | Credit Agricole S A | 60.000 | 760 | ||||||
| 2026-02-13 | 13F | Quarry LP | 0 | -100,00 | 0 | |||||
| 2026-02-13 | 13F | Jb Capital Partners Lp | 20.000 | 0,00 | 253 | -5,60 | ||||
| 2025-11-14 | 13F | Driehaus Capital Management Llc | 0 | -100,00 | 0 | |||||
| 2026-02-13 | 13F | Police & Firemen's Retirement System of New Jersey | 18.173 | 0,32 | 230 | -4,96 | ||||
| 2026-02-17 | 13F | VARCOV Co. | 33.851 | 429 | ||||||
| 2026-02-13 | 13F | Rice Hall James & Associates, Llc | 209.026 | -8,12 | 2.648 | -13,12 | ||||
| 2026-02-17 | 13F | Two Sigma Investments, Lp | 748.420 | 31,66 | 9.482 | 24,48 | ||||
| 2026-01-30 | 13F | North Star Investment Management Corp. | 50 | 1 | ||||||
| 2026-02-13 | 13F | Rhumbline Advisers | 84.596 | -10,16 | 1.072 | -15,07 | ||||
| 2026-02-17 | 13F | Bank Of America Corp /de/ | 376.006 | -46,46 | 4.764 | -49,38 | ||||
| 2026-02-17 | 13F | State Of Wisconsin Investment Board | 28.208 | -70,40 | 357 | -72,02 | ||||
| 2026-01-05 | 13F | GAMMA Investing LLC | 651 | -31,33 | 8 | -33,33 | ||||
| 2026-02-17 | 13F | Citadel Advisors Llc | Put | 0 | -100,00 | 0 | -100,00 | |||
| 2026-02-17 | 13F | Engineers Gate Manager LP | 0 | -100,00 | 0 | |||||
| 2026-02-11 | 13F | Ameritas Investment Partners, Inc. | 5.891 | 75 | ||||||
| 2026-02-13 | 13F | SRS Capital Advisors, Inc. | 723 | -75,54 | 9 | -76,92 | ||||
| 2026-01-22 | 13F | Bfsg, Llc | 3.835 | 49 | ||||||
| 2026-02-17 | 13F | Janus Henderson Group Plc | 26.832 | 0,00 | 340 | -5,29 | ||||
| 2026-02-13 | 13F | Victory Capital Management Inc | 0 | -100,00 | 0 | |||||
| 2026-02-17 | 13F | Expect Equity LLC | 100.482 | 0,00 | 1.273 | -5,42 | ||||
| 2026-02-11 | 13F | Simplex Trading, Llc | Put | 1.800 | -14,29 | 23 | ||||
| 2026-01-08 | 13F | Versant Capital Management, Inc | 1.072 | 4,28 | 14 | 0,00 | ||||
| 2026-02-11 | 13F | Simplex Trading, Llc | 936 | -0,85 | 12 |
Other Listings
| US:BV | 11,71 $ |