Grundlæggende statistik
| Insider-profil | JB CAPITAL PARTNERS LP |
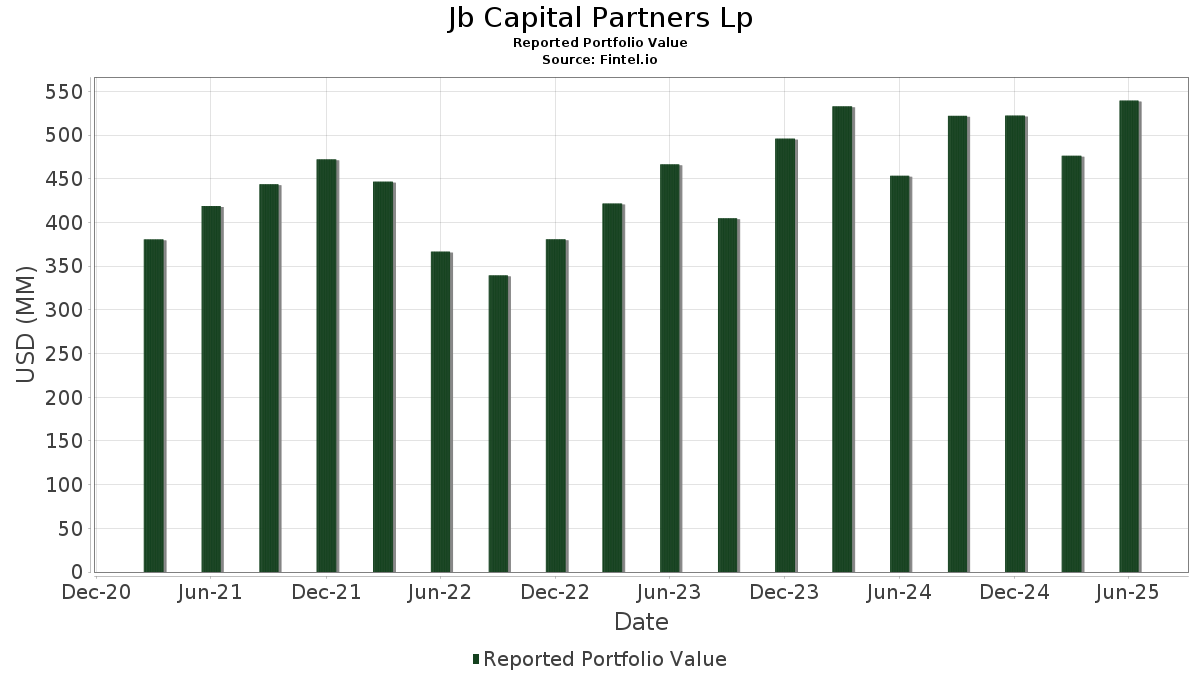
| Porteføljeværdi | $ 591.043.697 |
| Nuværende stillinger | 86 |
Seneste beholdninger, ydeevne, AUM (fra 13F, 13D)
Jb Capital Partners Lp har afsløret 86 samlede besiddelser i deres seneste SEC-arkivering. Den seneste porteføljeværdi er beregnet til at være $ 591.043.697 USD. Faktiske aktiver under forvaltning (AUM) er denne værdi plus kontanter (som ikke er oplyst). Jb Capital Partners Lps største beholdninger er RadNet, Inc. (US:RDNT) , Ryerson Holding Corporation (US:RYI) , Tutor Perini Corporation (US:TPC) , Core Natural Resources, Inc. (US:CNR) , and Oppenheimer Holdings Inc. (US:OPY) . Jb Capital Partners Lps nye stillinger omfatter Fluent, Inc. (US:FLNT) , Mount Logan Capital Inc. (US:MLCI) , Magnera Corporation (US:MAGN) , Kelly Services, Inc. (US:KELY.A) , and BCP Investment Corp. (US:BCIC) . Jb Capital Partners Lps topbrancher er "Water Transportation" (sic 44) , and "Health Services" (sic 80) .
Top øger dette kvartal
Vi bruger ændringen i porteføljeallokeringen, fordi dette er den mest meningsfulde metrik. Ændringer kan skyldes handler eller ændringer i aktiekurser.
| Sikkerhed | Aktier (MM) |
Værdi (MM$) |
Portefølje % | ΔPortefølje % |
|---|---|---|---|---|
| RDNT / RadNet, Inc. | 1,42 | 108,53 | 18,3620 | 2,8133 |
| CNR / Core Natural Resources, Inc. | 0,47 | 38,97 | 6,5929 | 0,5591 |
| DAN / Dana Incorporated | 1,85 | 37,12 | 6,2804 | 0,4268 |
| MLCI / Mount Logan Capital Inc. | 0,31 | 2,40 | 0,4058 | 0,4058 |
| MAGN / Magnera Corporation | 0,17 | 1,99 | 0,3371 | 0,3371 |
| AXL / Dauch Corporation | 1,11 | 6,66 | 1,1262 | 0,2886 |
| FET / Forum Energy Technologies, Inc. | 0,12 | 3,23 | 0,5459 | 0,2868 |
| KELY.A / Kelly Services, Inc. | 0,12 | 1,54 | 0,2608 | 0,2608 |
| BCIC / BCP Investment Corp. | 0,12 | 1,41 | 0,2389 | 0,2389 |
| TPC / Tutor Perini Corporation | 0,72 | 47,20 | 7,9851 | 0,2287 |
Top falder i dette kvartal
Vi bruger ændringen i porteføljeallokeringen, fordi dette er den mest meningsfulde metrik. Ændringer kan skyldes handler eller ændringer i aktiekurser.
| Sikkerhed | Aktier (MM) |
Værdi (MM$) |
Portefølje % | ΔPortefølje % |
|---|---|---|---|---|
| IESC / IES Holdings, Inc. | 0,00 | 0,33 | 0,0566 | -2,2410 |
| ASTL / Algoma Steel Group Inc. | 0,99 | 3,53 | 0,5976 | -0,6695 |
| VCTR / Victory Capital Holdings, Inc. | 0,24 | 15,66 | 2,6495 | -0,6172 |
| BXC / BlueLinx Holdings Inc. | 0,39 | 28,77 | 4,8673 | -0,5597 |
| LCUT / Lifetime Brands, Inc. | 1,59 | 6,14 | 1,0397 | -0,4373 |
| CXW / CoreCivic, Inc. | 0,85 | 17,20 | 2,9101 | -0,3907 |
| BLDR / Builders FirstSource, Inc. | 0,29 | 35,44 | 5,9957 | -0,3256 |
| RYI / Ryerson Holding Corporation | 2,13 | 48,58 | 8,2191 | -0,3009 |
| SPWH / Sportsman's Warehouse Holdings, Inc. | 1,71 | 4,74 | 0,8018 | -0,2922 |
| ZEUS / Olympic Steel, Inc. | 0,22 | 6,78 | 1,1463 | -0,1977 |
13D/G-arkivering
Dette er en liste over 13D- og 13G-arkiveringer lavet i det sidste år (hvis nogen). Klik på linkikonet for at se den fulde transaktionshistorik. Grønne rækker angiver nye positioner. Røde rækker angiver lukkede positioner.
| Fil dato | Form | Sikkerhed | Forrige Aktier |
Nuværende Aktier |
Δandele % | % Ejerskab |
% ΔEjerskab | |
|---|---|---|---|---|---|---|---|---|
| 2026-02-09 | / (34380C102) | 2.169.483 | 7,20 | |||||
| 2026-02-09 | NEXN / Nexxen International Ltd. | 3.530.057 | 4.361.625 | 23,56 | 7,80 | 41,82 | ||
| 2026-02-09 | RYI / Ryerson Holding Corporation | 2.131.069 | 2.343.475 | 9,97 | 7,30 | 8,96 | ||
| 2026-02-09 | LCUT / Lifetime Brands, Inc. | 1.248.121 | 1.627.852 | 30,42 | 7,20 | 28,57 |
13F og Fondsarkivering
Denne formular blev indsendt den 2025-11-14 for rapporteringsperioden 2025-09-30. Klik på linkikonet for at se den fulde transaktionshistorik.
Opgrader for at låse op for premium-data og eksportere til Excel ![]() .
.
| Sikkerhed | Type | Gennemsnitlig aktiekurs | Aktier (MM) |
Δ Aktier (%) |
Værdi ($MM) |
Δ Aktier (%) |
Portefølje (%) |
ΔPortefølje (%) |
|
|---|---|---|---|---|---|---|---|---|---|
| RDNT / RadNet, Inc. | 1,42 | -3,39 | 108,53 | 29,37 | 18,3620 | 2,8133 | |||
| RYI / Ryerson Holding Corporation | 2,13 | -0,28 | 48,58 | 5,68 | 8,2191 | -0,3009 | |||
| TPC / Tutor Perini Corporation | 0,72 | -19,56 | 47,20 | 12,78 | 7,9851 | 0,2287 | |||
| CNR / Core Natural Resources, Inc. | 0,47 | 0,00 | 38,97 | 19,70 | 6,5929 | 0,5591 | |||
| OPY / Oppenheimer Holdings Inc. | 0,50 | 0,00 | 37,25 | 12,38 | 6,3019 | 0,1585 | |||
| DAN / Dana Incorporated | 1,85 | 0,00 | 37,12 | 17,54 | 6,2804 | 0,4268 | |||
| Nexxen International LTD / SPON ADR (89484T104) | 4,00 | 37,03 | 0,0000 | ||||||
| BLDR / Builders FirstSource, Inc. | 0,29 | 0,00 | 35,44 | 3,91 | 5,9957 | -0,3256 | |||
| BXC / BlueLinx Holdings Inc. | 0,39 | 0,00 | 28,77 | -1,75 | 4,8673 | -0,5597 | |||
| CXW / CoreCivic, Inc. | 0,85 | 0,00 | 17,20 | -3,41 | 2,9101 | -0,3907 | |||
| VCTR / Victory Capital Holdings, Inc. | 0,24 | -12,64 | 15,66 | -11,15 | 2,6495 | -0,6172 | |||
| MT / ArcelorMittal S.A. - Depositary Receipt (Common Stock) | 0,20 | 0,00 | 7,41 | 14,48 | 1,2538 | 0,0539 | |||
| Ramaco Resources Inc / COM CL A (75134P900) | 0,21 | 6,97 | 0,0000 | ||||||
| ZEUS / Olympic Steel, Inc. | 0,22 | 0,00 | 6,78 | -6,56 | 1,1463 | -0,1977 | |||
| AXL / Dauch Corporation | 1,11 | 0,00 | 6,66 | 47,32 | 1,1262 | 0,2886 | |||
| LCUT / Lifetime Brands, Inc. | 1,59 | 0,63 | 6,14 | -22,89 | 1,0397 | -0,4373 | |||
| SPWH / Sportsman's Warehouse Holdings, Inc. | 1,71 | 0,00 | 4,74 | -19,72 | 0,8018 | -0,2922 | |||
| CIGI / Colliers International Group Inc. | 0,03 | 0,00 | 4,70 | 19,67 | 0,7956 | 0,0673 | |||
| MEC / Mayville Engineering Company, Inc. | 0,25 | 0,00 | 4,46 | 11,66 | 0,7553 | 0,0142 | |||
| CVEO / Civeo Corporation | 0,19 | 0,00 | 4,46 | -0,38 | 0,7540 | -0,0752 | |||
| VREX / Varex Imaging Corporation | 0,31 | 6,43 | 3,89 | 52,25 | 0,6587 | 0,1846 | |||
| ASTL / Algoma Steel Group Inc. | 0,99 | 0,00 | 3,53 | -48,33 | 0,5976 | -0,6695 | |||
| AXR / AMREP Corporation | 0,14 | 0,00 | 3,38 | 14,30 | 0,5721 | 0,0237 | |||
| FLNT / Fluent, Inc. | 1,46 | 3,24 | 0,0000 | ||||||
| FET / Forum Energy Technologies, Inc. | 0,12 | 68,25 | 3,23 | 130,92 | 0,5459 | 0,2868 | |||
| CSV / Carriage Services, Inc. | 0,07 | 0,00 | 3,16 | -2,41 | 0,5351 | -0,0654 | |||
| HNRG / Hallador Energy Company | 0,16 | 0,00 | 3,13 | 23,66 | 0,5298 | 0,0603 | |||
| CNDT / Conduent Incorporated | 1,11 | 0,00 | 3,12 | 6,06 | 0,5273 | -0,0173 | |||
| TSQ / Townsquare Media, Inc. | 0,47 | 0,00 | 3,05 | -15,67 | 0,5163 | -0,1544 | |||
| HDSN / Hudson Technologies, Inc. | 0,31 | 0,00 | 3,04 | 22,28 | 0,5144 | 0,0536 | |||
| GSM / Ferroglobe PLC | 0,66 | 0,00 | 2,98 | 24,01 | 0,5042 | 0,0587 | |||
| Sinclair Broadcast Group Inc / CL A (829226109) | 0,20 | 2,94 | 0,0000 | ||||||
| III / Information Services Group, Inc. | 0,49 | 0,00 | 2,80 | 19,79 | 0,4744 | 0,0406 | |||
| BBCP / Concrete Pumping Holdings, Inc. | 0,34 | 0,00 | 2,41 | 14,63 | 0,4072 | 0,0181 | |||
| MLCI / Mount Logan Capital Inc. | 0,31 | 2,40 | 0,4058 | 0,4058 | |||||
| OI / O-I Glass, Inc. | 0,15 | 0,00 | 2,01 | -12,00 | 0,3401 | -0,0833 | |||
| MAGN / Magnera Corporation | 0,17 | 1,99 | 0,3371 | 0,3371 | |||||
| MG / Mistras Group, Inc. | 0,20 | 0,00 | 1,99 | 22,92 | 0,3367 | 0,0364 | |||
| LMB / Limbach Holdings, Inc. | 0,02 | 0,00 | 1,94 | -30,69 | 0,3286 | -0,1907 | |||
| FSV / FirstService Corporation | 0,01 | 0,00 | 1,92 | 9,07 | 0,3256 | -0,0014 | |||
| RICK / RCI Hospitality Holdings, Inc. | 0,06 | 0,00 | 1,83 | -19,98 | 0,3097 | -0,1142 | |||
| GEO / The GEO Group, Inc. | 0,08 | 0,00 | 1,64 | -14,46 | 0,2773 | -0,0778 | |||
| PKOH / Park-Ohio Holdings Corp. | 0,08 | 0,00 | 1,63 | 19,90 | 0,2763 | 0,0238 | |||
| ATKR / Atkore Inc. | 0,03 | 0,00 | 1,57 | -11,06 | 0,2654 | -0,0615 | |||
| KELY.A / Kelly Services, Inc. | 0,12 | 1,54 | 0,2608 | 0,2608 | |||||
| BCIC / BCP Investment Corp. | 0,12 | 1,41 | 0,2389 | 0,2389 | |||||
| TDW / Tidewater Inc. | 0,03 | 0,00 | 1,33 | 15,61 | 0,2256 | 0,0118 | |||
| GTX / Garrett Motion Inc. | 0,09 | 0,00 | 1,24 | 29,60 | 0,2097 | 0,0324 | |||
| RUSHA / Rush Enterprises, Inc. | 0,02 | 0,00 | 1,17 | 9,06 | 0,1976 | -0,0010 | |||
| RUSHA / Rush Enterprises, Inc. | 0,02 | 0,00 | 1,09 | 3,43 | 0,1840 | -0,0109 | |||
| ORN / Orion Group Holdings, Inc. | 0,13 | 0,00 | 1,08 | -8,31 | 0,1830 | -0,0355 | |||
| SND / Smart Sand, Inc. | 0,46 | 31,43 | 0,98 | 47,31 | 0,1666 | 0,0426 | |||
| Ramaco Resources Inc / COM CL B (75134P303) | 0,06 | 0,97 | 0,0000 | ||||||
| BALY.T / Bally's Corporation | 0,05 | 0,93 | 0,1576 | 0,1576 | |||||
| TRS / TriMas Corporation | 0,02 | 0,00 | 0,86 | 35,06 | 0,1454 | 0,0274 | |||
| XPEL / XPEL, Inc. | 0,03 | 0,00 | 0,83 | -7,92 | 0,1399 | -0,0265 | |||
| POWW / Outdoor Holding Company | 0,55 | 0,00 | 0,81 | 15,63 | 0,1377 | 0,0072 | |||
| SAR / Saratoga Investment Corp. | 0,03 | 0,00 | 0,81 | -1,82 | 0,1367 | -0,0158 | |||
| RYAM / Rayonier Advanced Materials Inc. | 0,10 | 0,00 | 0,72 | 87,53 | 0,1222 | 0,0508 | |||
| INSE / Inspired Entertainment, Inc. | 0,07 | 0,00 | 0,61 | 14,69 | 0,1032 | 0,0047 | |||
| EZPW / EZCORP, Inc. | 0,03 | 0,00 | 0,57 | 37,26 | 0,0966 | 0,0195 | |||
| VFF / Village Farms International, Inc. | 0,18 | 0,00 | 0,56 | 184,34 | 0,0953 | 0,0586 | |||
| FSK / FS KKR Capital Corp. | 0,04 | 0,00 | 0,56 | -28,15 | 0,0947 | -0,0495 | |||
| LXU / LSB Industries, Inc. | 0,07 | 0,00 | 0,55 | 4,16 | 0,0933 | -0,0048 | |||
| QIPT / Quipt Home Medical Corp. | 0,20 | 0,00 | 0,52 | 45,81 | 0,0883 | 0,0220 | |||
| RNGR / Ranger Energy Services, Inc. | 0,04 | 0,00 | 0,51 | 18,20 | 0,0869 | 0,0063 | |||
| GTN / Gray Media, Inc. | 0,09 | 0,00 | 0,50 | 27,59 | 0,0854 | 0,0121 | |||
| TWI / Titan International, Inc. | 0,05 | 0,00 | 0,38 | -26,32 | 0,0640 | -0,0312 | |||
| Graftech INTL LTD / (384313508) | 0,03 | 0,38 | 0,0000 | ||||||
| IESC / IES Holdings, Inc. | 0,00 | -97,99 | 0,33 | -97,31 | 0,0566 | -2,2410 | |||
| RDNW / RideNow Group, Inc. | 0,07 | 0,00 | 0,31 | 91,30 | 0,0521 | 0,0221 | |||
| KTOS / Kratos Defense & Security Solutions, Inc. | 0,00 | 0,00 | 0,30 | 96,71 | 0,0507 | 0,0225 | |||
| NOA / North American Construction Group Ltd. | 0,02 | 0,00 | 0,28 | -10,97 | 0,0481 | -0,0112 | |||
| RMNI / Rimini Street, Inc. | 0,06 | 0,00 | 0,28 | 24,22 | 0,0469 | 0,0055 | |||
| BV / BrightView Holdings, Inc. | 0,02 | 0,00 | 0,27 | -19,52 | 0,0453 | -0,0164 | |||
| CURV / Torrid Holdings Inc. | 0,15 | 0,00 | 0,26 | -40,72 | 0,0444 | -0,0376 | |||
| LEE / Lee Enterprises, Incorporated | 0,04 | 0,00 | 0,22 | -15,23 | 0,0368 | -0,0106 | |||
| WRLD / World Acceptance Corporation | 0,00 | 0,00 | 0,18 | 2,27 | 0,0306 | -0,0021 | |||
| CLF / Cleveland-Cliffs Inc. | 0,01 | 0,00 | 0,14 | 60,47 | 0,0234 | 0,0074 | |||
| FTHM / Fathom Holdings Inc. | 0,07 | 0,00 | 0,13 | 45,35 | 0,0213 | 0,0052 | |||
| GSIT / GSI Technology, Inc. | 0,03 | 0,00 | 0,12 | 10,00 | 0,0205 | -0,0000 | |||
| CVGI / Commercial Vehicle Group, Inc. | 0,07 | 0,00 | 0,11 | 2,70 | 0,0194 | -0,0014 | |||
| CNTY / Century Casinos, Inc. | 0,04 | 0,00 | 0,10 | 22,22 | 0,0169 | 0,0019 | |||
| DXLG / Destination XL Group, Inc. | 0,07 | 0,00 | 0,10 | 18,07 | 0,0166 | 0,0012 | |||
| TSE / Trinseo PLC | 0,03 | 0,00 | 0,06 | -24,10 | 0,0107 | -0,0048 | |||
| Xcel Brands Inc / (98400M101) | 0,01 | 0,03 | 0,0000 | ||||||
| TURN / 180 Degree Capital Corp. | 0,00 | -100,00 | 0,00 | 0,0000 |