Grundlæggende statistik
| Institutionelle aktier (lange) | 192.881.298 - 87,44% (ex 13D/G) - change of -21,50MM shares -10,01% MRQ |
| Institutionel værdi (lang) | $ 4.411.114 USD ($1000) |
Institutionelt ejerskab og aktionærer
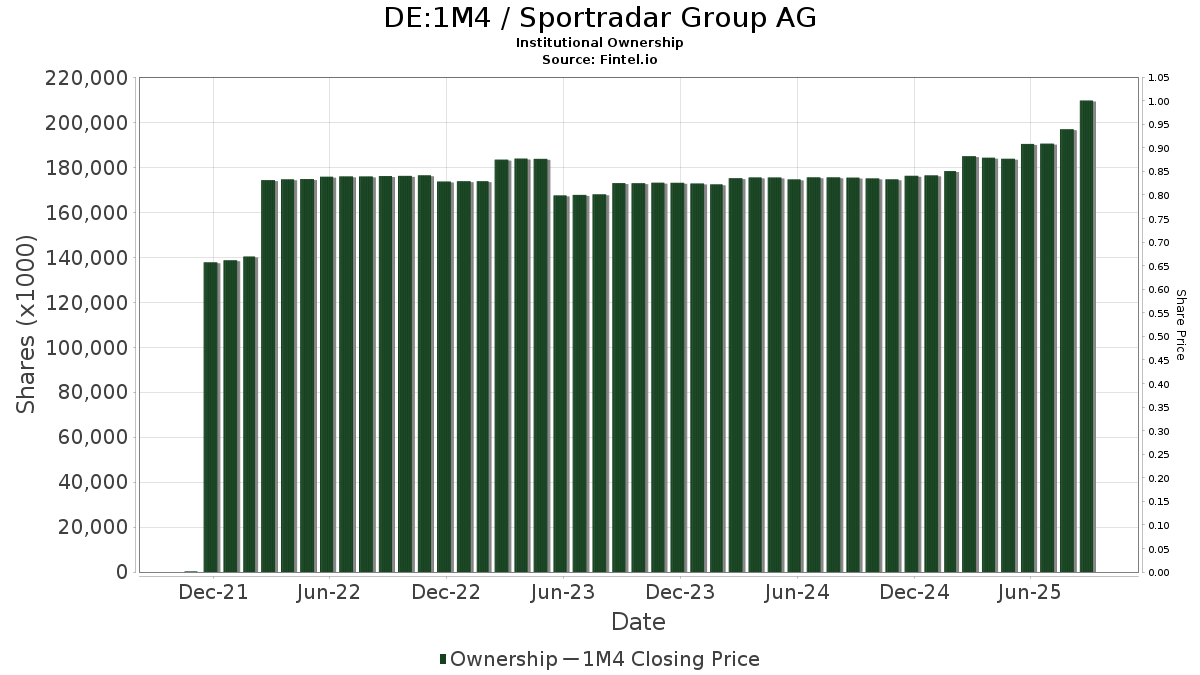
Sportradar Group AG (DE:1M4) har 205 institutionelle ejere og aktionærer, der har indsendt 13D/G- eller 13F-formularer til Securities Exchange Commission (SEC). Disse institutioner har i alt 192,881,298 aktier. Største aktionærer omfatter Canada Pension Plan Investment Board, Technology Crossover Management IX, Ltd., Radcliff Management LLC, Greenhouse Funds LLLP, Massachusetts Financial Services Co /ma/, T. Rowe Price Investment Management, Inc., Durable Capital Partners LP, Fmr Llc, Janus Henderson Group Plc, and Jericho Capital Asset Management L.P. .
Sportradar Group AG (DB:1M4) institutionel ejerskabsstruktur viser aktuelle positioner i virksomheden efter institutioner og fonde, samt seneste ændringer i positionsstørrelse. Større aktionærer kan omfatte individuelle investorer, investeringsforeninger, hedgefonde eller institutioner. Skema 13D angiver, at investoren besidder (eller besidder) mere end 5 % af virksomheden og har til hensigt (eller har til hensigt at) aktivt at forfølge en ændring i forretningsstrategi. Skema 13G indikerer en passiv investering på over 5%.
The share price as of March 26, 2026 is 15,80 / share. Previously, on March 27, 2025, the share price was 20,80 / share. This represents a decline of 24,04% over that period.
Fondens stemningsscore
Fund Sentiment Score (fka Ownership Accumulation Score) finder de aktier, der bliver mest købt af fonde. Det er resultatet af en sofistikeret, multi-faktor kvantitativ model, der identificerer virksomheder med de højeste niveauer af institutionel akkumulering. Scoringsmodellen bruger en kombination af den samlede stigning i oplyste ejere, ændringerne i porteføljeallokeringer i disse ejere og andre målinger. Tallet går fra 0 til 100, hvor højere tal indikerer et højere niveau af akkumulering for sine jævnaldrende, og 50 er gennemsnittet.
Opdateringsfrekvens: Dagligt
Se Ownership Explorer, som giver en liste over højest rangerende virksomheder.
AI+ Ask Fintel’s AI assistant about Sportradar Group AG.
Select a question to share a public post with an AI-crafted answer.
Thinking of good questions…
13F og NPORT arkivering
Detaljer om 13F-arkivering er gratis. Detaljer om NP-ansøgninger kræver et premium-medlemskab. Grønne rækker angiver nye positioner. Røde rækker angiver lukkede positioner. Klik på linket ikon for at se den fulde transaktionshistorik.
Opgrader
for at låse premium-data op og eksportere til Excel ![]() .
.
| Fil dato | Kilde | Investor | Type | Gennemsnitlig pris (Øst) |
Aktier | Δ Aktier (%) |
Rapporteret Værdi ($1000) |
Δ Værdi (%) |
Port Alloc (%) |
|
|---|---|---|---|---|---|---|---|---|---|---|
| 2025-12-01 | 13F/A | Polar Asset Management Partners Inc. | 0 | -100,00 | 0 | -100,00 | ||||
| 2026-02-12 | 13F | New York State Common Retirement Fund | 235.100 | -17,21 | 5.588 | -26,84 | ||||
| 2026-02-11 | 13F | Jpmorgan Chase & Co | 1.759.326 | 49,75 | 41.819 | 32,33 | ||||
| 2026-01-14 | 13F | Exchange Traded Concepts, Llc | 102.257 | -36,56 | 2.431 | -43,94 | ||||
| 2026-01-09 | 13F | SG Americas Securities, LLC | 28.524 | -16,15 | 1 | |||||
| 2026-02-13 | 13F | Ubs Asset Management Americas Inc | 281 | 7 | ||||||
| 2026-02-09 | 13F | Legal & General Group Plc | 13.031 | 20,64 | 310 | 6,55 | ||||
| 2026-02-12 | 13F | M&G Plc | 485.743 | 9,45 | 11.658 | -2,71 | ||||
| 2026-01-22 | 13F | Pinnacle Bancorp, Inc. | 0 | -100,00 | 0 | |||||
| 2026-02-18 | 13F | State of Tennessee, Treasury Department | 0 | -100,00 | 0 | |||||
| 2026-03-06 | 13F | Hsbc Holdings Plc | 91.798 | 29,06 | 2.209 | 17,19 | ||||
| 2026-02-10 | 13F | Argent Trust Co | 0 | -100,00 | 0 | |||||
| 2026-02-13 | 13F | Van Eck Associates Corp | 15.627 | -4,35 | 0 | |||||
| 2025-11-13 | 13F | Glenmede Investment Management, LP | 21.745 | -46,33 | 585 | -48,64 | ||||
| 2026-02-13 | 13F | Toroso Investments, LLC | 0 | -100,00 | 0 | |||||
| 2026-02-13 | 13F | Dynamic Technology Lab Private Ltd | 0 | -100,00 | 0 | |||||
| 2026-02-14 | 13F | Rockefeller Capital Management L.P. | 5.982 | 4.969,49 | 142 | 4.633,33 | ||||
| 2026-02-04 | 13F | Pacer Advisors, Inc. | 0 | -100,00 | 0 | |||||
| 2026-02-06 | 13F | EverSource Wealth Advisors, LLC | 26 | -61,76 | 1 | -100,00 | ||||
| 2026-02-06 | 13F | Leonteq Securities AG | 20.000 | 475 | ||||||
| 2026-01-20 | 13F | Thurston, Springer, Miller, Herd & Titak, Inc. | 111 | 3 | ||||||
| 2026-02-12 | 13F | Brown Brothers Harriman & Co | 0 | -100,00 | 0 | |||||
| 2026-02-24 | 13F | Bell Investment Advisors, Inc | 147 | -11,45 | 3 | -25,00 | ||||
| 2025-09-29 | NP | CTSIX - Calamos Timpani Small Cap Growth Fund Class I | 81.403 | 5,32 | 2.407 | 34,77 | ||||
| 2026-02-02 | 13F | Montag A & Associates Inc | 0 | -100,00 | 0 | |||||
| 2025-09-29 | NP | YOVAX - YORKTOWN SMALL-CAP FUND Class A | 13.600 | 0,00 | 402 | 28,03 | ||||
| 2026-02-11 | 13F | Vestcor Inc | 7.128 | 0,00 | 0 | |||||
| 2026-02-17 | 13F | J. Goldman & Co LP | Put | 26.200 | -96,05 | 623 | -96,52 | |||
| 2025-10-31 | 13F | Whittier Trust Co | 0 | -100,00 | 0 | |||||
| 2026-02-12 | 13F | Senvest Management, LLC | Put | 0 | -100,00 | 0 | ||||
| 2025-11-14 | 13F/A | Massar Capital Management, LP | 0 | -100,00 | 0 | |||||
| 2026-02-17 | 13F | Oberweis Asset Management Inc/ | 0 | -100,00 | 0 | |||||
| 2026-02-05 | 13F | Cambridge Investment Research Advisors, Inc. | 8.897 | -91,05 | 0 | -100,00 | ||||
| 2026-02-13 | 13F | Walleye Capital LLC | Put | 4.700 | -59,48 | 112 | -64,42 | |||
| 2026-02-17 | 13F | D. E. Shaw & Co., Inc. | Put | 0 | -100,00 | 0 | ||||
| 2025-11-14 | 13F | Sandia Investment Management LP | 0 | -100,00 | 0 | |||||
| 2026-02-13 | 13F | Walleye Capital LLC | 15.005 | -94,27 | 357 | -94,95 | ||||
| 2026-02-13 | 13F | Walleye Capital LLC | Call | 30.700 | 52,74 | 730 | 35,00 | |||
| 2026-01-30 | 13F | Kohmann Bosshard Financial Services, LLC | 24 | 1 | ||||||
| 2026-01-09 | 13F | Diversified Trust Co | 0 | -100,00 | 0 | -100,00 | ||||
| 2026-02-17 | 13F | PDT Partners, LLC | 0 | -100,00 | 0 | |||||
| 2026-01-14 | 13F | ORG Partners LLC | 0 | -100,00 | 0 | |||||
| 2026-02-12 | 13F | Jane Street Group, Llc | Call | 44.000 | -51,27 | 1.046 | -56,98 | |||
| 2026-02-12 | 13F | Jane Street Group, Llc | 371.910 | -14,71 | 8.840 | -24,64 | ||||
| 2026-02-17 | 13F | D. E. Shaw & Co., Inc. | Call | 0 | -100,00 | 0 | ||||
| 2026-02-12 | 13F | Jane Street Group, Llc | Put | 8.700 | -53,97 | 207 | -59,45 | |||
| 2026-02-13 | 13F | Arrowstreet Capital, Limited Partnership | 873.326 | -72,50 | 20.759 | -75,70 | ||||
| 2026-02-13 | 13F | Victory Capital Management Inc | 926.751 | 45,32 | 22.029 | 28,41 | ||||
| 2026-02-17 | 13F | Point72 Asset Management, L.P. | 125.357 | 2.980 | ||||||
| 2026-02-10 | 13F | WASHINGTON TRUST Co | 116.630 | 2.772 | ||||||
| 2026-02-13 | 13F | Atlas Capital Advisors Llc | 2.660 | -25,30 | 63 | -36,36 | ||||
| 2026-02-17 | 13F | Ameriprise Financial Inc | 1.435.166 | 961,26 | 34.114 | 838,72 | ||||
| 2026-02-03 | 13F | Maxi Investments CY Ltd | 0 | -100,00 | 0 | |||||
| 2026-02-05 | 13F | Am Investment Strategies Llc | 375.045 | 0,00 | 9 | -20,00 | ||||
| 2026-02-17 | 13F | Cetera Investment Advisers | 27.332 | 12,98 | 650 | -0,15 | ||||
| 2026-01-07 | 13F | Harbour Capital Advisors, LLC | 0 | -100,00 | 0 | |||||
| 2026-02-13 | 13F | Ubs Oconnor Llc | 0 | -100,00 | 0 | |||||
| 2026-02-17 | 13F | Shellback Capital, LP | 30.150 | 0,00 | 717 | -11,71 | ||||
| 2026-02-12 | 13F | Wedbush Securities Inc | 0 | -100,00 | 0 | |||||
| 2026-02-12 | 13F | Sit Investment Associates Inc | 0 | -100,00 | 0 | |||||
| 2026-02-17 | 13F | Advisor Group Holdings, Inc. | 7.914 | -96,53 | 188 | -97,33 | ||||
| 2026-01-26 | 13F | Pursuit Wealth Management LLC | 18.115 | 431 | ||||||
| 2026-02-05 | 13F | Allworth Financial LP | 291 | 0,00 | 7 | -14,29 | ||||
| 2026-02-17 | 13F | D. E. Shaw & Co., Inc. | 29.123 | -36,52 | 692 | -43,92 | ||||
| 2026-02-17 | 13F | MIRAE ASSET GLOBAL ETFS HOLDINGS Ltd. | 32.782 | 56,29 | 779 | 38,12 | ||||
| 2026-01-30 | 13F | Wealthstar Advisors, Llc | 0 | -100,00 | 0 | |||||
| 2026-02-11 | 13F | LPL Financial LLC | 61.931 | -46,72 | 1.472 | -52,91 | ||||
| 2026-02-17 | 13F | Schonfeld Strategic Advisors LLC | 19.540 | 464 | ||||||
| 2026-02-17 | 13F | Durable Capital Partners LP | 5.956.331 | 141.582 | ||||||
| 2025-11-13 | 13F/A | Exor Capital LLP | 0 | -100,00 | 0 | -100,00 | ||||
| 2025-11-07 | 13F | Atticus Wealth Management, Llc | 0 | -100,00 | 0 | |||||
| 2026-02-04 | 13F | Atlantic Union Bankshares Corp | 0 | -100,00 | 0 | |||||
| 2026-02-10 | 13F | Bnp Paribas Arbitrage, Sa | 12.340 | -88,60 | 293 | -89,94 | ||||
| 2026-02-17 | 13F | Royal Bank Of Canada | 18.196 | 8,18 | 433 | -4,42 | ||||
| 2026-02-09 | 13F | Harbour Investments, Inc. | 0 | -100,00 | 0 | |||||
| 2026-02-03 | 13F | SBI Securities Co., Ltd. | 2.259 | 13,63 | 54 | 0,00 | ||||
| 2026-02-17 | 13F | Blair William & Co/il | 0 | -100,00 | 0 | |||||
| 2026-02-17 | 13F | Aquatic Capital Management LLC | 0 | -100,00 | 0 | |||||
| 2026-02-12 | 13F | Counterpoint Mutual Funds LLC | 13.033 | 310 | ||||||
| 2026-02-13 | 13F | Baldwin Investment Management, LLC | 32.627 | 0,00 | 776 | -11,63 | ||||
| 2026-02-17 | 13F | Susquehanna International Group, Llp | 424.707 | 10.095 | ||||||
| 2026-02-10 | 13F | BW Gestao de Investimentos Ltda. | 233.843 | 133,84 | 5.558 | 106,62 | ||||
| 2026-02-17 | 13F | Susquehanna International Group, Llp | Put | 114.000 | -22,08 | 2.710 | -31,16 | |||
| 2026-01-29 | 13F | UBS Group AG | 2.394.126 | 107,09 | 56.908 | 83,00 | ||||
| 2026-02-17 | 13F | XTX Topco Ltd | 22.908 | -55,35 | 545 | -60,58 | ||||
| 2025-11-13 | 13F | Marshall Wace, Llp | 0 | -100,00 | 0 | |||||
| 2026-02-02 | 13F | Truist Financial Corp | 9.722 | -53,38 | 231 | -58,75 | ||||
| 2026-02-12 | 13F | Voya Investment Management Llc | 0 | -100,00 | 0 | |||||
| 2026-02-17 | 13F | Susquehanna International Group, Llp | Call | 270.700 | -16,14 | 6.435 | -25,90 | |||
| 2026-02-17 | 13F | Balyasny Asset Management Llc | 22.213 | 528 | ||||||
| 2025-11-14 | 13F | Symmetry Peak Management Llc | Call | 0 | -100,00 | 0 | ||||
| 2026-02-17 | 13F | Qube Research & Technologies Ltd | 862.377 | -17,86 | 20.499 | -27,42 | ||||
| 2026-01-29 | 13F | Vanguard Group Inc | 93.856 | 0,00 | 2.231 | -11,65 | ||||
| 2026-02-03 | 13F | Grimes & Company, Inc. | 0 | -100,00 | 0 | |||||
| 2026-02-13 | 13F | Wells Fargo & Company/mn | 46.405 | -63,86 | 1.103 | -68,07 | ||||
| 2025-11-04 | 13F | Penserra Capital Management LLC | 0 | -100,00 | 0 | |||||
| 2026-02-13 | 13F | First Trust Advisors Lp | 11.334 | -91,07 | 269 | -92,12 | ||||
| 2025-09-29 | NP | CAMSX - Cambiar Small Cap Fund Investor Class Shares | 62.515 | 0,00 | 1.849 | 27,98 | ||||
| 2026-02-13 | 13F | Mariner, LLC | 210.501 | -1,61 | 5.004 | -17,77 | ||||
| 2026-02-17 | 13F | Jones Financial Companies Lllp | 349 | -33,65 | 8 | -46,67 | ||||
| 2025-11-14 | 13F | Susquehanna Fundamental Investments, Llc | 0 | -100,00 | 0 | |||||
| 2026-02-17 | 13F | Two Sigma Investments, Lp | 97.993 | -72,49 | 2.329 | -75,69 | ||||
| 2025-11-14 | 13F | Wolverine Trading, Llc | 0 | -100,00 | 0 | -100,00 | ||||
| 2026-02-17 | 13F | Caption Management, LLC | Put | 0 | -100,00 | 0 | ||||
| 2026-01-16 | 13F | Crewe Advisors LLC | 400 | 0,00 | 10 | -10,00 | ||||
| 2026-02-13 | 13F | Mml Investors Services, Llc | 0 | -100,00 | 0 | |||||
| 2026-02-17 | 13F | Caption Management, LLC | 0 | -100,00 | 0 | |||||
| 2026-02-17 | 13F | Canada Pension Plan Investment Board | 68.171.745 | 0,00 | 1.620.442 | -11,64 | ||||
| 2026-01-30 | 13F | Moody Aldrich Partners Llc | 169.614 | -4,55 | 4.032 | -15,67 | ||||
| 2026-02-13 | 13F | Kestra Advisory Services, LLC | 5.197 | 124 | ||||||
| 2026-02-02 | 13F | Fifth Third Bancorp | 62 | -99,53 | 1 | -99,72 | ||||
| 2026-01-23 | 13F | Rsm Us Wealth Management Llc | 15.165 | 28,17 | 367 | 15,09 | ||||
| 2026-01-15 | 13F | Zevenbergen Capital Investments Llc | 228.600 | 0,00 | 5.434 | -11,64 | ||||
| 2026-02-09 | 13F | Huntington National Bank | 3.753 | -11,34 | 89 | -21,24 | ||||
| 2026-01-30 | 13F | State of New Jersey Common Pension Fund D | 0 | -100,00 | 0 | |||||
| 2025-11-14 | 13F | Wolverine Trading, Llc | Call | 68.400 | 25,74 | 1.954 | 28,07 | |||
| 2025-11-14 | 13F | Wolverine Trading, Llc | Put | 17.300 | -5,98 | 494 | -4,26 | |||
| 2026-02-10 | 13F | Nomura Asset Management Co Ltd | 3.000 | 100,00 | 71 | 77,50 | ||||
| 2025-09-29 | NP | ODDS - Pacer BlueStar Digital Entertainment ETF | 4.358 | 147,75 | 129 | 220,00 | ||||
| 2026-02-12 | 13F | EAM Global Investors LLC | 0 | -100,00 | 0 | |||||
| 2026-02-17 | 13F | Silvercrest Asset Management Group Llc | 28.508 | 34,41 | 678 | 18,77 | ||||
| 2025-10-31 | 13F | Whittier Trust Co Of Nevada Inc | 0 | -100,00 | 0 | |||||
| 2026-02-13 | 13F | Lord, Abbett & Co. Llc | 926.698 | -1,79 | 22 | -12,00 | ||||
| 2026-01-27 | 13F | First Horizon Corp | 731 | 0,00 | 17 | -10,53 | ||||
| 2025-09-29 | NP | CAMMX - Cambiar Smid Fund Investor Class Shares | 58.110 | -40,77 | 1.718 | -24,22 | ||||
| 2026-02-13 | 13F | Goldstone Financial Group, LLC | 18.547 | 13,60 | 441 | 0,23 | ||||
| 2026-02-03 | 13F | Navellier & Associates Inc | 73.245 | 5,53 | 1.741 | -6,75 | ||||
| 2025-11-14 | 13F | Nissay Asset Management Corp /japan/ /adv | 0 | -100,00 | 0 | -100,00 | ||||
| 2025-09-29 | NP | CTOGX - Calamos Timpani SMID Growth Fund Class R6 | 6.073 | -9,91 | 180 | 15,48 | ||||
| 2026-02-17 | 13F | Sciencast Management LP | 51.341 | 361,91 | 1.220 | 309,40 | ||||
| 2026-02-18 | 13F | GWM Advisors LLC | 42.890 | 1.019 | ||||||
| 2026-02-17 | 13F | Trexquant Investment LP | 20.755 | -62,44 | 493 | -66,82 | ||||
| 2026-01-23 | 13F | Assetmark, Inc | 54 | -99,47 | 1 | -99,64 | ||||
| 2026-02-17 | 13F | Portolan Capital Management, LLC | 0 | -100,00 | 0 | |||||
| 2026-01-29 | 13F | D.a. Davidson & Co. | Call | 0 | -100,00 | 0 | ||||
| 2026-01-29 | 13F | IMC-Chicago, LLC | 150.214 | 370,98 | 3.571 | 316,57 | ||||
| 2026-02-17 | 13F | Occudo Quantitative Strategies Lp | 43.614 | 1.037 | ||||||
| 2025-11-07 | 13F | CenterBook Partners LP | 81.770 | -4,80 | 2.200 | -8,79 | ||||
| 2025-11-14 | 13F | Science & Technology Partners, L.P. | 0 | -100,00 | 0 | |||||
| 2025-11-17 | 13F | Alyeska Investment Group, L.P. | 0 | -100,00 | 0 | -100,00 | ||||
| 2026-01-26 | 13F | Private Trust Co Na | 0 | -100,00 | 0 | |||||
| 2026-02-10 | 13F | Commonwealth Of Pennsylvania Public School Empls Retrmt Sys | 0 | -100,00 | 0 | |||||
| 2026-01-12 | 13F | Moody National Bank Trust Division | 82.306 | -30,28 | 1.956 | -38,39 | ||||
| 2026-02-17 | 13F | Public Employees Retirement System Of Ohio | 53.015 | -88,91 | 1.260 | -90,20 | ||||
| 2025-11-14 | 13F | Raymond James Financial Inc | 0 | -100,00 | 0 | |||||
| 2026-02-13 | 13F | Transamerica Financial Advisors, Inc. | 0 | -100,00 | 0 | |||||
| 2026-02-12 | 13F | Northwest & Ethical Investments L.P. | 14.745 | 7,71 | 356 | -8,72 | ||||
| 2026-02-11 | 13F | Nixon Capital, LLC | 332.042 | 1,17 | 7.893 | -10,60 | ||||
| 2026-02-12 | 13F | Brinker Capital Investments, LLC | 0 | -100,00 | 0 | |||||
| 2025-11-07 | 13F | Readystate Asset Management Lp | 0 | -100,00 | 0 | |||||
| 2026-02-12 | 13F | Loomis Sayles & Co L P | 0 | -100,00 | 0 | |||||
| 2026-01-29 | 13F | Kestra Private Wealth Services, Llc | 17.007 | 99,45 | 404 | 76,42 | ||||
| 2026-01-20 | 13F | Toth Financial Advisory Corp | 0 | -100,00 | 0 | |||||
| 2026-02-11 | 13F | Picton Mahoney Asset Management | 368.286 | 15,49 | 8.754 | 109.325,00 | ||||
| 2026-02-11 | 13F | O'shaughnessy Asset Management, Llc | 0 | -100,00 | 0 | |||||
| 2025-11-14 | 13F | Ancora Advisors, LLC | 0 | -100,00 | 0 | -100,00 | ||||
| 2026-02-17 | 13F | Ghisallo Capital Management LLC | 0 | -100,00 | 0 | |||||
| 2026-02-17 | 13F | Engineers Gate Manager LP | 38.270 | -81,44 | 910 | -83,61 | ||||
| 2026-02-13 | 13F | Caitong International Asset Management Co., Ltd | 1.286 | 93,09 | 31 | 76,47 | ||||
| 2025-11-13 | 13F | Vinva Investment Management Ltd | 0 | -100,00 | 0 | |||||
| 2025-11-13 | 13F | Perbak Capital Partners LLP | 0 | -100,00 | 0 | |||||
| 2026-01-27 | 13F | Asset Management One Co., Ltd. | 125.641 | 2.941 | ||||||
| 2026-01-30 | 13F | Us Bancorp \de\ | 34.642 | -17,53 | 823 | -27,10 | ||||
| 2026-02-12 | 13F | Hrt Financial Lp | 183.224 | 4,40 | 4 | 0,00 | ||||
| 2025-11-14 | 13F | Peak6 Llc | Call | 0 | -100,00 | 0 | -100,00 | |||
| 2026-01-29 | 13F | D.a. Davidson & Co. | 0 | -100,00 | 0 | |||||
| 2026-02-06 | 13F | Global Retirement Partners, LLC | 495 | -91,20 | 12 | -92,72 | ||||
| 2026-02-06 | 13F | Pnc Financial Services Group, Inc. | 560 | -15,15 | 13 | -23,53 | ||||
| 2025-09-29 | NP | LAGWX - LORD ABBETT DEVELOPING GROWTH FUND INC Class A | 698.549 | 20.656 | ||||||
| 2026-01-30 | 13F/A | M&t Bank Corp | 9.145 | 0,00 | 217 | -11,79 | ||||
| 2026-02-13 | 13F | Morgan Stanley | 1.624.216 | -37,53 | 38.608 | -44,80 | ||||
| 2026-01-30 | 13F | Jennison Associates Llc | 0 | -100,00 | 0 | |||||
| 2026-02-13 | 13F | Bridgewater Associates, LP | 33.997 | 808 | ||||||
| 2026-02-05 | 13F | Td Private Client Wealth Llc | 0 | -100,00 | 0 | -100,00 | ||||
| 2026-02-13 | 13F | Battery Global Advisors, LLC | 0 | -100,00 | 0 | |||||
| 2025-11-14 | 13F | Main Management ETF Advisors, LLC | 0 | -100,00 | 0 | |||||
| 2026-02-13 | 13F | Vontobel Holding Ltd. | 0 | -100,00 | 0 | |||||
| 2026-01-30 | 13F | Shaker Investments Llc/oh | 49.618 | -2,90 | 1.179 | -14,19 | ||||
| 2026-02-11 | 13F | Group One Trading, L.p. | 22.402 | 532 | ||||||
| 2026-01-26 | 13F | Cwm, Llc | 2.475 | 315,97 | 0 | |||||
| 2026-02-13 | 13F | Divisadero Street Capital Management, LP | 0 | -100,00 | 0 | |||||
| 2026-02-06 | 13F | Legato Capital Management LLC | 16.276 | 71,16 | 387 | 51,37 | ||||
| 2026-01-22 | 13F | Massachusetts Financial Services Co /ma/ | 6.067.263 | -0,62 | 144.219 | -12,18 | ||||
| 2026-02-13 | 13F | American Century Companies Inc | 0 | -100,00 | 0 | |||||
| 2026-02-11 | 13F | Deutsche Bank Ag\ | 125.374 | 0,12 | 2.980 | -11,52 | ||||
| 2026-02-12 | 13F | Wealthspire Advisors, LLC | 0 | -100,00 | 0 | |||||
| 2026-02-13 | 13F | Barclays Plc | 341.700 | 318,94 | 8.122 | 270,19 | ||||
| 2026-01-23 | 13F | Farther Finance Advisors, LLC | 3.431 | 436,09 | 82 | 376,47 | ||||
| 2026-02-17 | 13F | Russell Investments Group, Ltd. | 59.602 | -64,42 | 1.417 | -69,18 | ||||
| 2026-02-11 | 13F | Manchester Capital Management LLC | 0 | -100,00 | 0 | -100,00 | ||||
| 2026-02-17 | 13F | Lazard Asset Management Llc | 155.995 | -29,62 | 3.708 | -37,81 | ||||
| 2026-02-17 | 13F | Prelude Capital Management, Llc | 0 | -100,00 | 0 | |||||
| 2026-02-09 | 13F | Geode Capital Management, Llc | 196.012 | 4,03 | 4.659 | -8,07 | ||||
| 2026-02-02 | 13F | Principal Financial Group Inc | 1.354.900 | 31,02 | 32.206 | 15,77 | ||||
| 2026-02-12 | 13F | Marex Group plc | 12.737 | 303 | ||||||
| 2026-02-13 | 13F | Citigroup Inc | 38.150 | 7.965,54 | 907 | 7.450,00 | ||||
| 2026-02-10 | 13F | Natixis Advisors, L.p. | 0 | -100,00 | 0 | |||||
| 2026-01-29 | 13F | Calamos Advisors LLC | 0 | -100,00 | 0 | |||||
| 2026-02-17 | 13F | Twinbeech Capital Lp | 141.339 | 26,25 | 3.360 | 11,56 | ||||
| 2025-11-13 | 13F | Riggs Asset Managment Co. Inc. | 0 | -100,00 | 0 | |||||
| 2026-01-13 | 13F | CoreCap Advisors, LLC | 17.552 | -7,29 | 417 | -18,07 | ||||
| 2025-11-10 | 13F | Rossby Financial, LCC | 0 | -100,00 | 0 | -100,00 | ||||
| 2025-12-15 | 13F | FNY Investment Advisers, LLC | 0 | -100,00 | 0 | |||||
| 2026-02-17 | 13F | Numerai GP LLC | 13.021 | -83,12 | 310 | -85,11 | ||||
| 2026-01-26 | 13F | Mirae Asset Global Investments Co., Ltd. | 0 | -100,00 | 0 | |||||
| 2026-02-13 | 13F | Hudson Bay Capital Management LP | Put | 0 | -100,00 | 0 | ||||
| 2026-02-17 | 13F | Kingdon Capital Management, L.l.c. | 674.000 | 42,19 | 16.021 | 25,65 | ||||
| 2026-02-17 | 13F | Fortress Investment Group LLC | 0 | -100,00 | 0 | |||||
| 2025-11-17 | 13F | Adalta Capital Management LLC | 0 | -100,00 | 0 | |||||
| 2026-02-13 | 13F | Rice Hall James & Associates, Llc | 1.140.417 | 42,69 | 27.108 | 26,09 | ||||
| 2026-01-23 | 13F | Cambiar Investors Llc | 230.738 | -2,26 | 5.485 | -13,64 | ||||
| 2026-02-17 | 13F | Voleon Capital Management Lp | 182.393 | -2,53 | 4.335 | -13,87 | ||||
| 2026-02-17 | 13F | Fmr Llc | 4.726.128 | -42,15 | 112.340 | -48,88 | ||||
| 2026-02-13 | 13F | Hudson Bay Capital Management LP | 0 | -100,00 | 0 | |||||
| 2026-02-13 | 13F | Barclays Plc | Put | 0 | -100,00 | 0 | -100,00 | |||
| 2025-09-29 | NP | GURU - Global X Guru Index ETF This fund is a listed as child fund of Mirae Asset Global Investments Co., Ltd. and if that institution has disclosed ownership in this security, then these positions will not be double counted when calculating total shares and total value | 25.570 | -2,51 | 756 | 24,75 | ||||
| 2025-11-12 | 13F | Aptus Capital Advisors, LLC | 0 | -100,00 | 0 | |||||
| 2026-02-17 | 13F | Radcliff Management LLC | 13.135.000 | 0,00 | 312.219 | -11,64 | ||||
| 2026-02-06 | 13F | Larson Financial Group LLC | 0 | -100,00 | 0 | |||||
| 2026-02-19 | 13F | Invesco Ltd. | 2.042.637 | -31,64 | 48.553 | -39,60 | ||||
| 2026-02-13 | 13F | Verition Fund Management LLC | 93.730 | 64,53 | 2.228 | 45,37 | ||||
| 2026-02-17 | 13F | Cresset Asset Management, LLC | 14.178 | -12,64 | 337 | -22,71 | ||||
| 2026-02-13 | 13F | Ashford Capital Management Inc | 530.280 | 12.605 | ||||||
| 2026-02-17 | 13F | Graham Capital Management, L.P. | 13.076 | 0,00 | 311 | -11,68 | ||||
| 2026-02-17 | 13F | Ilex Capital Partners (UK) LLP | 2.642.232 | 126,34 | 62.806 | 100,00 | ||||
| 2026-02-17 | 13F | Granahan Investment Management Inc/ma | 0 | -100,00 | 0 | |||||
| 2025-10-30 | 13F | Parkside Financial Bank & Trust | 0 | -100,00 | 0 | |||||
| 2026-02-17 | 13F | Millennium Management Llc | 235.716 | -3,27 | 5.603 | -14,53 | ||||
| 2026-03-12 | 13F/A | Peak6 Llc | 39.724 | 944 | ||||||
| 2026-02-17 | 13F | Scientech Research LLC | 0 | -100,00 | 0 | |||||
| 2025-10-30 | 13F | Joel Isaacson & Co., LLC | 0 | -100,00 | 0 | |||||
| 2026-02-04 | 13F | Independent Advisor Alliance | 40.723 | -7,17 | 968 | -18,05 | ||||
| 2026-02-10 | 13F | Goldman Sachs Group Inc | 461.493 | 0,91 | 10.970 | -10,84 | ||||
| 2026-02-10 | 13F | Norges Bank | 1.508.884 | 35.866 | ||||||
| 2026-02-10 | 13F | Envestnet Asset Management Inc | 30.540 | -73,26 | 726 | -76,40 | ||||
| 2026-02-17 | 13F | Tudor Investment Corp Et Al | 149.200 | 3.546 | ||||||
| 2026-02-17 | 13F | Tudor Investment Corp Et Al | Call | 10.600 | 252 | |||||
| 2026-02-17 | 13F | Two Sigma Advisers, Lp | 136.500 | -48,99 | 3.245 | -54,93 | ||||
| 2026-02-12 | 13F | CIBC Private Wealth Group, LLC | 2.061 | 0,00 | 49 | -12,73 | ||||
| 2026-02-13 | 13F | JustInvest LLC | 0 | -100,00 | 0 | |||||
| 2026-02-17 | 13F | Sora Investors Llc | 0 | -100,00 | 0 | |||||
| 2026-01-16 | 13F | TB Alternative Assets Ltd. | 0 | -100,00 | 0 | -100,00 | ||||
| 2026-01-27 | 13F | WealthCollab, LLC | 443 | 0,00 | 11 | -9,09 | ||||
| 2026-02-12 | 13F | Mindset Wealth Management, Llc | 10.971 | 22,01 | 261 | 7,88 | ||||
| 2026-02-10 | 13F | Td Asset Management Inc | 687.908 | 26,90 | 16.352 | 12,13 | ||||
| 2026-02-11 | 13F | Empowered Funds, LLC | 1.317 | 31 | ||||||
| 2026-02-17 | 13F | Susquehanna Portfolio Strategies, LLC | 0 | -100,00 | 0 | |||||
| 2026-02-17 | 13F | Armistice Capital, Llc | 10.940 | 260 | ||||||
| 2026-02-17 | 13F | Glenmede Trust Co Na | 25.500 | -21,70 | 606 | -13,92 | ||||
| 2026-02-13 | 13F | Soros Fund Management Llc | 0 | -100,00 | 0 | |||||
| 2025-11-13 | 13F | FIL Ltd | 0 | -100,00 | 0 | |||||
| 2026-02-09 | 13F | Williamson Legacy Group, LLC | 0 | -100,00 | 0 | |||||
| 2026-02-17 | 13F | Bank Of America Corp /de/ | 1.317.910 | -23,75 | 31.327 | -32,62 | ||||
| 2026-02-09 | 13F | William Blair Investment Management, Llc | 1.118.791 | -4,71 | 26.594 | -15,79 | ||||
| 2026-02-17 | 13F | Tower Research Capital LLC (TRC) | 0 | -100,00 | 0 | |||||
| 2026-02-17 | 13F | Price T Rowe Associates Inc /md/ | 0 | -100,00 | 0 | |||||
| 2026-02-17 | 13F | Greycroft LP | 130.000 | 550,00 | 3.090 | 474,35 | ||||
| 2026-02-17 | 13F | Citadel Advisors Llc | Call | 227.200 | -9,66 | 5.401 | -20,18 | |||
| 2026-02-17 | 13F | Janus Henderson Group Plc | 4.156.164 | -5,58 | 98.792 | -16,57 | ||||
| 2026-02-12 | 13F | Principal Securities, Inc. | 0 | -100,00 | 0 | |||||
| 2026-02-17 | 13F | Citadel Advisors Llc | Put | 502.300 | 43,64 | 11.940 | 26,93 | |||
| 2026-02-17 | 13F | Captrust Financial Advisors | 768.150 | 37,36 | 18.259 | 21,37 | ||||
| 2026-02-17 | 13F | Citadel Advisors Llc | 867.311 | 92,92 | 20.616 | 70,47 | ||||
| 2026-02-13 | 13F | Itau Unibanco Holding S.A. | 1.905 | 45 | ||||||
| 2026-02-10 | 13F | Acadian Asset Management Llc | 12.037 | -99,27 | 0 | -100,00 | ||||
| 2026-02-12 | 13F | Wasatch Advisors Inc | 0 | -100,00 | 0 | |||||
| 2026-02-13 | 13F | Sei Investments Co | 84.098 | -20,23 | 1.999 | -29,49 | ||||
| 2026-02-12 | 13F | Castleark Management Llc | 0 | -100,00 | 0 | |||||
| 2026-02-12 | 13F | Renaissance Technologies Llc | 183.400 | 155,79 | 4.359 | 126,09 | ||||
| 2026-02-13 | 13F | Virtus ETF Advisers LLC | 7.200 | 0,00 | 171 | -11,40 | ||||
| 2026-02-17 | 13F | Advisory Services Network, LLC | 0 | -100,00 | 0 | |||||
| 2026-02-13 | 13F | Diametric Capital, LP | 24.839 | 144,24 | 590 | 116,12 | ||||
| 2025-11-14 | 13F | Needham Investment Management Llc | 0 | -100,00 | 0 | |||||
| 2026-02-09 | 13F | Penn Capital Management Co Inc | 62.938 | 30,88 | 1.520 | 15,41 | ||||
| 2025-11-06 | 13F | Oppenheimer & Co Inc | 0 | -100,00 | 0 | -100,00 | ||||
| 2026-02-17 | 13F | Greenhouse Funds LLLP | 6.621.554 | 4,87 | 157.394 | -7,33 | ||||
| 2026-02-17 | 13F | Greenhouse Funds LLLP | Call | 750.000 | 17.828 | |||||
| 2025-09-29 | NP | CFSSX - Column Small Cap Select Fund | 121.199 | 2,88 | 3.750 | 33,13 | ||||
| 2026-02-05 | 13F | Gabelli Funds Llc | 54.400 | 8,80 | 1.293 | -3,87 | ||||
| 2026-02-09 | 13F | Hartland & Co., LLC | 1.800 | 0,00 | 43 | -12,50 | ||||
| 2026-02-17 | 13F | Driehaus Capital Management Llc | 0 | -100,00 | 0 | |||||
| 2026-02-17 | 13F | Jericho Capital Asset Management L.P. | 3.160.174 | 75.117 | ||||||
| 2026-02-10 | 13F | State of Wyoming | 17.881 | -3,02 | 425 | -14,14 | ||||
| 2026-01-23 | 13F | Yorktown Management & Research Co Inc | 42.100 | 0,00 | 1.001 | -11,66 | ||||
| 2026-02-13 | 13F | Quarry LP | 601 | 14 | ||||||
| 2026-01-29 | 13F | Nbc Securities, Inc. | 104 | 0,00 | 2 | 0,00 | ||||
| 2026-02-13 | 13F | Fieldview Capital Management, LLC | 44.510 | 1.058 | ||||||
| 2026-02-10 | 13F | Bank of New York Mellon Corp | 15.711 | 17,22 | 373 | 3,61 | ||||
| 2026-02-17 | 13F | Advaya LLP | 993.300 | 23.611 | ||||||
| 2026-02-13 | 13F | Arvin Capital Management LP | 59.800 | 1.421 | ||||||
| 2026-02-17 | 13F | Symmetry Investments LP | 86.000 | 2.044 | ||||||
| 2026-01-30 | 13F | Wealth High Governance Capital Ltda | 366.157 | 144,11 | 8.704 | 115,74 | ||||
| 2026-02-17 | 13F | J. Goldman & Co LP | 0 | -100,00 | 0 | |||||
| 2026-02-03 | 13F | K.J. Harrison & Partners Inc | 0 | -100,00 | 0 | |||||
| 2025-11-14 | 13F | Corton Capital Inc. | 0 | -100,00 | 0 | |||||
| 2026-02-10 | 13F | Fortis Advisors, LLC | 0 | -100,00 | 0 | |||||
| 2026-02-17 | 13F | T. Rowe Price Investment Management, Inc. | 6.040.204 | -40,50 | 144 | -47,62 | ||||
| 2026-02-04 | 13F | Dogwood Wealth Management LLC | 133 | -37,26 | 3 | -40,00 | ||||
| 2026-02-17 | 13F | ArrowMark Colorado Holdings LLC | 367.900 | -30,70 | 8.745 | -38,77 | ||||
| 2026-02-02 | 13F | Strs Ohio | 248.100 | 0,00 | 5.897 | -11,63 | ||||
| 2025-09-29 | NP | APITX - Yorktown Growth Fund Class L Shares | 28.500 | 0,00 | 843 | 27,96 | ||||
| 2026-02-10 | 13F | Quantbot Technologies LP | 110.618 | 159,12 | 2.629 | 129,01 | ||||
| 2026-02-17 | 13F | Cypress Point Investment Management Lp | 1.275.998 | 30.341 | ||||||
| 2026-02-13 | 13F | MAI Capital Management | 42 | 0,00 | 1 | -100,00 | ||||
| 2026-02-03 | 13F | Wilson Asset Management (international) Pty Ltd | 0 | -100,00 | 0 | |||||
| 2026-02-13 | 13F | Walleye Trading LLC | Call | 18.500 | -33,93 | 440 | -41,70 | |||
| 2026-02-13 | 13F | Walleye Trading LLC | 14.573 | 346 | ||||||
| 2026-02-13 | 13F | Neuberger Berman Group LLC | 0 | -100,00 | 0 | |||||
| 2026-02-13 | 13F | Walleye Trading LLC | Put | 25.500 | 259,15 | 606 | 218,95 | |||
| 2025-10-31 | 13F | Y-Intercept (Hong Kong) Ltd | 0 | -100,00 | 0 | |||||
| 2026-02-12 | 13F | EAM Investors, LLC | 0 | -100,00 | 0 | |||||
| 2026-02-12 | 13F | Granite Investment Partners, LLC | 0 | -100,00 | 0 | |||||
| 2026-02-11 | 13F | Parallel Advisors, LLC | 15.451 | 15,25 | 367 | 1,94 | ||||
| 2026-02-17 | 13F | Voloridge Investment Management, Llc | 18.194 | -79,09 | 432 | -81,54 | ||||
| 2026-02-17 | 13F | Jump Financial, LLC | 286.359 | 119,99 | 6.807 | 94,40 | ||||
| 2026-02-12 | 13F | BlackRock, Inc. | 105.787 | 21,90 | 2.515 | 7,71 | ||||
| 2026-02-11 | 13F | Simplex Trading, Llc | 36.189 | 860 | ||||||
| 2026-02-12 | 13F | Federated Hermes, Inc. | 2.782.000 | -11,36 | 66.128 | -21,67 | ||||
| 2026-02-13 | 13F | Healthcare Of Ontario Pension Plan Trust Fund | 196.126 | 4.662 | ||||||
| 2026-01-30 | 13F | North Star Investment Management Corp. | 5.000 | 0,00 | 119 | -11,94 | ||||
| 2026-02-13 | 13F | National Bank Of Canada /fi/ | 237 | -4,44 | 6 | -16,67 | ||||
| 2026-02-13 | 13F | OMERS ADMINISTRATION Corp | 0 | -100,00 | 0 | |||||
| 2025-11-13 | 13F | Sellaronda Global Management LP | 0 | -100,00 | 0 | |||||
| 2025-09-29 | NP | CVGRX - Calamos Growth Fund Class A | 27.385 | 16,84 | 810 | 49,54 | ||||
| 2026-02-17 | 13F | Magnetar Financial LLC | 0 | -100,00 | 0 | |||||
| 2025-11-14 | 13F | Quantessence Capital LLC | 0 | -100,00 | 0 | |||||
| 2025-11-13 | 13F | Nicolet Advisory Services, Llc | 0 | -100,00 | 0 | |||||
| 2026-02-10 | 13F | 1492 Capital Management LLC | 190.115 | 1,42 | 4.519 | -10,37 | ||||
| 2025-10-30 | 13F | Rakuten Investment Management, Inc. | 0 | -100,00 | 0 | |||||
| 2026-02-05 | 13F | Left Brain Wealth Management, LLC | 0 | -100,00 | 0 | -100,00 | ||||
| 2026-01-14 | 13F | Baron Wealth Management LLC | 0 | -100,00 | 0 | |||||
| 2026-02-05 | 13F | Bessemer Group Inc | 5.451 | 1,41 | 0 | |||||
| 2026-02-06 | 13F | Technology Crossover Management IX, Ltd. | 29.203.147 | 0,00 | 694.159 | -11,64 | ||||
| 2026-02-12 | 13F | Commonwealth Equity Services, Llc | 0 | -100,00 | 0 | |||||
| 2026-02-17 | 13F | PharVision Advisers, LLC | 8.900 | 212 | ||||||
| 2026-02-11 | 13F | Fox Run Management, L.l.c. | 19.070 | 453 | ||||||
| 2025-11-21 | 13F | Nebula Research & Development LLC | 0 | -100,00 | 0 | |||||
| 2026-01-14 | 13F | Spire Wealth Management | 10.629 | -13,39 | 253 | -23,64 | ||||
| 2026-02-05 | 13F | Stephens Investment Management Group LLC | 2.214.678 | 52.643 | ||||||
| 2026-01-30 | 13F | Rachor Investment Advisory Services, LLC | 11 | 0 | ||||||
| 2026-03-04 | 13F | SHP Wealth Management | 3.624 | 86 | ||||||
| 2026-02-13 | 13F | Manufacturers Life Insurance Company, The | 0 | -100,00 | 0 | |||||
| 2026-02-12 | 13F | TPG-AXON Management LP | 292.600 | 6.955 | ||||||
| 2026-02-17 | 13F | Caption Management, LLC | Call | 40.000 | 0,00 | 951 | -11,71 | |||
| 2026-02-13 | 13F | Squarepoint Ops LLC | 60.384 | -57,93 | 1.435 | -62,82 | ||||
| 2025-11-14 | 13F | 1832 Asset Management L.P. | 0 | -100,00 | 0 | -100,00 |
Other Listings
| US:SRAD | 18,00 $ |