Grundlæggende statistik
| Institutionelle aktier (lange) | 14.736.476 - 20,15% (ex 13D/G) - change of 4,55MM shares 44,70% MRQ |
| Institutionel værdi (lang) | $ 46.295 USD ($1000) |
Institutionelt ejerskab og aktionærer
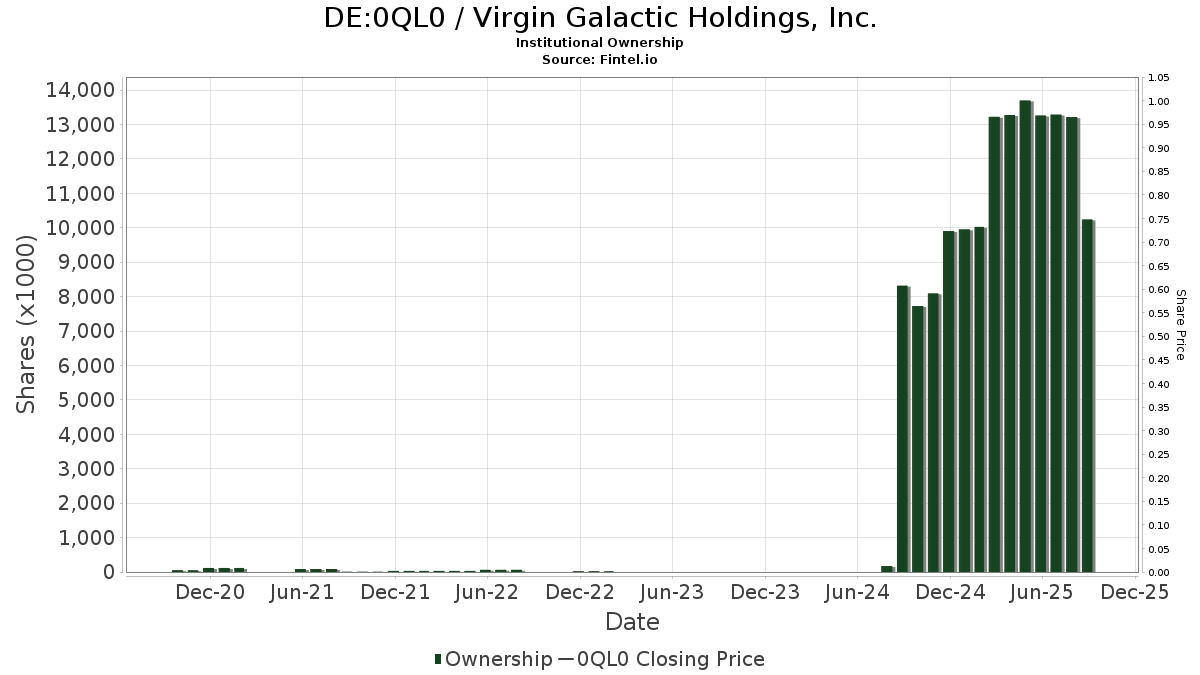
Virgin Galactic Holdings, Inc. (DE:0QL0) har 167 institutionelle ejere og aktionærer, der har indsendt 13D/G- eller 13F-formularer til Securities Exchange Commission (SEC). Disse institutioner har i alt 14,736,476 aktier. Største aktionærer omfatter Wolverine Asset Management Llc, Vanguard Group Inc, Susquehanna International Group, Llp, Susquehanna International Group, Llp, BlackRock, Inc., Citadel Advisors Llc, Jane Street Group, Llc, UBS Group AG, Susquehanna International Group, Llp, and Morgan Stanley .
Virgin Galactic Holdings, Inc. (DB:0QL0) institutionel ejerskabsstruktur viser aktuelle positioner i virksomheden efter institutioner og fonde, samt seneste ændringer i positionsstørrelse. Større aktionærer kan omfatte individuelle investorer, investeringsforeninger, hedgefonde eller institutioner. Skema 13D angiver, at investoren besidder (eller besidder) mere end 5 % af virksomheden og har til hensigt (eller har til hensigt at) aktivt at forfølge en ændring i forretningsstrategi. Skema 13G indikerer en passiv investering på over 5%.
The share price as of April 2, 2026 is 2,22 / share. Previously, on April 7, 2025, the share price was 2,23 / share. This represents a decline of 0,58% over that period.
Fondens stemningsscore
Fund Sentiment Score (fka Ownership Accumulation Score) finder de aktier, der bliver mest købt af fonde. Det er resultatet af en sofistikeret, multi-faktor kvantitativ model, der identificerer virksomheder med de højeste niveauer af institutionel akkumulering. Scoringsmodellen bruger en kombination af den samlede stigning i oplyste ejere, ændringerne i porteføljeallokeringer i disse ejere og andre målinger. Tallet går fra 0 til 100, hvor højere tal indikerer et højere niveau af akkumulering for sine jævnaldrende, og 50 er gennemsnittet.
Opdateringsfrekvens: Dagligt
Se Ownership Explorer, som giver en liste over højest rangerende virksomheder.
AI+ Ask Fintel’s AI assistant about Virgin Galactic Holdings, Inc..
Select a question to share a public post with an AI-crafted answer.
Thinking of good questions…
13F og NPORT arkivering
Detaljer om 13F-arkivering er gratis. Detaljer om NP-ansøgninger kræver et premium-medlemskab. Grønne rækker angiver nye positioner. Røde rækker angiver lukkede positioner. Klik på linket ikon for at se den fulde transaktionshistorik.
Opgrader
for at låse premium-data op og eksportere til Excel ![]() .
.
| Fil dato | Kilde | Investor | Type | Gennemsnitlig pris (Øst) |
Aktier | Δ Aktier (%) |
Rapporteret Værdi ($1000) |
Δ Værdi (%) |
Port Alloc (%) |
|
|---|---|---|---|---|---|---|---|---|---|---|
| 2025-11-12 | 13F | Catalyst Funds Management Pty Ltd | 0 | -100,00 | 0 | |||||
| 2025-11-07 | 13F | Atticus Wealth Management, Llc | 0 | -100,00 | 0 | |||||
| 2026-02-17 | 13F | Northern Trust Corp | 140.419 | 9,06 | 451 | -9,46 | ||||
| 2025-11-14 | 13F | Strategic Wealth Partners, Ltd. | 2 | 0,00 | 0 | |||||
| 2026-01-30 | 13F | Bogart Wealth, LLC | 1 | 0,00 | 0 | |||||
| 2026-02-13 | 13F | JustInvest LLC | 12.915 | 2,76 | 41 | -14,58 | ||||
| 2025-11-14 | 13F | Dark Forest Capital Management Lp | 107.481 | 0,00 | 293 | 0,00 | ||||
| 2026-01-22 | 13F | Vision Financial Markets Llc | 25 | 0,00 | 0 | |||||
| 2026-02-03 | 13F | McIlrath & Eck, LLC | 11 | 0,00 | 0 | |||||
| 2026-02-09 | 13F | SLT Holdings LLC | Call | 0 | -100,00 | 0 | -100,00 | |||
| 2026-02-17 | 13F | Dv Equities, Llc | 556 | 2 | ||||||
| 2026-02-05 | 13F | Allworth Financial LP | 151 | -9,04 | 0 | |||||
| 2026-02-26 | 13F/A | Sculptor Capital LP | Put | 0 | -100,00 | 0 | ||||
| 2026-02-13 | 13F | DeepCurrents Investment Group LLC | Put | 1.584 | -21,82 | 508 | -35,04 | |||
| 2026-02-12 | 13F | SWAN Capital LLC | 0 | -100,00 | 0 | |||||
| 2026-02-17 | 13F | Clear Street Markets Llc | 0 | -100,00 | 0 | |||||
| 2026-02-02 | 13F | Truist Financial Corp | 45.000 | 78,22 | 144 | 48,45 | ||||
| 2026-02-13 | 13F | Headlands Technologies LLC | 0 | -100,00 | 0 | -100,00 | ||||
| 2026-04-02 | 13F | Marex Group plc | 127.734 | -49,29 | 387 | -73,87 | ||||
| 2026-02-17 | 13F | Bank Of America Corp /de/ | 48.325 | 110,09 | 155 | 76,14 | ||||
| 2026-02-14 | 13F | Rockefeller Capital Management L.P. | 20 | 0,00 | 0 | |||||
| 2026-01-23 | 13F | DHJJ Financial Advisors, Ltd. | 7 | 0,00 | 0 | |||||
| 2026-02-05 | 13F | Bank Julius Baer & Co. Ltd, Zurich | 12.300 | 0,00 | 39 | -17,02 | ||||
| 2026-01-21 | 13F | Sound Income Strategies, LLC | 610 | 2 | ||||||
| 2026-02-17 | 13F | Gladstone Institutional Advisory LLC | 0 | -100,00 | 0 | |||||
| 2026-02-06 | 13F | Global Retirement Partners, LLC | 54 | 0,00 | 0 | |||||
| 2025-11-04 | 13F | Guerra Advisors Inc | 6 | 0 | ||||||
| 2026-02-17 | 13F | D. E. Shaw & Co., Inc. | Call | 162.200 | 0,00 | 521 | -16,93 | |||
| 2026-02-17 | 13F | Ameriflex Group, Inc. | 32 | 0 | ||||||
| 2025-10-15 | 13F | Private Trust Co Na | 0 | -100,00 | 0 | |||||
| 2026-02-17 | 13F | D. E. Shaw & Co., Inc. | 434.503 | -35,45 | 1.395 | -46,34 | ||||
| 2026-01-07 | 13F | Aventura Private Wealth, LLC | 24 | 0,00 | 0 | |||||
| 2026-01-09 | 13F | SG Americas Securities, LLC | 0 | -100,00 | 0 | |||||
| 2026-02-13 | 13F | Morgan Stanley | 727.289 | 30,44 | 2.335 | 8,46 | ||||
| 2026-02-17 | 13F | Aqr Capital Management Llc | 0 | -100,00 | 0 | -100,00 | ||||
| 2026-02-13 | 13F | Golden State Wealth Management, LLC | 33 | 6,45 | 0 | |||||
| 2025-12-09 | 13F | Painted Porch Advisors LLC | 0 | -100,00 | 0 | |||||
| 2026-01-23 | 13F | Farther Finance Advisors, LLC | 3.076 | -5,99 | 10 | -25,00 | ||||
| 2026-02-02 | 13F | Wolverine Asset Management Llc | Put | 4.042.300 | -31,83 | 12.976 | -43,31 | |||
| 2025-10-08 | 13F/A | New York State Common Retirement Fund | 0 | -100,00 | 0 | -100,00 | ||||
| 2026-02-03 | 13F/A | Bank Of America Corp /de/ | Call | 0 | -100,00 | 0 | -100,00 | |||
| 2026-01-15 | 13F | Founders Capital Management | 0 | -100,00 | 0 | |||||
| 2026-02-13 | 13F | Marathon Trading Investment Management LLC | 63.800 | -38,54 | 205 | -49,00 | ||||
| 2026-02-17 | 13F | Cetera Investment Advisers | 39.257 | 0,49 | 126 | -16,00 | ||||
| 2026-02-17 | 13F | SageView Advisory Group, LLC | 2 | 0 | ||||||
| 2026-02-27 | 13F/A | Barclays Plc | Put | 0 | -100,00 | 0 | -100,00 | |||
| 2026-02-06 | 13F | GPS Wealth Strategies Group, LLC | 0 | -100,00 | 0 | |||||
| 2026-02-13 | 13F | National Bank Of Canada /fi/ | 27.079 | -94,46 | 87 | -95,44 | ||||
| 2026-02-10 | 13F | Goldman Sachs Group Inc | 573.296 | 149,42 | 1.840 | 107,44 | ||||
| 2026-02-17 | 13F | Sherbrooke Park Advisers Llc | 0 | -100,00 | 0 | |||||
| 2026-02-17 | 13F | National Asset Management, Inc. | 10.206 | 33 | ||||||
| 2026-03-26 | 13F/A | Peak6 Llc | 0 | -100,00 | 0 | -100,00 | ||||
| 2026-02-12 | 13F | Moneta Group Investment Advisors Llc | 15.032 | 48 | ||||||
| 2026-01-05 | 13F | GoalVest Advisory LLC | 220 | 0,00 | 1 | |||||
| 2026-01-21 | 13F | Flagship Harbor Advisors, Llc | 31 | 0 | ||||||
| 2026-02-17 | 13F | Susquehanna International Group, Llp | Put | 2.461.300 | 86,42 | 7.901 | 55,02 | |||
| 2026-02-17 | 13F | Susquehanna International Group, Llp | Call | 1.761.600 | -4,42 | 5.655 | -20,52 | |||
| 2026-02-17 | 13F/A | Intesa Sanpaolo S.p.a. | 1.671 | 6 | ||||||
| 2026-02-17 | 13F | Susquehanna International Group, Llp | 772.345 | 713,93 | 2.479 | 577,32 | ||||
| 2026-01-29 | 13F | Concord Wealth Partners | 160 | 1 | ||||||
| 2025-11-10 | 13F | Axq Capital, Lp | 0 | -100,00 | 0 | -100,00 | ||||
| 2026-02-17 | 13F | Royal Bank Of Canada | 1.792 | -49,97 | 6 | -57,14 | ||||
| 2026-01-30 | 13F | Us Bancorp \de\ | 1 | 0 | ||||||
| 2025-11-14 | 13F | Hrt Financial Lp | 0 | -100,00 | 0 | |||||
| 2026-02-13 | 13F | Pinnacle Wealth Planning Services, Inc. | 2.247 | 7 | ||||||
| 2026-01-28 | 13F | Davis Capital Management | 5 | 0,00 | 0 | |||||
| 2026-02-11 | 13F | Hilton Head Capital Partners, LLC | 50 | 0 | ||||||
| 2026-02-13 | 13F | American Century Companies Inc | 51.580 | 68,62 | 166 | 39,83 | ||||
| 2026-02-11 | 13F | Mirae Asset Securities (usa) Inc. | 0 | -100,00 | 0 | -100,00 | ||||
| 2026-02-11 | 13F | Mirae Asset Securities (usa) Inc. | Put | 0 | -100,00 | 0 | -100,00 | |||
| 2026-02-17 | 13F | Fmr Llc | 26.753 | 56,64 | 86 | 30,77 | ||||
| 2025-11-03 | 13F | Hollencrest Capital Management | Call | 0 | -100,00 | 0 | -100,00 | |||
| 2025-11-13 | 13F | Limestone Investment Advisors LP | 1.288 | 9,15 | ||||||
| 2025-11-14 | 13F | Toronto Dominion Bank | 0 | -100,00 | 0 | -100,00 | ||||
| 2026-02-17 | 13F | Millennium Management Llc | 479.789 | 118,89 | 1.540 | 82,03 | ||||
| 2026-02-17 | 13F | Two Sigma Securities, Llc | 16.519 | -58,93 | 53 | -65,81 | ||||
| 2025-10-28 | 13F | Eq Wealth Advisors, Llc | 0 | -100,00 | 0 | |||||
| 2026-02-17 | 13F/A | RBF Capital, LLC | 131.664 | 423 | ||||||
| 2026-01-12 | 13F | Abound Wealth Management | 2 | -50,00 | 0 | |||||
| 2026-02-17 | 13F | Advisory Services Network, LLC | 0 | -100,00 | 0 | |||||
| 2026-01-27 | 13F | TD Waterhouse Canada Inc. | 17 | 54,55 | 0 | |||||
| 2026-02-12 | 13F | Wealthspire Advisors, LLC | 0 | -100,00 | 0 | |||||
| 2026-02-13 | 13F | Centiva Capital, LP | 0 | -100,00 | 0 | -100,00 | ||||
| 2026-02-17 | 13F | Price T Rowe Associates Inc /md/ | 28.140 | 0,00 | 0 | |||||
| 2025-10-21 | 13F | True Wealth Design, LLC | 0 | -100,00 | 0 | |||||
| 2026-02-10 | 13F | Murphy & Mullick Capital Management Corp | 15 | 0,00 | 0 | |||||
| 2026-02-06 | 13F | Larson Financial Group LLC | 125 | 0,00 | 0 | |||||
| 2026-02-19 | 13F | Invesco Ltd. | 406.294 | 52,88 | 1.304 | 27,22 | ||||
| 2026-02-03 | 13F | SBI Securities Co., Ltd. | 29.844 | -28,07 | 96 | -40,62 | ||||
| 2026-02-11 | 13F | MCF Advisors LLC | 35 | 0 | ||||||
| 2026-02-13 | 13F | Barclays Plc | 69.229 | 156,46 | 222 | 35,37 | ||||
| 2026-02-13 | 13F | Barclays Plc | Call | 14.100 | 0,71 | 45 | -16,67 | |||
| 2026-02-13 | 13F | Truvestments Capital Llc | 5 | 0,00 | 0 | |||||
| 2026-02-17 | 13F | Bridgeway Capital Management Inc | 45.000 | 0,00 | 144 | -16,76 | ||||
| 2026-01-22 | 13F/A | Cresset Asset Management, LLC | 0 | -100,00 | 0 | -100,00 | ||||
| 2025-11-14 | 13F | Jain Global LLC | 0 | -100,00 | 0 | -100,00 | ||||
| 2025-11-12 | 13F | Pitcairn Co | 0 | -100,00 | 0 | -100,00 | ||||
| 2025-11-13 | 13F | Advent Capital Management /de/ | Call | 0 | -100,00 | 0 | ||||
| 2026-02-13 | 13F | SRS Capital Advisors, Inc. | 34 | 240,00 | 0 | |||||
| 2026-01-23 | 13F | Westside Investment Management, Inc. | 3.000 | 0,00 | 10 | -18,18 | ||||
| 2026-02-12 | 13F | Jane Street Group, Llc | Call | 424.120 | -2,37 | 1.361 | -18,79 | |||
| 2026-02-12 | 13F | Jane Street Group, Llc | 871.696 | 208,01 | 2.798 | 156,23 | ||||
| 2026-02-02 | 13F | Wolverine Asset Management Llc | Call | 100 | 0,00 | 0 | ||||
| 2026-02-12 | 13F | Jane Street Group, Llc | Put | 368.705 | 108,07 | 1.184 | 73,21 | |||
| 2026-02-10 | 13F | Root Financial Partners, LLC | 6 | 20,00 | 0 | |||||
| 2026-02-04 | 13F | Abc Arbitrage Sa | 113.035 | 91,03 | 363 | 58,77 | ||||
| 2026-01-26 | 13F | Cwm, Llc | 50 | 150,00 | 0 | |||||
| 2026-02-10 | 13F | Measured Wealth Private Client Group, LLC | 132.342 | 32,33 | 425 | 9,84 | ||||
| 2026-01-30 | 13F | North Star Investment Management Corp. | 102 | 0,00 | 0 | |||||
| 2026-02-13 | 13F | Verition Fund Management LLC | 0 | -100,00 | 0 | |||||
| 2026-02-17 | 13F | Point72 Asset Management, L.P. | Put | 20.000 | 0,00 | 64 | -16,88 | |||
| 2026-02-17 | 13F | Point72 Asset Management, L.P. | 609.312 | 1.956 | ||||||
| 2026-02-17 | 13F | Point72 Asset Management, L.P. | Call | 77.000 | 247 | |||||
| 2026-02-17 | 13F | Advisor Group Holdings, Inc. | 142.644 | 17,43 | 458 | 20,90 | ||||
| 2026-02-17 | 13F | PharVision Advisers, LLC | 0 | -100,00 | 0 | |||||
| 2026-02-12 | 13F | Federated Hermes, Inc. | 176.240 | 37.003,16 | 566 | 56.400,00 | ||||
| 2026-02-11 | 13F | Jpmorgan Chase & Co | 153.420 | 47.843,75 | 492 | 49.100,00 | ||||
| 2026-01-05 | 13F | Union Bancaire Privee, UBP SA | 616 | 0,00 | 2 | 0,00 | ||||
| 2026-02-17 | 13F | Jump Financial, LLC | 21.047 | 68 | ||||||
| 2026-02-17 | 13F | Crawford Fund Management, LLC | Put | 108.000 | 101,87 | 347 | 67,96 | |||
| 2026-02-06 | 13F | Pnc Financial Services Group, Inc. | 2.325 | 0,00 | 7 | -12,50 | ||||
| 2026-02-13 | 13F | Virtus ETF Advisers LLC | 0 | -100,00 | 0 | -100,00 | ||||
| 2026-02-12 | 13F | Steward Partners Investment Advisory, Llc | 25.171 | -0,98 | 81 | -18,37 | ||||
| 2026-02-06 | 13F | IFP Advisors, Inc | 450 | -1,53 | 1 | 0,00 | ||||
| 2026-01-22 | 13F | Apollon Wealth Management, LLC | 0 | -100,00 | 0 | -100,00 | ||||
| 2026-02-12 | 13F | Skopos Labs, Inc. | 16.615 | -16,75 | 52 | -32,47 | ||||
| 2026-02-10 | 13F | Bnp Paribas | 9.710 | 0,00 | 32 | -5,88 | ||||
| 2026-02-10 | 13F | Evolution Wealth Management Inc. | 94 | 0,00 | 0 | |||||
| 2026-02-13 | 13F | OMERS ADMINISTRATION Corp | 114.800 | 369 | ||||||
| 2026-01-15 | 13F | Fortitude Family Office, LLC | 140 | 0 | ||||||
| 2026-02-17 | 13F | Qube Research & Technologies Ltd | 0 | -100,00 | 0 | |||||
| 2026-02-17 | 13F | Two Sigma Investments, Lp | 0 | -100,00 | 0 | |||||
| 2026-02-17 | 13F | Russell Investments Group, Ltd. | 7.794 | -39,62 | 25 | -48,98 | ||||
| 2026-01-28 | 13F | Financial Perspectives, Inc | 4 | 0,00 | 0 | |||||
| 2026-02-12 | 13F | BRYN MAWR TRUST Co | 60 | 0,00 | 0 | |||||
| 2026-02-03 | 13F | International Assets Investment Management, Llc | 118 | 0 | ||||||
| 2026-02-13 | 13F | Squarepoint Ops LLC | 0 | -100,00 | 0 | -100,00 | ||||
| 2026-02-02 | 13F | Fifth Third Bancorp | 22 | 57,14 | 0 | |||||
| 2026-02-17 | 13F | Citadel Advisors Llc | 92.114 | 159,17 | 296 | 115,33 | ||||
| 2026-02-17 | 13F | Lighthouse Investment Partners, LLC | 35.520 | 114 | ||||||
| 2026-02-23 | 13F | Virtu Financial LLC | 40.252 | 0 | ||||||
| 2026-03-04 | 13F | SHP Wealth Management | 28 | 0 | ||||||
| 2026-01-29 | 13F | Financial Life Planners | 0 | -100,00 | 0 | |||||
| 2026-02-05 | 13F | Baader Bank INC | 0 | -100,00 | 0 | -100,00 | ||||
| 2026-02-17 | 13F | Cape Investment Advisory, Inc. | 2.325 | 7 | ||||||
| 2026-02-17 | 13F | Balyasny Asset Management Llc | Put | 19.800 | -98,87 | 64 | -99,07 | |||
| 2026-02-17 | 13F | Balyasny Asset Management Llc | 42.475 | 183,17 | 136 | 138,60 | ||||
| 2026-01-28 | 13F | Nvest Wealth Strategies, Inc. | 25 | 0 | ||||||
| 2026-02-09 | 13F | Geode Capital Management, Llc | 727.021 | 22,48 | 2.335 | 1,88 | ||||
| 2026-02-17 | 13F | Balyasny Asset Management Llc | Call | 250.000 | 802 | |||||
| 2026-02-04 | 13F | Summit Wealth Group Llc / Co | 0 | -100,00 | 0 | -100,00 | ||||
| 2026-02-13 | 13F | K2 Principal Fund, L.p. | Put | 200.000 | 642 | |||||
| 2026-02-02 | 13F | Sachetta, LLC | 2 | 0 | ||||||
| 2026-02-17 | 13F | Citadel Advisors Llc | Put | 492.520 | -1,45 | 1.581 | -18,09 | |||
| 2025-11-14 | 13F | Engineers Gate Manager LP | 0 | -100,00 | 0 | |||||
| 2026-02-17 | 13F | Citadel Advisors Llc | Call | 940.630 | -22,24 | 3.019 | -35,34 | |||
| 2025-11-14 | 13F | Ionic Capital Management LLC | 0 | -100,00 | 0 | |||||
| 2026-02-17 | 13F | Ancora Advisors, LLC | 150 | 0,00 | 0 | |||||
| 2026-02-10 | 13F | Bnp Paribas Arbitrage, Sa | Call | 1.000 | 321 | |||||
| 2026-02-12 | 13F | BlackRock, Inc. | 1.145.351 | 83,47 | 3.677 | 52,59 | ||||
| 2026-02-06 | 13F | Cullen/frost Bankers, Inc. | 50 | 0,00 | 0 | |||||
| 2026-01-13 | 13F | CoreCap Advisors, LLC | 556 | 2 | ||||||
| 2026-02-13 | 13F | Citigroup Inc | 44.309 | 61,08 | 142 | 33,96 | ||||
| 2026-01-14 | 13F | Thompson Investment Management, Inc. | 8 | 0,00 | 0 | |||||
| 2026-02-17 | 13F | 683 Capital Management, LLC | 280.160 | 899 | ||||||
| 2026-02-17 | 13F | XTX Topco Ltd | 26.090 | -75,25 | 84 | -79,56 | ||||
| 2026-04-06 | 13F | Washington Trust Advisors, Inc. | 5 | 0,00 | 0 | |||||
| 2026-02-10 | 13F | Bnp Paribas Arbitrage, Sa | 1.674 | -87,70 | 5 | -90,38 | ||||
| 2025-10-14 | 13F | Clarius Group, LLC | 0 | -100,00 | 0 | -100,00 | ||||
| 2026-02-13 | 13F | Wells Fargo & Company/mn | 620 | -31,49 | 2 | -66,67 | ||||
| 2026-02-17 | 13F | Tower Research Capital LLC (TRC) | 0 | -100,00 | 0 | |||||
| 2025-11-13 | 13F | Total Investment Management Inc | 0 | -100,00 | 0 | |||||
| 2025-11-10 | 13F | Raiffeisen Bank International AG | 0 | -100,00 | 0 | |||||
| 2026-01-21 | 13F | Newbridge Financial Services Group, Inc. | 5.950 | 0,00 | 19 | -13,64 | ||||
| 2026-03-03 | 13F/A | Caitong International Asset Management Co., Ltd | 10.646 | 34 | ||||||
| 2025-11-14 | 13F | Walleye Trading LLC | 0 | -100,00 | 0 | -100,00 | ||||
| 2026-02-02 | 13F | Cornerstone Planning Group LLC | 31 | -69,90 | 0 | -100,00 | ||||
| 2026-02-11 | 13F | Deutsche Bank Ag\ | 1.109 | 0,00 | 4 | -25,00 | ||||
| 2026-01-30 | 13F | Archer Investment Corp | 1 | 0,00 | 0 | |||||
| 2026-01-08 | 13F | Grove Bank & Trust | 17 | 0,00 | 0 | |||||
| 2026-01-29 | 13F | UBS Group AG | Call | 332.333 | 0,00 | 1.067 | -16,85 | |||
| 2026-01-29 | 13F | UBS Group AG | 791.933 | 103,50 | 2.542 | 69,24 | ||||
| 2026-01-15 | 13F | Nisa Investment Advisors, Llc | 113 | 0,00 | 0 | |||||
| 2026-02-13 | 13F | Hurley Capital, LLC | 1.222 | 4 | ||||||
| 2026-02-17 | 13F | Ursa Fund Management, LLC | 0 | -100,00 | 0 | -100,00 | ||||
| 2026-02-04 | 13F | Atlantic Union Bankshares Corp | 5 | 0,00 | 0 | |||||
| 2026-04-02 | 13F | Aspect Partners, LLC | 1 | 0,00 | 0 | |||||
| 2026-02-10 | 13F | Daiwa Securities Group Inc. | Put | 13.400 | 0 | |||||
| 2026-02-12 | 13F | Groupe la Francaise | 0 | -100,00 | 0 | |||||
| 2026-02-06 | 13F | Global Retirement Partners, LLC | Call | 0 | -100,00 | 0 | ||||
| 2026-02-10 | 13F | Daiwa Securities Group Inc. | 13.400 | 0 | ||||||
| 2025-11-12 | 13F | CIBC Bancorp USA Inc. | 16.164 | 62 | ||||||
| 2026-02-11 | 13F | LPL Financial LLC | 28.112 | -8,58 | 90 | -23,73 | ||||
| 2026-02-13 | 13F | State Street Corp | 285.833 | 0,50 | 918 | -16,41 | ||||
| 2026-02-12 | 13F | CIBC Private Wealth Group, LLC | 16.161 | 0,00 | 52 | -17,74 | ||||
| 2026-01-12 | 13F | AllSquare Wealth Management LLC | 2 | 0,00 | 0 | |||||
| 2026-01-20 | 13F | Signaturefd, Llc | 40 | 0,00 | 0 | |||||
| 2026-03-04 | 13F | AG Campbell Advisory, LLC | 5 | 0 | ||||||
| 2026-01-08 | 13F | Chesapeake Asset Management Llc | 5 | 0,00 | 0 | |||||
| 2026-01-29 | 13F | Comerica Bank | 165 | 0,00 | 1 | |||||
| 2025-11-14 | 13F | Raymond James Financial Inc | 0 | -100,00 | 0 | |||||
| 2026-02-06 | 13F | EverSource Wealth Advisors, LLC | 268 | 0,00 | 1 | -100,00 | ||||
| 2026-02-13 | 13F | Graney & King, LLC | 22 | 0,00 | 0 | |||||
| 2026-02-13 | 13F | Charles Schwab Investment Management Inc | 406.715 | 40,45 | 1.306 | 16,83 | ||||
| 2026-01-29 | 13F | Vanguard Group Inc | 2.965.168 | 26,61 | 9.518 | 5,29 | ||||
| 2026-02-17 | 13F | Schonfeld Strategic Advisors LLC | 24.407 | 78 | ||||||
| 2025-10-31 | 13F | National Asset Management, Inc. | Call | 0 | -100,00 | 0 | -100,00 | |||
| 2026-01-14 | 13F | Wolff Wiese Magana Llc | 1 | 0,00 | 0 | |||||
| 2026-02-10 | 13F | Belvedere Trading LLC | Put | 0 | -100,00 | 0 | ||||
| 2026-02-10 | 13F | Belvedere Trading LLC | Call | 0 | -100,00 | 0 | ||||
| 2026-02-17 | 13F | Private Advisor Group, LLC | 17.835 | 6,56 | 57 | -10,94 | ||||
| 2026-02-17 | 13F/A | Cantor Fitzgerald, L. P. | 0 | -100,00 | 0 | -100,00 | ||||
| 2026-01-29 | 13F | Sanctuary Advisors, LLC | 10.812 | -21,46 | 35 | -35,85 | ||||
| 2026-02-11 | 13F | Parallel Advisors, LLC | 79 | -2,47 | 0 | |||||
| 2026-02-13 | 13F | Walleye Trading LLC | Put | 286.400 | 2,62 | 919 | -14,67 | |||
| 2026-02-06 | 13F | Leonteq Securities AG | 3.684 | -7,32 | 12 | -26,67 | ||||
| 2026-02-17 | 13F | Graham Capital Management, L.P. | Put | 234.700 | -83,22 | 753 | -86,05 | |||
| 2026-02-17 | 13F | Toronto Dominion Bank | Call | 22.100 | 0,00 | 71 | -17,65 | |||
| 2026-02-09 | 13F | Harbour Investments, Inc. | 1.267 | 17,10 | 4 | 0,00 | ||||
| 2025-11-12 | 13F | Accredited Wealth Management, LLC | 824 | 2.254,29 | 0 | |||||
| 2026-02-13 | 13F | MAI Capital Management | 17 | 0,00 | 0 | |||||
| 2026-02-12 | 13F | Penserra Capital Management LLC | 198.510 | 48,74 | 1 | |||||
| 2026-02-12 | 13F | Federation des caisses Desjardins du Quebec | 75 | 0,00 | 0 | |||||
| 2025-11-14 | 13F | Wolverine Trading, Llc | 24.298 | 35,06 | 85 | 66,67 | ||||
| 2025-11-14 | 13F | Wolverine Trading, Llc | Call | 359.800 | 34,71 | 1.263 | 65,40 | |||
| 2025-11-14 | 13F | Wolverine Trading, Llc | Put | 166.300 | 19,73 | 584 | 46,85 | |||
| 2026-02-12 | 13F | Hollencrest Capital Management | 1.000 | 0,00 | 3 | 0,00 | ||||
| 2026-02-13 | 13F | Hudson Bay Capital Management LP | 90.633 | 291 | ||||||
| 2025-11-14 | 13F | Peak6 Llc | Call | 0 | -100,00 | 0 | -100,00 | |||
| 2026-02-12 | 13F | Raiffeisen Bank International AG | Call | 55 | 0,00 | 0 | ||||
| 2026-02-10 | 13F/A | Northwestern Mutual Wealth Management Co | 373 | 6.116,67 | 1 | |||||
| 2026-01-07 | 13F | Central Pacific Bank - Trust Division | 6.906 | 22 | ||||||
| 2026-02-17 | 13F | Optiver Holding B.V. | 0 | -100,00 | 0 | |||||
| 2026-02-11 | 13F | Jessup Wealth Management, Inc | 50 | 0 | ||||||
| 2026-02-13 | 13F | Walleye Trading LLC | Call | 516.100 | 76,08 | 1.657 | 46,42 | |||
| 2026-04-06 | 13F | Versant Capital Management, Inc | 0 | -100,00 | 0 | |||||
| 2026-02-05 | 13F | Tucker Asset Management Llc | 187 | 1 | ||||||
| 2026-02-13 | 13F | Gmt Capital Corp | 0 | -100,00 | 0 | |||||
| 2026-02-17 | 13F | Susquehanna Portfolio Strategies, LLC | 262.862 | 0,00 | 844 | -16,86 | ||||
| 2026-04-06 | 13F | IFS Advisors, LLC | 22 | 0,00 | 0 | |||||
| 2026-01-30 | 13F | Activest Wealth Management | 1.500 | 0,00 | 5 | -20,00 | ||||
| 2026-02-10 | 13F | Foundations Investment Advisors, LLC | Call | 0 | -100,00 | 0 | ||||
| 2026-02-06 | 13F | Larson Financial Group LLC | Call | 0 | -100,00 | 0 | -100,00 | |||
| 2026-02-10 | 13F | Rothschild Investment Llc | 5 | 0,00 | 0 | |||||
| 2026-02-17 | 13F | Quadrature Capital Ltd | 139.702 | 130,48 | 448 | 92,27 | ||||
| 2026-02-13 | 13F | Squarepoint Ops LLC | Put | 88.800 | -22,17 | 285 | -35,23 | |||
| 2026-02-26 | 13F/A | Sculptor Capital LP | 0 | -100,00 | 0 | |||||
| 2026-02-11 | 13F | Vermillion Wealth Management, Inc. | 1 | 0,00 | 0 | |||||
| 2026-02-17 | 13F | Susquehanna Fundamental Investments, Llc | 32.497 | 0,00 | 104 | -16,80 | ||||
| 2026-02-18 | 13F | GWM Advisors LLC | 351 | 0,00 | 1 | 0,00 | ||||
| 2026-02-17 | 13F | Shaolin Capital Management LLC | Put | 132.000 | 424 | |||||
| 2026-02-09 | 13F | Huntington National Bank | 2 | 0,00 | 0 | |||||
| 2026-02-17 | 13F | Shaolin Capital Management LLC | 82.633 | 265 | ||||||
| 2026-02-17 | 13F | Jones Financial Companies Lllp | 494 | -58,80 | 2 | -75,00 |