Grundlæggende statistik
| Institutionelle aktier (lange) | 56.524.848 - 78,15% (ex 13D/G) - change of -13,12MM shares -18,84% MRQ |
| Institutionel værdi (lang) | $ 151.713 USD ($1000) |
Institutionelt ejerskab og aktionærer
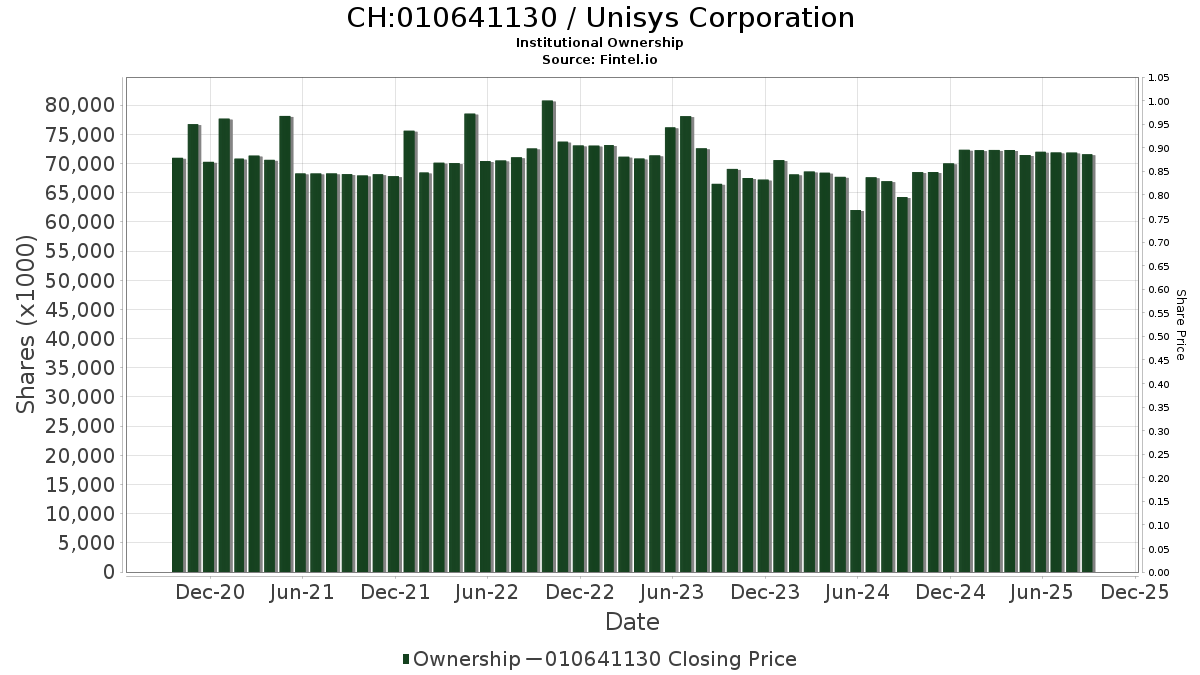
Unisys Corporation (CH:010641130) har 166 institutionelle ejere og aktionærer, der har indsendt 13D/G- eller 13F-formularer til Securities Exchange Commission (SEC). Disse institutioner har i alt 56,524,848 aktier. Største aktionærer omfatter Vanguard Group Inc, BlackRock, Inc., Needham Investment Management Llc, Neuberger Berman Group LLC, D. E. Shaw & Co., Inc., Millennium Management Llc, Charles Schwab Investment Management Inc, Geode Capital Management, Llc, Saba Capital Management, L.P., and State Street Corp .
Unisys Corporation (BRSE:010641130) institutionel ejerskabsstruktur viser aktuelle positioner i virksomheden efter institutioner og fonde, samt seneste ændringer i positionsstørrelse. Større aktionærer kan omfatte individuelle investorer, investeringsforeninger, hedgefonde eller institutioner. Skema 13D angiver, at investoren besidder (eller besidder) mere end 5 % af virksomheden og har til hensigt (eller har til hensigt at) aktivt at forfølge en ændring i forretningsstrategi. Skema 13G indikerer en passiv investering på over 5%.
Fondens stemningsscore
Fund Sentiment Score (fka Ownership Accumulation Score) finder de aktier, der bliver mest købt af fonde. Det er resultatet af en sofistikeret, multi-faktor kvantitativ model, der identificerer virksomheder med de højeste niveauer af institutionel akkumulering. Scoringsmodellen bruger en kombination af den samlede stigning i oplyste ejere, ændringerne i porteføljeallokeringer i disse ejere og andre målinger. Tallet går fra 0 til 100, hvor højere tal indikerer et højere niveau af akkumulering for sine jævnaldrende, og 50 er gennemsnittet.
Opdateringsfrekvens: Dagligt
Se Ownership Explorer, som giver en liste over højest rangerende virksomheder.
AI+ Ask Fintel’s AI assistant about Unisys Corporation.
Select a question to share a public post with an AI-crafted answer.
Thinking of good questions…
13F og NPORT arkivering
Detaljer om 13F-arkivering er gratis. Detaljer om NP-ansøgninger kræver et premium-medlemskab. Grønne rækker angiver nye positioner. Røde rækker angiver lukkede positioner. Klik på linket ikon for at se den fulde transaktionshistorik.
Opgrader
for at låse premium-data op og eksportere til Excel ![]() .
.
| Fil dato | Kilde | Investor | Type | Gennemsnitlig pris (Øst) |
Aktier | Δ Aktier (%) |
Rapporteret Værdi ($1000) |
Δ Værdi (%) |
Port Alloc (%) |
|
|---|---|---|---|---|---|---|---|---|---|---|
| 2025-11-14 | 13F | Whetstone Capital Advisors, LLC | 0 | -100,00 | 0 | |||||
| 2025-11-14 | 13F | Point72 Europe (London) LLP | 1.324 | 5 | ||||||
| 2026-04-15 | 13F | Merit Financial Group, LLC | 14.582 | 30 | ||||||
| 2025-11-13 | 13F | Hsbc Holdings Plc | 0 | -100,00 | 0 | -100,00 | ||||
| 2026-01-26 | 13F | Whittier Trust Co | 0 | -100,00 | 0 | |||||
| 2026-02-17 | 13F | Oxford Asset Management Llp | 33.554 | 10,72 | 93 | -22,03 | ||||
| 2025-11-14 | 13F | Point72 (DIFC) Ltd | 2.389 | 9 | ||||||
| 2026-02-12 | 13F | IES Holdings, Inc. | 1.171.938 | 3.235 | ||||||
| 2026-02-10 | 13F | Bank of New York Mellon Corp | 180.226 | -18,68 | 497 | -42,48 | ||||
| 2026-02-10 | 13F | Connor, Clark & Lunn Investment Management Ltd. | 144.295 | 79,25 | 398 | 27,16 | ||||
| 2026-04-22 | 13F | Sterling Capital Management LLC | 795 | -37,99 | 2 | -66,67 | ||||
| 2026-01-14 | 13F | Hennion & Walsh Asset Management, Inc. | 92.208 | -1,61 | 254 | -30,41 | ||||
| 2025-11-12 | 13F | Integrated Quantitative Investments LLC | 0 | -100,00 | 0 | -100,00 | ||||
| 2026-02-09 | 13F | Quest Partners LLC | 9.716 | 0,00 | 27 | -29,73 | ||||
| 2026-02-17 | 13F | Point72 Asset Management, L.P. | 75.455 | 208 | ||||||
| 2026-02-17 | 13F | Insight Wealth Partners, LLC | 32.859 | -10,85 | 91 | -37,06 | ||||
| 2026-02-17 | 13F | Atom Investors LP | 43.730 | 121 | ||||||
| 2026-02-03 | 13F | SBI Securities Co., Ltd. | 95 | 0,00 | 0 | |||||
| 2026-02-11 | 13F | Jpmorgan Chase & Co | 1.265.591 | -8,04 | 3.493 | -34,92 | ||||
| 2026-02-17 | 13F | Advisory Services Network, LLC | 0 | -100,00 | 0 | |||||
| 2026-02-10 | 13F | Axq Capital, Lp | 14.665 | 40 | ||||||
| 2026-02-03 | 13F | Costello Asset Management, INC | 50 | 0,00 | 0 | |||||
| 2026-02-17 | 13F | Quadrature Capital Ltd | 17.142 | -32,91 | 47 | -52,53 | ||||
| 2026-02-13 | 13F | Charles Schwab Investment Management Inc | 1.744.864 | 36,69 | 4.816 | -3,27 | ||||
| 2026-02-13 | 13F | Verition Fund Management LLC | 27.432 | -11,83 | 76 | -38,02 | ||||
| 2026-01-21 | 13F | Sound Income Strategies, LLC | 4.059 | 13 | ||||||
| 2026-02-11 | 13F | Deutsche Bank Ag\ | 49.829 | 6,84 | 138 | -24,31 | ||||
| 2026-02-13 | 13F | State Street Corp | 1.506.049 | -6,32 | 4.157 | -33,71 | ||||
| 2026-02-06 | 13F | ProShare Advisors LLC | 12.191 | 6,84 | 34 | -25,00 | ||||
| 2026-02-10 | 13F | Intech Investment Management Llc | 28.743 | -13,37 | 79 | -38,76 | ||||
| 2026-01-29 | 13F | Vanguard Group Inc | 7.063.422 | -0,60 | 19.495 | -29,66 | ||||
| 2026-01-30 | 13F | Torren Management, LLC | 1.860 | 5 | ||||||
| 2026-02-06 | 13F | EverSource Wealth Advisors, LLC | 1.098 | -33,17 | 3 | -50,00 | ||||
| 2026-02-02 | 13F | Principal Financial Group Inc | 239.461 | 48,68 | 661 | 5,10 | ||||
| 2026-01-23 | 13F | Avion Wealth | 187 | 0 | ||||||
| 2025-11-07 | 13F | Pallas Capital Advisors LLC | 0 | -100,00 | 0 | |||||
| 2026-04-15 | 13F | FNY Investment Advisers, LLC | 0 | -100,00 | 0 | |||||
| 2026-02-12 | 13F | Ironwood Investment Management Llc | 55.563 | 0,00 | 153 | -29,17 | ||||
| 2026-02-12 | 13F | Federation des caisses Desjardins du Quebec | 112 | 0,00 | 0 | |||||
| 2026-04-24 | 13F | Midwest Capital Advisors, LLC | 17 | 0 | ||||||
| 2026-02-17 | 13F | Engineers Gate Manager LP | 16.143 | -27,02 | 45 | -48,84 | ||||
| 2026-02-13 | 13F | Citigroup Inc | 3.745 | 36,08 | 10 | 0,00 | ||||
| 2026-01-20 | 13F | Harbor Capital Advisors, Inc. | 1.601 | -1,66 | 0 | |||||
| 2026-02-10 | 13F | Bnp Paribas Arbitrage, Sa | 13.991 | -12,76 | 39 | -38,71 | ||||
| 2026-02-17 | 13F | Susquehanna International Group, Llp | Call | 54.800 | -46,90 | 151 | -62,44 | |||
| 2026-02-17 | 13F | Susquehanna International Group, Llp | 44.430 | -61,50 | 123 | -72,89 | ||||
| 2026-02-17 | 13F | Susquehanna International Group, Llp | Put | 23.900 | -84,11 | 66 | -88,91 | |||
| 2026-04-23 | 13F | SJS Investment Consulting Inc. | 24 | 0 | ||||||
| 2026-02-13 | 13F | MAI Capital Management | 10 | 0 | ||||||
| 2025-11-05 | 13F | Cullen Capital Management, LLC | 0 | -100,00 | 0 | |||||
| 2026-04-24 | 13F | Root Financial Partners, LLC | 324 | 1 | ||||||
| 2026-04-24 | 13F | Strs Ohio | 116.600 | 0,00 | 241 | -24,92 | ||||
| 2026-02-12 | 13F | BlackRock, Inc. | 5.252.472 | -3,37 | 14.497 | -31,62 | ||||
| 2026-02-11 | 13F | Group One Trading, L.p. | Put | 0 | -100,00 | 0 | -100,00 | |||
| 2026-04-13 | 13F | True Wealth Design, LLC | 57 | 850,00 | 0 | |||||
| 2026-02-17 | 13F | Advisor Group Holdings, Inc. | 969 | 94,97 | 3 | 100,00 | ||||
| 2026-02-17 | 13F | Warren Averett Asset Management, LLC | 10.273 | 2.345,95 | 28 | 133,33 | ||||
| 2026-02-12 | 13F | Voya Investment Management Llc | 13.181 | -73,65 | 36 | -81,54 | ||||
| 2026-02-11 | 13F | Cerity Partners LLC | 16.964 | 47 | ||||||
| 2026-02-13 | 13F | Needham Investment Management Llc | 4.812.200 | -5,46 | 13.282 | -33,10 | ||||
| 2025-11-14 | 13F | Cubist Systematic Strategies, LLC | 21.475 | 84 | ||||||
| 2026-02-12 | 13F | SWAN Capital LLC | 11.000 | 16,85 | 30 | -16,67 | ||||
| 2026-04-21 | 13F | PharVision Advisers, LLC | 0 | -100,00 | 0 | |||||
| 2026-02-13 | 13F | Walleye Capital LLC | Call | 600 | -98,52 | 2 | -99,36 | |||
| 2026-02-17 | 13F | Lazard Asset Management Llc | 139.985 | -52,61 | 386 | -66,49 | ||||
| 2026-02-13 | 13F/A | Virtus ETF Advisers LLC | 0 | -100,00 | 0 | |||||
| 2026-02-13 | 13F | Walleye Capital LLC | 12.087 | 74,31 | 33 | 22,22 | ||||
| 2026-02-11 | 13F | LPL Financial LLC | 13.899 | -73,82 | 38 | -81,64 | ||||
| 2026-03-24 | 13F/A | Barclays Plc | Put | 0 | -100,00 | 0 | -100,00 | |||
| 2026-02-10 | 13F | Acadian Asset Management Llc | 1.205.519 | -25,74 | 3 | -50,00 | ||||
| 2026-02-13 | 13F | Squarepoint Ops LLC | 48.526 | -49,28 | 134 | -64,34 | ||||
| 2026-02-06 | 13F | Newport Trust Co | 1.354.788 | 12,79 | 3.739 | -20,18 | ||||
| 2026-02-06 | 13F | Global Retirement Partners, LLC | 7.050 | 728,44 | 19 | 533,33 | ||||
| 2026-02-13 | 13F | Wells Fargo & Company/mn | 89.070 | 36,85 | 246 | -3,16 | ||||
| 2026-02-12 | 13F | Jane Street Group, Llc | 152.137 | -34,01 | 420 | -53,39 | ||||
| 2026-02-13 | 13F | Caitong International Asset Management Co., Ltd | 16.861 | 47 | ||||||
| 2026-02-13 | 13F | Ieq Capital, Llc | 17.035 | -68,89 | 47 | -77,93 | ||||
| 2026-02-10 | 13F | Calton & Associates, Inc. | 14.750 | 0,00 | 41 | -29,82 | ||||
| 2025-10-31 | 13F | Cullen/frost Bankers, Inc. | 0 | -100,00 | 0 | |||||
| 2026-02-13 | 13F | Jacobs Levy Equity Management, Inc | 1.011.296 | 1,19 | 2.791 | -28,38 | ||||
| 2026-02-17 | 13F | Ameriprise Financial Inc | 250.223 | -46,53 | 691 | -62,19 | ||||
| 2026-02-13 | 13F | Brown Advisory Inc | 49.798 | -2,27 | 137 | -30,81 | ||||
| 2026-02-13 | 13F | Morgan Stanley | 579.156 | -19,86 | 1.598 | -43,29 | ||||
| 2026-01-29 | 13F | Comerica Bank | 1.444 | 30,09 | 4 | -25,00 | ||||
| 2026-02-11 | 13F | Parallel Advisors, LLC | 193.427 | -23,68 | 534 | -46,05 | ||||
| 2026-02-12 | 13F | State Board Of Administration Of Florida Retirement System | 26.566 | 0,00 | 73 | -29,13 | ||||
| 2026-04-06 | 13F | GAMMA Investing LLC | 1.028 | -59,73 | 2 | -71,43 | ||||
| 2026-01-26 | 13F | Cwm, Llc | 9.987 | -54,93 | 0 | |||||
| 2026-02-17 | 13F | Jones Financial Companies Lllp | 589 | 2 | ||||||
| 2026-02-11 | 13F | Potomac Capital Management, Inc. | 95.770 | 59,62 | 264 | -21,66 | ||||
| 2026-02-12 | 13F | MetLife Investment Management, LLC | 12.457 | -67,44 | 34 | -77,18 | ||||
| 2026-01-12 | 13F | Byrne Asset Management LLC | 0 | -100,00 | 0 | |||||
| 2026-02-12 | 13F | Renaissance Technologies Llc | 1.323.233 | -3,10 | 3.652 | -31,42 | ||||
| 2025-11-03 | 13F | Kapitalo Investimentos Ltda | 0 | -100,00 | 0 | |||||
| 2026-02-17 | 13F | California State Teachers Retirement System | 4.106 | -13,99 | 11 | -38,89 | ||||
| 2026-02-09 | 13F | Huntington National Bank | 0 | |||||||
| 2026-02-17 | 13F | Brevan Howard Capital Management LP | 0 | -100,00 | 0 | |||||
| 2026-02-12 | 13F | Bank Of Montreal /can/ | 32.858 | -2,41 | 91 | -31,30 | ||||
| 2026-02-13 | 13F | Rhumbline Advisers | 88.498 | -9,57 | 244 | -35,96 | ||||
| 2026-04-07 | 13F | Farther Finance Advisors, LLC | 211 | 0 | ||||||
| 2026-02-12 | 13F | Nuveen, LLC | 131.260 | 0,00 | 362 | -29,16 | ||||
| 2026-04-16 | 13F | Diversified Trust Co | 29.583 | 38,80 | 61 | 5,17 | ||||
| 2026-01-08 | 13F | Versant Capital Management, Inc | 0 | -100,00 | 0 | |||||
| 2026-02-13 | 13F | Quarry LP | 10.205 | 445,72 | 28 | 300,00 | ||||
| 2026-02-12 | 13F | Dimensional Fund Advisors Lp | 1.068.349 | -11,10 | 2.949 | -37,09 | ||||
| 2026-02-17 | 13F | Sherbrooke Park Advisers Llc | 0 | -100,00 | 0 | |||||
| 2026-02-17 | 13F | Boothbay Fund Management, Llc | 32.073 | 2,36 | 89 | -27,87 | ||||
| 2025-11-14 | 13F | Hughes Financial Services, LLC | 0 | -100,00 | 0 | |||||
| 2026-02-17 | 13F | Two Sigma Advisers, Lp | 0 | -100,00 | 0 | |||||
| 2026-02-17 | 13F | Price T Rowe Associates Inc /md/ | 57.187 | 0,00 | 0 | |||||
| 2026-04-08 | 13F | Wealth Enhancement Advisory Services, Llc | 23.999 | 49 | ||||||
| 2026-02-13 | 13F | Transamerica Financial Advisors, Inc. | 22 | 0 | ||||||
| 2026-02-17 | 13F | Northern Trust Corp | 490.514 | -10,88 | 1.354 | -36,95 | ||||
| 2026-02-17 | 13F | D. E. Shaw & Co., Inc. | 3.490.445 | 13,17 | 9.634 | -19,91 | ||||
| 2026-02-13 | 13F | Martingale Asset Management L P | 0 | -100,00 | 0 | |||||
| 2026-02-10 | 13F | Private Wealth Asset Management, LLC | 0 | -100,00 | 0 | |||||
| 2026-02-09 | 13F | Minerva Advisors LLC | 345.347 | 0,00 | 953 | -29,20 | ||||
| 2026-04-24 | 13F | Key FInancial Inc | 100 | 0,00 | 0 | |||||
| 2026-01-29 | 13F | UBS Group AG | 201.067 | 0,34 | 555 | -29,07 | ||||
| 2026-02-12 | 13F | Marex Group plc | 0 | -100,00 | 0 | |||||
| 2026-02-13 | 13F | Police & Firemen's Retirement System of New Jersey | 21.433 | 0,00 | 59 | -28,92 | ||||
| 2026-02-10 | 13F/A | Northwestern Mutual Wealth Management Co | 10.093 | 0,83 | 28 | -30,77 | ||||
| 2026-02-17 | 13F | Bridgeway Capital Management Inc | 102.500 | 0,00 | 283 | -29,32 | ||||
| 2026-02-18 | 13F | Mackenzie Financial Corp | 47.956 | -16,85 | 133 | -40,62 | ||||
| 2026-02-12 | 13F | New York State Common Retirement Fund | 624.461 | 0,00 | 1.724 | -29,24 | ||||
| 2026-02-17 | 13F | ExodusPoint Capital Management, LP | 0 | -100,00 | 0 | -100,00 | ||||
| 2026-02-17 | 13F | Alliancebernstein L.p. | 109.554 | 6,83 | 302 | -24,31 | ||||
| 2026-02-13 | 13F | Centiva Capital, LP | 21.371 | 59 | ||||||
| 2026-02-12 | 13F | Pinnacle Holdings, LLC | 175.094 | 7,26 | 483 | -24,06 | ||||
| 2025-11-13 | 13F | Franklin Resources Inc | 0 | -100,00 | 0 | -100,00 | ||||
| 2026-02-17 | 13F | Royal Bank Of Canada | 2.390 | 312,07 | 7 | 250,00 | ||||
| 2026-02-10 | 13F | Envestnet Asset Management Inc | 0 | -100,00 | 0 | |||||
| 2026-02-17 | 13F | Saba Capital Management, L.P. | 1.551.487 | 65,78 | 4.282 | 17,35 | ||||
| 2026-02-17 | 13F | Glenmede Trust Co Na | 19.543 | 25,21 | 54 | -25,35 | ||||
| 2026-04-07 | 13F | CoreCap Advisors, LLC | 70 | 0,00 | 0 | |||||
| 2026-04-20 | 13F | Kestra Private Wealth Services, Llc | 20.605 | 5,10 | 43 | -22,22 | ||||
| 2025-12-08 | 13F/A | Evelyn Partners Investment Management Services Ltd | 0 | -100,00 | 0 | |||||
| 2026-02-17 | 13F | Citadel Advisors Llc | Call | 0 | -100,00 | 0 | ||||
| 2025-10-29 | 13F | Massachusetts Financial Services Co /ma/ | 0 | -100,00 | 0 | |||||
| 2026-01-27 | 13F | TD Waterhouse Canada Inc. | 414 | 0,00 | 1 | 0,00 | ||||
| 2025-11-13 | 13F | Arrowstreet Capital, Limited Partnership | 0 | -100,00 | 0 | -100,00 | ||||
| 2026-02-12 | 13F | EntryPoint Capital, LLC | 0 | -100,00 | 0 | |||||
| 2026-02-10 | 13F | Rothschild Investment Llc | 19 | -93,04 | 0 | -100,00 | ||||
| 2026-02-13 | 13F | Walleye Capital LLC | Put | 0 | -100,00 | 0 | -100,00 | |||
| 2026-02-05 | 13F | Amalgamated Bank | 2.096 | -7,79 | 0 | |||||
| 2026-02-11 | 13F | Simplex Trading, Llc | Put | 2.400 | -94,23 | 7 | ||||
| 2026-02-11 | 13F | Simplex Trading, Llc | Call | 2.700 | -93,06 | 7 | ||||
| 2026-02-17 | 13F | Jump Financial, LLC | 91.816 | 253 | ||||||
| 2026-02-17 | 13F | Citadel Advisors Llc | Put | 58.700 | -46,10 | 162 | -61,79 | |||
| 2025-11-13 | 13F | Winton Capital Group Ltd | 0 | -100,00 | 0 | |||||
| 2026-02-17 | 13F | Optiver Holding B.V. | 0 | -100,00 | 0 | |||||
| 2026-02-17 | 13F | Citadel Advisors Llc | 446.270 | 10,68 | 1.232 | -21,69 | ||||
| 2026-02-17 | 13F | Man Group plc | 62.838 | 3,04 | 173 | -27,00 | ||||
| 2026-02-02 | 13F | Wolverine Asset Management Llc | Call | 101.100 | 0,60 | 279 | -28,64 | |||
| 2026-01-30 | 13F | Us Bancorp \de\ | 657 | 0,00 | 2 | -50,00 | ||||
| 2026-02-09 | 13F | Legal & General Group Plc | 6.780 | -5,25 | 19 | -33,33 | ||||
| 2026-02-05 | 13F | Allworth Financial LP | 213 | -54,39 | 1 | -100,00 | ||||
| 2026-02-12 | 13F | Federated Hermes, Inc. | 1.494.555 | 29,08 | 4.125 | -8,66 | ||||
| 2026-02-06 | 13F | Gsa Capital Partners Llp | 200.445 | -14,58 | 1 | |||||
| 2026-02-09 | 13F | Hartland & Co., LLC | 1 | -98,51 | 0 | |||||
| 2026-02-19 | 13F | Invesco Ltd. | 118.652 | -29,76 | 327 | -50,30 | ||||
| 2025-11-04 | 13F | State of Wyoming | 0 | -100,00 | 0 | |||||
| 2025-11-14 | 13F | Graham Capital Management, L.P. | 0 | -100,00 | 0 | |||||
| 2026-01-29 | 13F | Retirement Solution Inc. | 18.800 | -36,91 | 52 | -56,03 | ||||
| 2025-11-14 | 13F | Wolverine Trading, Llc | 16.706 | 66 | ||||||
| 2025-11-14 | 13F | Wolverine Trading, Llc | Call | 18.400 | 36,30 | 72 | 20,00 | |||
| 2025-11-14 | 13F | Wolverine Trading, Llc | Put | 20.400 | 75,86 | 80 | 53,85 | |||
| 2026-02-17 | 13F | State Of Wisconsin Investment Board | 18.500 | -42,13 | 51 | -58,87 | ||||
| 2026-02-06 | 13F | Covestor Ltd | 17 | 0,00 | 0 | |||||
| 2026-02-17 | 13F | Millennium Management Llc | 2.604.604 | 50,87 | 7.189 | 6,77 | ||||
| 2026-02-13 | 13F | Neuberger Berman Group LLC | 4.715.076 | -4,55 | 13.017 | -32,46 | ||||
| 2025-11-14 | 13F | Axa S.a. | 0 | -100,00 | 0 | -100,00 | ||||
| 2026-02-12 | 13F | Hrt Financial Lp | 0 | -100,00 | 0 | |||||
| 2025-11-14 | 13F | Tudor Investment Corp Et Al | 0 | -100,00 | 0 | |||||
| 2026-02-12 | 13F | Campbell & CO Investment Adviser LLC | 0 | -100,00 | 0 | |||||
| 2026-02-17 | 13F | MIRAE ASSET GLOBAL ETFS HOLDINGS Ltd. | 31.004 | -1,15 | 86 | -30,33 | ||||
| 2026-02-17 | 13F | Algert Global Llc | 0 | -100,00 | 0 | |||||
| 2026-02-11 | 13F | Los Angeles Capital Management Llc | 0 | -100,00 | 0 | |||||
| 2025-11-14 | 13F | Raymond James Financial Inc | 0 | -100,00 | 0 | |||||
| 2026-04-17 | 13F | Bell Investment Advisors, Inc | 221 | 0 | ||||||
| 2026-02-13 | 13F | Barclays Plc | 136.550 | 7,44 | 377 | -24,04 | ||||
| 2026-04-07 | 13F | Estate Planners Group, LLC | 1.000 | 3 | ||||||
| 2026-02-06 | 13F | VSM Wealth Advisory, LLC | 0 | -100,00 | 0 | |||||
| 2026-02-17 | 13F | Bank Of America Corp /de/ | 105.950 | 29,53 | 292 | -8,18 | ||||
| 2026-02-12 | 13F | Jane Street Group, Llc | Put | 0 | -100,00 | 0 | -100,00 | |||
| 2026-04-20 | 13F | Assenagon Asset Management S.A. | 188.011 | -74,80 | 389 | -81,11 | ||||
| 2026-02-11 | 13F | Group One Trading, L.p. | 15.835 | 36,63 | 44 | -4,44 | ||||
| 2026-02-11 | 13F | Group One Trading, L.p. | Call | 10.600 | -7,02 | 29 | -34,09 | |||
| 2026-02-13 | 13F | Dynamic Technology Lab Private Ltd | 76.666 | 212 | ||||||
| 2026-01-28 | 13F | Financial Perspectives, Inc | 30 | 0,00 | 0 | |||||
| 2026-02-13 | 13F | Panagora Asset Management Inc | 348.834 | -9,88 | 963 | -36,25 | ||||
| 2026-02-11 | 13F | Ameritas Investment Partners, Inc. | 6.557 | 18 | ||||||
| 2026-02-17 | 13F | Public Employees Retirement System Of Ohio | 75.317 | 1,39 | 208 | -28,37 | ||||
| 2026-02-02 | 13F | Wolverine Asset Management Llc | Put | 904.300 | 0,89 | 2.496 | -28,61 | |||
| 2026-01-15 | 13F | Nisa Investment Advisors, Llc | 200 | -96,79 | 1 | -100,00 | ||||
| 2026-02-13 | 13F | Mariner, LLC | 0 | -100,00 | 0 | |||||
| 2026-02-17 | 13F | Creative Planning | 13.479 | 37 | ||||||
| 2026-02-17 | 13F | Fmr Llc | 27.671 | 138,21 | 76 | 68,89 | ||||
| 2026-02-11 | 13F | Simplex Trading, Llc | 0 | -100,00 | 0 | |||||
| 2025-11-21 | 13F | Nebula Research & Development LLC | 0 | -100,00 | 0 | |||||
| 2026-02-13 | 13F | SRS Capital Advisors, Inc. | 0 | -100,00 | 0 | |||||
| 2026-02-06 | 13F | Pnc Financial Services Group, Inc. | 393 | 57,83 | 1 | |||||
| 2026-01-14 | 13F | Net Worth Advisory Group | 28.116 | -2,81 | 78 | -31,25 | ||||
| 2025-11-05 | 13F | Savant Capital, LLC | 0 | -100,00 | 0 | -100,00 | ||||
| 2026-02-17 | 13F | Palisade Capital Management Llc/nj | 1.491.292 | -13,75 | 4.116 | -38,97 | ||||
| 2026-02-04 | 13F | Atlantic Union Bankshares Corp | 20 | 0,00 | 0 | |||||
| 2026-02-13 | 13F | Public Employees Retirement Association Of Colorado | 0 | -100,00 | 0 | |||||
| 2026-02-17 | 13F | Qube Research & Technologies Ltd | 162.466 | -65,09 | 448 | -75,30 | ||||
| 2026-02-13 | 13F | Prudential Financial Inc | 76.376 | 15,98 | 211 | -17,97 | ||||
| 2026-02-10 | 13F | Goldman Sachs Group Inc | 379.960 | -9,55 | 1.049 | -36,02 | ||||
| 2026-04-16 | 13F | SG Americas Securities, LLC | 0 | -100,00 | 0 | |||||
| 2025-11-13 | 13F | Glenmede Investment Management, LP | 24.951 | 1,87 | 97 | -11,82 | ||||
| 2026-02-17 | 13F | Aristeia Capital Llc | 100.448 | -0,14 | 277 | -29,34 | ||||
| 2026-02-09 | 13F | Geode Capital Management, Llc | 1.558.031 | -2,83 | 4.301 | -31,23 | ||||
| 2025-11-14 | 13F | AXA Investment Managers S.A. | 23.733 | 93 | ||||||
| 2026-04-23 | 13F | Emerald Advisors, LLC | 17.292 | 0,00 | 36 | -25,53 | ||||
| 2026-03-16 | 13F/A | Rockefeller Capital Management L.P. | 1.563 | 11.064,29 | 4 | |||||
| 2026-02-17 | 13F | Tower Research Capital LLC (TRC) | 4.453 | -39,24 | 12 | -57,14 | ||||
| 2026-02-17 | 13F | XTX Topco Ltd | 221.497 | 62,41 | 611 | 15,07 | ||||
| 2026-01-15 | 13F | LeConte Wealth Management, LLC | 0 | -100,00 | 0 | -100,00 | ||||
| 2026-02-13 | 13F | Sei Investments Co | 25.934 | -26,94 | 72 | -48,55 | ||||
| 2026-02-17 | 13F | Aqr Capital Management Llc | 601.668 | -12,63 | 1.661 | -38,18 | ||||
| 2026-04-13 | 13F | IFP Advisors, Inc | 611 | 163,36 | 1 | |||||
| 2025-11-14 | 13F | Zacks Investment Management | 0 | -100,00 | 0 | |||||
| 2026-04-13 | 13F | St Germain D J Co Inc | 4 | 0,00 | 0 | |||||
| 2026-02-17 | 13F | Russell Investments Group, Ltd. | 57.999 | -25,97 | 160 | -47,54 | ||||
| 2026-02-10 | 13F | Quantbot Technologies LP | 0 | -100,00 | 0 | |||||
| 2026-02-12 | 13F | Skopos Labs, Inc. | 0 | -100,00 | 0 | |||||
| 2026-02-17 | 13F | Susquehanna Fundamental Investments, Llc | 140.180 | 387 | ||||||
| 2025-11-12 | 13F | Level Four Advisory Services, Llc | 0 | -100,00 | 0 | |||||
| 2026-01-30 | 13F | NJ State Employees Deferred Compensation Plan | 0 | -100,00 | 0 | |||||
| 2026-02-13 | 13F | Manufacturers Life Insurance Company, The | 0 | -100,00 | 0 | |||||
| 2026-02-09 | 13F | Royce & Associates Lp | 0 | -100,00 | 0 | |||||
| 2026-02-17 | 13F | Aquatic Capital Management LLC | 0 | -100,00 | 0 | -100,00 | ||||
| 2026-02-17 | 13F | Jain Global LLC | 54.234 | 150 | ||||||
| 2026-02-13 | 13F | Kayne Anderson Rudnick Investment Management Llc | 0 | -100,00 | 0 | |||||
| 2026-02-12 | 13F | Kovack Advisors, Inc. | 1.199.250 | 30,44 | 3.334 | -7,03 | ||||
| 2026-02-17 | 13F | Two Sigma Investments, Lp | 18.571 | -90,64 | 51 | -93,40 |