Grundlæggende statistik
| Institutionelle aktier (lange) | 271.531.108 - 94,77% (ex 13D/G) - change of -38,01MM shares -12,28% MRQ |
| Institutionel værdi (lang) | $ 2.291.552 USD ($1000) |
Institutionelt ejerskab og aktionærer
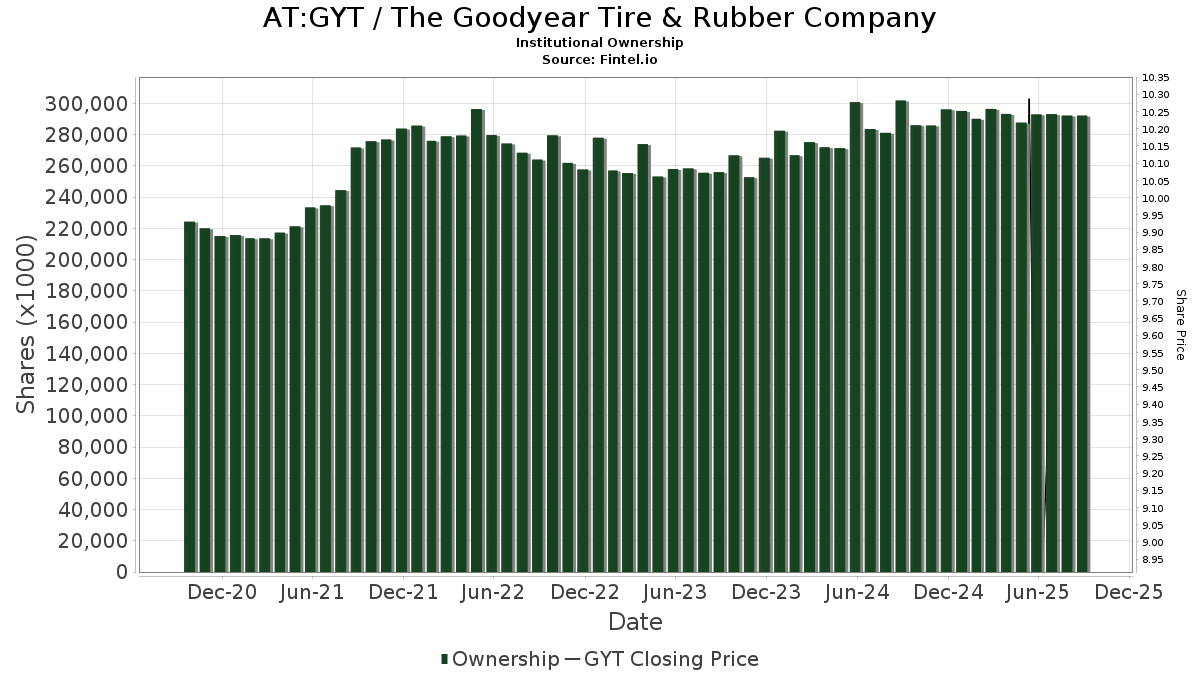
The Goodyear Tire & Rubber Company (AT:GYT) har 400 institutionelle ejere og aktionærer, der har indsendt 13D/G- eller 13F-formularer til Securities Exchange Commission (SEC). Disse institutioner har i alt 271,531,108 aktier. Største aktionærer omfatter BlackRock, Inc., Wellington Management Group Llp, Vanguard Group Inc, Dimensional Fund Advisors Lp, American Century Companies Inc, State Street Corp, Aqr Capital Management Llc, Geode Capital Management, Llc, Morgan Stanley, and Victory Capital Management Inc .
The Goodyear Tire & Rubber Company (WBAG:GYT) institutionel ejerskabsstruktur viser aktuelle positioner i virksomheden efter institutioner og fonde, samt seneste ændringer i positionsstørrelse. Større aktionærer kan omfatte individuelle investorer, investeringsforeninger, hedgefonde eller institutioner. Skema 13D angiver, at investoren besidder (eller besidder) mere end 5 % af virksomheden og har til hensigt (eller har til hensigt at) aktivt at forfølge en ændring i forretningsstrategi. Skema 13G indikerer en passiv investering på over 5%.
The share price as of April 30, 2026 is 6,04 / share. Previously, on May 9, 2025, the share price was 9,86 / share. This represents a decline of 38,78% over that period.
Fondens stemningsscore
Fund Sentiment Score (fka Ownership Accumulation Score) finder de aktier, der bliver mest købt af fonde. Det er resultatet af en sofistikeret, multi-faktor kvantitativ model, der identificerer virksomheder med de højeste niveauer af institutionel akkumulering. Scoringsmodellen bruger en kombination af den samlede stigning i oplyste ejere, ændringerne i porteføljeallokeringer i disse ejere og andre målinger. Tallet går fra 0 til 100, hvor højere tal indikerer et højere niveau af akkumulering for sine jævnaldrende, og 50 er gennemsnittet.
Opdateringsfrekvens: Dagligt
Se Ownership Explorer, som giver en liste over højest rangerende virksomheder.
AI+ Ask Fintel’s AI assistant about The Goodyear Tire & Rubber Company.
Select a question to share a public post with an AI-crafted answer.
Thinking of good questions…
13F og NPORT arkivering
Detaljer om 13F-arkivering er gratis. Detaljer om NP-ansøgninger kræver et premium-medlemskab. Grønne rækker angiver nye positioner. Røde rækker angiver lukkede positioner. Klik på linket ikon for at se den fulde transaktionshistorik.
Opgrader
for at låse premium-data op og eksportere til Excel ![]() .
.
| Fil dato | Kilde | Investor | Type | Gennemsnitlig pris (Øst) |
Aktier | Δ Aktier (%) |
Rapporteret Værdi ($1000) |
Δ Værdi (%) |
Port Alloc (%) |
|
|---|---|---|---|---|---|---|---|---|---|---|
| 2026-02-17 | 13F | Armistice Capital, Llc | 15.133 | 133 | ||||||
| 2026-02-11 | 13F | Winton Capital Group Ltd | 95.400 | 836 | ||||||
| 2026-02-11 | 13F | Ameritas Investment Partners, Inc. | 74.273 | 651 | ||||||
| 2026-02-18 | 13F | State of Tennessee, Treasury Department | 100.859 | -4,11 | 949 | 20,74 | ||||
| 2026-02-13 | 13F | Peak6 Llc | 0 | -100,00 | 0 | |||||
| 2026-02-17 | 13F | Hbk Investments L P | 0 | -100,00 | 0 | |||||
| 2026-04-20 | 13F | State of Alaska, Department of Revenue | 45.692 | 0,00 | 0 | |||||
| 2026-02-11 | 13F | Athena Investment Management | 15.610 | 0,00 | 137 | 17,24 | ||||
| 2026-04-10 | 13F/A | OP Asset Management Ltd | 383.779 | 637,47 | 2.544 | 459,12 | ||||
| 2026-02-13 | 13F | Platinum Investment Management Ltd | 8.244 | -75,69 | 72 | -71,54 | ||||
| 2026-01-28 | 13F | Universal- Beteiligungs- und Servicegesellschaft mbH | 610.377 | 1,63 | 5.347 | 19,01 | ||||
| 2025-11-06 | 13F | Versor Investments LP | 0 | -100,00 | 0 | |||||
| 2026-02-06 | 13F | Curat Global, LLC | 0 | -100,00 | 0 | |||||
| 2026-02-13 | 13F | Johnson Investment Counsel Inc | 0 | -100,00 | 0 | -100,00 | ||||
| 2026-02-10 | 13F | Norges Bank | 319.097 | 2.795 | ||||||
| 2026-04-15 | 13F | Financial Management Professionals, Inc. | 400 | 0,00 | 3 | -33,33 | ||||
| 2026-04-30 | 13F | Barnett & Company, Inc. | 120.240 | 61,83 | 797 | 22,62 | ||||
| 2026-02-17 | 13F | Caption Management, LLC | 143.734 | 1.259 | ||||||
| 2026-02-17 | 13F | Caption Management, LLC | Call | 250.000 | 25,00 | 2.190 | 46,39 | |||
| 2026-01-28 | 13F | Teacher Retirement System Of Texas | 0 | -100,00 | 0 | -100,00 | ||||
| 2026-02-19 | 13F | Invesco Ltd. | 2.085.945 | -17,68 | 18.273 | -3,59 | ||||
| 2026-02-17 | 13F | Caption Management, LLC | Put | 0 | -100,00 | 0 | -100,00 | |||
| 2026-01-14 | 13F | Moisand Fitzgerald Tamayo, LLC | 0 | -100,00 | 0 | |||||
| 2026-04-21 | 13F | Pallas Capital Advisors LLC | 0 | -100,00 | 0 | |||||
| 2026-02-13 | 13F | Stifel Financial Corp | 166.486 | 769,47 | 1.458 | 919,58 | ||||
| 2026-04-13 | 13F | Massmutual Trust Co Fsb/adv | 0 | -100,00 | 0 | |||||
| 2026-02-17 | 13F | CastleKnight Management LP | 169.400 | 0,00 | 1.484 | 17,05 | ||||
| 2026-04-23 | 13F | Farmers & Merchants Investments Inc | 249 | 0,00 | 2 | -50,00 | ||||
| 2026-04-09 | 13F | Moody National Bank Trust Division | 92.355 | -19,63 | 612 | -39,17 | ||||
| 2025-11-24 | 13F | Trust Investment Advisors | 0 | -100,00 | 0 | -100,00 | ||||
| 2026-02-04 | 13F | Midwest Trust Co | 32.331 | -0,50 | 283 | 16,46 | ||||
| 2026-02-12 | 13F | Brown Brothers Harriman & Co | 180 | 0,00 | 2 | 0,00 | ||||
| 2026-02-17 | 13F | SageView Advisory Group, LLC | 270 | 2 | ||||||
| 2026-01-30 | 13F | NJ State Employees Deferred Compensation Plan | 0 | -100,00 | 0 | -100,00 | ||||
| 2026-01-30 | 13F/A | M&t Bank Corp | 28.354 | 85,18 | 248 | 117,54 | ||||
| 2026-02-06 | 13F | Bastion Asset Management Inc. | 963.938 | 72,89 | 8.076 | 73,23 | ||||
| 2026-02-17 | 13F | Tower Research Capital LLC (TRC) | 29.107 | -14,52 | 255 | 0,00 | ||||
| 2026-04-13 | 13F | Hm Payson & Co | 1.541 | 0,00 | 10 | -23,08 | ||||
| 2026-04-30 | 13F | Horrell Capital Management, Inc. | 22.337 | -8,19 | 148 | -30,52 | ||||
| 2026-02-03 | 13F/A | Bank Of America Corp /de/ | Put | 0 | -100,00 | 0 | -100,00 | |||
| 2026-01-26 | 13F | KBC Group NV | 8.903 | 0,00 | 0 | |||||
| 2026-02-17 | 13F | Raymond James Financial Inc | 49.294 | 5,42 | 432 | 23,50 | ||||
| 2026-02-10 | 13F | CIBC World Markets Inc. | 2.265.298 | 17,38 | 19.844 | 37,48 | ||||
| 2026-02-12 | 13F | Commonwealth Equity Services, Llc | 110.438 | 4,82 | 967 | |||||
| 2026-02-13 | 13F | Headlands Technologies LLC | 42.466 | 372 | ||||||
| 2026-04-30 | 13F | BRYN MAWR TRUST Co | 3.000 | 0,00 | 20 | -26,92 | ||||
| 2026-01-22 | 13F | Encompass Wealth Advisors, Llc | 0 | -100,00 | 0 | |||||
| 2026-02-03 | 13F | Crossmark Global Holdings, Inc. | 38.630 | 125,60 | 338 | 164,06 | ||||
| 2026-02-17 | 13F | Whitebox Advisors Llc | 741.089 | -5,72 | 6.492 | 10,41 | ||||
| 2026-02-11 | 13F | Empowered Funds, LLC | 1.272.538 | 2,96 | 11.147 | 20,59 | ||||
| 2026-01-29 | 13F | State Of Michigan Retirement System | 67.626 | -0,73 | 592 | 16,31 | ||||
| 2025-11-14 | 13F | California Public Employees Retirement System | 0 | -100,00 | 0 | -100,00 | ||||
| 2026-04-16 | 13F | Guardian Investment Management | 43.200 | -1,82 | 286 | -25,71 | ||||
| 2025-11-14 | 13F | LMR Partners LLP | 0 | -100,00 | 0 | -100,00 | ||||
| 2026-02-13 | 13F | JustInvest LLC | 41.555 | 32,39 | 364 | 55,56 | ||||
| 2026-02-17 | 13F | Engineers Gate Manager LP | 152.148 | 1.333 | ||||||
| 2026-02-17 | 13F | Polymer Capital Management (US) LLC | 0 | -100,00 | 0 | |||||
| 2026-04-28 | 13F | Nbt Bank N A /ny | 128 | 1.322,22 | 1 | -100,00 | ||||
| 2026-04-15 | 13F | Fortitude Family Office, LLC | 93 | 75,47 | 1 | |||||
| 2026-04-24 | 13F | Root Financial Partners, LLC | 304 | -29,79 | 2 | -33,33 | ||||
| 2026-02-13 | 13F | Great West Life Assurance Co /can/ | 176.145 | -2,54 | 2 | 0,00 | ||||
| 2026-03-16 | 13F/A | Rockefeller Capital Management L.P. | 16.837 | -8,88 | 147 | 6,52 | ||||
| 2026-04-30 | 13F | Kestra Advisory Services, LLC | 49.687 | 6,83 | 329 | -19,16 | ||||
| 2026-02-17 | 13F | Boothbay Fund Management, Llc | 0 | -100,00 | 0 | -100,00 | ||||
| 2026-01-29 | 13F | UBS Group AG | Put | 3.000 | 0,00 | 26 | 18,18 | |||
| 2026-01-29 | 13F | UBS Group AG | Call | 98.300 | 96,60 | 861 | 130,21 | |||
| 2026-01-29 | 13F | UBS Group AG | 2.015.358 | -19,06 | 17.655 | -5,21 | ||||
| 2026-02-09 | 13F | Hantz Financial Services, Inc. | 11.822 | 123,52 | 0 | |||||
| 2026-02-17 | 13F | Sender Co & Partners, Inc. | Call | 0 | -100,00 | 0 | ||||
| 2026-02-17 | 13F | Sender Co & Partners, Inc. | 0 | -100,00 | 0 | |||||
| 2026-01-13 | 13F/A | Sanctuary Advisors, LLC | 0 | -100,00 | 0 | -100,00 | ||||
| 2026-04-07 | 13F | Farther Finance Advisors, LLC | 10.853 | -2,93 | 73 | -25,77 | ||||
| 2026-02-13 | 13F | Manufacturers Life Insurance Company, The | 0 | -100,00 | 0 | |||||
| 2026-02-10 | 13F | Goldman Sachs Group Inc | Call | 152.200 | 0,00 | 1.333 | 17,14 | |||
| 2026-02-13 | 13F | Magnolia Capital Advisors Llc | 10.200 | 0,00 | 89 | 17,11 | ||||
| 2026-02-10 | 13F | Goldman Sachs Group Inc | Put | 152.200 | 0,00 | 1.333 | 17,14 | |||
| 2026-04-30 | 13F | Fidelity D & D Bancorp Inc | 31.500 | 0,00 | 209 | -24,36 | ||||
| 2026-02-17 | 13F | Brevan Howard Capital Management LP | 369.042 | -15,78 | 3.233 | -1,37 | ||||
| 2025-11-14 | 13F | Susquehanna Fundamental Investments, Llc | 0 | -100,00 | 0 | -100,00 | ||||
| 2026-02-10 | 13F | Goldman Sachs Group Inc | 4.202.683 | 111,01 | 36.816 | 147,11 | ||||
| 2026-02-13 | 13F | Parkside Financial Bank & Trust | 404 | 116,04 | 4 | 200,00 | ||||
| 2026-02-09 | 13F | Hartland & Co., LLC | 7.647 | -77,26 | 67 | -73,71 | ||||
| 2026-02-17 | 13F | Ameriflex Group, Inc. | 1.372 | -50,00 | 12 | -40,00 | ||||
| 2026-02-12 | 13F | State Board Of Administration Of Florida Retirement System | 90.543 | 0,00 | 793 | 17,13 | ||||
| 2026-04-30 | 13F | Caisse Des Depots Et Consignations | 12.163 | 81 | ||||||
| 2026-02-11 | 13F | Cerity Partners LLC | 68.206 | 37,22 | 597 | 60,92 | ||||
| 2026-02-17 | 13F | Nomura Holdings Inc | 0 | -100,00 | 0 | -100,00 | ||||
| 2026-02-13 | 13F | National Bank Of Canada /fi/ | 23.427 | -27,87 | 205 | -15,70 | ||||
| 2026-02-17 | 13F | Nomura Holdings Inc | Put | 0 | -100,00 | 0 | -100,00 | |||
| 2026-04-15 | 13F | Merit Financial Group, LLC | 12.430 | -19,51 | 82 | -39,26 | ||||
| 2026-02-04 | 13F | Swiss Life Asset Management Ltd | 12.617 | 5,03 | 111 | 23,60 | ||||
| 2026-02-10 | 13F | Monaco Asset Management SAM | 240.000 | 140,00 | 2.102 | 181,02 | ||||
| 2026-04-24 | 13F | Strs Ohio | 124.700 | 28,29 | 827 | -2,94 | ||||
| 2026-02-10 | 13F | Bank of New York Mellon Corp | 1.816.036 | -3,15 | 15.908 | 13,43 | ||||
| 2026-02-04 | 13F | First Eagle Investment Management, LLC | 0 | -100,00 | 0 | |||||
| 2026-02-20 | 13F | Sunbelt Securities, Inc. | 96 | -80,80 | 1 | -100,00 | ||||
| 2026-02-11 | 13F | LPL Financial LLC | 261.336 | 10,03 | 2.289 | 28,89 | ||||
| 2026-02-12 | 13F | EntryPoint Capital, LLC | 28.012 | 245 | ||||||
| 2025-11-13 | 13F | Clear Street Markets Llc | Put | 0 | -100,00 | 0 | -100,00 | |||
| 2026-02-17 | 13F | Two Sigma Securities, Llc | 40.719 | 357 | ||||||
| 2026-02-09 | 13F | Geode Capital Management, Llc | 7.245.230 | 6,62 | 63.479 | 24,87 | ||||
| 2025-11-06 | 13F | Ameritas Advisory Services, LLC | 0 | -100,00 | 0 | -100,00 | ||||
| 2026-02-13 | 13F | First Trust Advisors Lp | 525.020 | 56,37 | 4.599 | 83,15 | ||||
| 2026-02-17 | 13F | Mercer Global Advisors Inc /adv | 16.512 | 41,12 | 145 | 65,52 | ||||
| 2026-02-17 | 13F | Coppell Advisory Solutions LLC | 22.793 | -3,39 | 204 | 15,34 | ||||
| 2026-02-17 | 13F | Twinbeech Capital Lp | 249.700 | 2.187 | ||||||
| 2026-04-28 | 13F | Quent Capital, LLC | 53.520 | 0,22 | 355 | -24,20 | ||||
| 2026-04-20 | 13F | Jfs Wealth Advisors, Llc | 235 | -9,62 | 2 | -50,00 | ||||
| 2026-02-13 | 13F | American Century Companies Inc | 12.594.530 | 1,10 | 110.328 | 18,40 | ||||
| 2026-02-17 | 13F | Farringdon Capital, Ltd. | 24.573 | 70,14 | 215 | 99,07 | ||||
| 2025-11-03 | 13F | Agp Franklin, Llc | 0 | -100,00 | 0 | -100,00 | ||||
| 2025-11-10 | 13F | Towle & Co | 0 | -100,00 | 0 | -100,00 | ||||
| 2026-04-24 | 13F | Medallion Wealth Advisors, LLC | 4.600 | 318,18 | 30 | 233,33 | ||||
| 2026-02-19 | 13F | CI Private Wealth, LLC | 16.013 | -62,97 | 143 | -56,04 | ||||
| 2026-02-13 | 13F | Venture Visionary Partners LLC | Call | 70.000 | -30,00 | 613 | -18,05 | |||
| 2026-02-17 | 13F | Aristeia Capital Llc | 37.159 | 326 | ||||||
| 2026-02-13 | 13F | Landscape Capital Management, L.l.c. | 0 | -100,00 | 0 | |||||
| 2026-02-09 | 13F | New Age Alpha Advisors, LLC | 40.009 | -8,37 | 350 | 7,36 | ||||
| 2026-02-13 | 13F | Walleye Trading LLC | 317.654 | 38,34 | 2.783 | 62,03 | ||||
| 2026-02-17 | 13F | Fmr Llc | Put | 6.200 | 54 | |||||
| 2026-01-28 | 13F | Arizona State Retirement System | 75.745 | -5,63 | 664 | 10,50 | ||||
| 2026-02-11 | 13F | Waddell & Associates, Llc | 12.981 | 114 | ||||||
| 2026-02-13 | 13F | Walleye Trading LLC | Put | 308.300 | 15,17 | 2.701 | 34,87 | |||
| 2026-02-02 | 13F | Mutual Advisors, LLC | 0 | -100,00 | 0 | |||||
| 2026-02-13 | 13F | Walleye Trading LLC | Call | 142.100 | -13,67 | 1.245 | 1,06 | |||
| 2026-02-17 | 13F | Fmr Llc | 340.659 | -1,15 | 2.984 | 15,79 | ||||
| 2026-02-12 | 13F | Voya Investment Management Llc | 47.333 | -49,31 | 415 | -40,69 | ||||
| 2026-04-14 | 13F | Zrc Wealth Management, Llc | 15 | 0,00 | 0 | |||||
| 2025-11-12 | 13F | Legacy Capital Group California, Inc. | 0 | -100,00 | 0 | |||||
| 2026-02-13 | 13F | Squarepoint Ops LLC | 0 | -100,00 | 0 | -100,00 | ||||
| 2026-02-02 | 13F | Principal Financial Group Inc | 619.430 | -3,67 | 5.426 | 12,83 | ||||
| 2026-02-18 | 13F | GWM Advisors LLC | 136.011 | -5,95 | 1.191 | 10,18 | ||||
| 2025-11-14 | 13F | WealthTrak Capital Management LLC | 0 | -100,00 | 0 | |||||
| 2025-11-07 | 13F | Shell Asset Management Co | 9.437 | -58,31 | 0 | |||||
| 2026-02-17 | 13F | Paloma Partners Management Co | Call | 1.400.000 | -35,03 | 12.264 | -23,91 | |||
| 2026-02-17 | 13F | EFG International AG | 3.000 | 26 | ||||||
| 2025-11-06 | 13F | Madison Asset Management, LLC | 0 | -100,00 | 0 | |||||
| 2026-02-12 | 13F | Birmingham Capital Management Co Inc/al | 54.100 | -7,68 | 474 | 7,99 | ||||
| 2026-02-13 | 13F | Venture Visionary Partners LLC | 73.096 | -1,31 | 640 | 15,52 | ||||
| 2026-02-06 | 13F | Newport Trust Co | 3.571.120 | -4,06 | 31.283 | 12,37 | ||||
| 2026-02-13 | 13F | Neo Ivy Capital Management | 0 | -100,00 | 0 | -100,00 | ||||
| 2026-02-17 | 13F | Tudor Investment Corp Et Al | Call | 70.700 | -11,51 | 619 | 3,69 | |||
| 2026-02-17 | 13F | Tudor Investment Corp Et Al | 358.590 | 51,74 | 3.141 | 77,76 | ||||
| 2026-02-17 | 13F | Tudor Investment Corp Et Al | Put | 174.400 | 1.528 | |||||
| 2026-02-10 | 13F | Envestnet Asset Management Inc | 15.009 | -7,71 | 131 | 8,26 | ||||
| 2026-02-13 | 13F | Verition Fund Management LLC | 347.957 | -23,09 | 3.048 | -9,93 | ||||
| 2026-02-12 | 13F | Renaissance Technologies Llc | 0 | -100,00 | 0 | -100,00 | ||||
| 2026-04-30 | 13F | Nisa Investment Advisors, Llc | 26.114 | 1,89 | 173 | -22,77 | ||||
| 2025-11-13 | 13F | Wells Fargo & Company/mn | Call | 0 | -100,00 | 0 | -100,00 | |||
| 2026-04-20 | 13F | Louisiana State Employees Retirement System | 83.000 | 4,80 | 550 | -20,63 | ||||
| 2026-04-17 | 13F | Bell Investment Advisors, Inc | 112 | -84,84 | 1 | -100,00 | ||||
| 2026-02-10 | 13F | Bnp Paribas Arbitrage, Sa | 1.285.756 | 47,97 | 11.263 | 73,30 | ||||
| 2026-02-10 | 13F | Moors & Cabot, Inc. | 10.700 | 0,00 | 94 | 16,25 | ||||
| 2026-02-13 | 13F | Squarepoint Ops LLC | Call | 211.700 | 105,73 | 1.854 | 141,09 | |||
| 2026-02-13 | 13F | Squarepoint Ops LLC | Put | 81.500 | 25,97 | 714 | 47,62 | |||
| 2026-02-02 | 13F | Danske Bank A/s | 100 | 0,00 | 1 | |||||
| 2026-02-13 | 13F | Maverick Capital Ltd | 0 | -100,00 | 0 | |||||
| 2026-02-06 | 13F | Bare Financial Services, Inc | 135 | 1 | ||||||
| 2026-02-11 | 13F | Jpmorgan Chase & Co | 779.795 | 69,97 | 6.831 | 99,10 | ||||
| 2026-02-18 | 13F | Vident Advisory, LLC | 0 | -100,00 | 0 | |||||
| 2026-02-06 | 13F | HighTower Advisors, LLC | Put | 0 | -100,00 | 0 | ||||
| 2026-01-30 | 13F | Mitsubishi UFJ Trust & Banking Corp | 373.078 | 3,71 | 3.268 | 21,49 | ||||
| 2026-02-13 | 13F | Glen Eagle Advisors, LLC | 0 | 0 | ||||||
| 2026-02-05 | 13F | Amalgamated Bank | 120.181 | -3,63 | 1 | |||||
| 2026-02-13 | 13F | LM Asset (IM) Inc. | 1.680.000 | 229,41 | 14.717 | 285,84 | ||||
| 2026-02-17 | 13F | Citadel Advisors Llc | Call | 739.000 | -50,85 | 6.474 | -42,44 | |||
| 2026-01-12 | 13F | Rialto Wealth Management, LLC | 16 | 33,33 | 0 | |||||
| 2026-02-17 | 13F | Citadel Advisors Llc | 959.458 | 85,36 | 8.405 | 117,10 | ||||
| 2026-02-17 | 13F | Citadel Advisors Llc | Put | 1.273.100 | -9,64 | 11.152 | 5,83 | |||
| 2026-01-08 | 13F | Profit Investment Management, LLC | 0 | -100,00 | 0 | |||||
| 2026-04-08 | 13F | DiNuzzo Private Wealth, Inc. | 35 | 52,17 | 0 | |||||
| 2026-01-21 | 13F | Newbridge Financial Services Group, Inc. | 7.749 | 29,15 | 68 | 52,27 | ||||
| 2026-02-04 | 13F | Pacer Advisors, Inc. | 0 | -100,00 | 0 | |||||
| 2025-11-14 | 13F | Point72 Hong Kong Ltd | 0 | -100,00 | 0 | -100,00 | ||||
| 2026-02-10 | 13F | Quantbot Technologies LP | 297.836 | 2.609 | ||||||
| 2025-11-14 | 13F | Lazard Asset Management Llc | 0 | -100,00 | 0 | |||||
| 2026-04-09 | 13F | Vista Investment Partners Llc | 23.000 | 4,55 | 152 | -20,83 | ||||
| 2026-02-17 | 13F | Bridgeway Capital Management Inc | 2.081.725 | 1,91 | 18.236 | 19,35 | ||||
| 2026-02-13 | 13F | BNP Paribas Asset Management Holding S.A. | 4.170 | 37,53 | 0 | |||||
| 2026-04-24 | 13F | Yousif Capital Management, Llc | 100.750 | -4,38 | 668 | -29,42 | ||||
| 2026-04-29 | 13F | CVA Family Office, LLC | 360 | 2 | ||||||
| 2026-04-23 | 13F | SJS Investment Consulting Inc. | 1.128 | -21,17 | 7 | -41,67 | ||||
| 2026-02-17 | 13F | Point72 Asset Management, L.P. | 1.113.054 | 9.750 | ||||||
| 2026-04-28 | 13F | SBI Securities Co., Ltd. | 1.765 | 21,89 | 12 | -8,33 | ||||
| 2026-02-17 | 13F | Two Sigma Advisers, Lp | 0 | -100,00 | 0 | |||||
| 2026-04-03 | 13F | Investors Research Corp | 38.750 | 3,82 | 257 | -21,47 | ||||
| 2026-02-11 | 13F | Parallel Advisors, LLC | 7.114 | 55,46 | 62 | 82,35 | ||||
| 2026-02-17 | 13F | Shelton Capital Management | 0 | -100,00 | 0 | |||||
| 2026-04-20 | 13F | Assenagon Asset Management S.A. | 157.490 | 1.044 | ||||||
| 2026-02-11 | 13F | Fox Run Management, L.l.c. | 12.493 | -41,66 | 109 | -31,87 | ||||
| 2026-02-05 | 13F | GABELLI & Co INVESTMENT ADVISERS, INC. | 63.800 | 64,43 | 559 | 92,41 | ||||
| 2026-02-23 | 13F | Wealth Preservation Advisors, LLC | 465 | 0,00 | 4 | 33,33 | ||||
| 2026-04-15 | 13F | Cranbrook Wealth Management, LLC | 76 | 0,00 | 1 | |||||
| 2025-11-12 | 13F | Solstein Capital, LLC | 0 | -100,00 | 0 | |||||
| 2026-04-27 | 13F | Sound Income Strategies, LLC | 178 | 0,00 | 1 | 0,00 | ||||
| 2026-02-17 | 13F | Credit Agricole S A | 0 | -100,00 | 0 | |||||
| 2026-01-23 | 13F | Private Wealth Management Group, LLC | 0 | -100,00 | 0 | |||||
| 2026-02-03 | 13F | International Assets Investment Management, Llc | 709 | 6 | ||||||
| 2026-02-17 | 13F | Northern Trust Corp | 3.540.433 | -3,22 | 31.014 | 13,34 | ||||
| 2025-11-14 | 13F/A | Clear Harbor Asset Management, LLC | 0 | -100,00 | 0 | |||||
| 2026-02-13 | 13F | Quarry LP | 0 | -100,00 | 0 | |||||
| 2026-02-17 | 13F | Aqr Capital Management Llc | 9.764.853 | 151,81 | 85.540 | 194,90 | ||||
| 2026-02-17 | 13F | Trexquant Investment LP | 1.578.990 | 131,27 | 13.832 | 170,88 | ||||
| 2026-01-27 | 13F | Hedges Asset Management LLC | 96.000 | -15,04 | 841 | -0,59 | ||||
| 2025-11-14 | 13F | Nomura Holdings Inc | Call | 0 | -100,00 | 0 | -100,00 | |||
| 2026-02-17 | 13F | Graham Capital Management, L.P. | 12.572 | -41,24 | 110 | -31,25 | ||||
| 2026-02-06 | 13F | Global Retirement Partners, LLC | 2.635 | -77,97 | 23 | -74,16 | ||||
| 2026-02-06 | 13F | Cullen/frost Bankers, Inc. | 7 | 0 | ||||||
| 2026-01-09 | 13F | 180 Wealth Advisors, Llc | 23.911 | -78,31 | 209 | -74,64 | ||||
| 2026-01-23 | 13F | Ogorek Anthony Joseph /ny/ /adv | 245 | -23,44 | 0 | |||||
| 2026-02-09 | 13F | Frazier Financial Advisors, LLC | 600 | 5 | ||||||
| 2026-04-27 | 13F | Truist Financial Corp | 22.101 | 0,00 | 147 | -24,35 | ||||
| 2026-04-20 | 13F | City State Bank | 100 | 0,00 | 1 | |||||
| 2026-02-17 | 13F | Hotchkis & Wiley Capital Management Llc | 1.116.546 | 17,12 | 9.781 | 37,15 | ||||
| 2026-04-28 | 13F | Harbor Capital Advisors, Inc. | 1.737 | -51,71 | 0 | |||||
| 2026-02-05 | 13F | Northwestern Mutual Investment Management Company, Llc | 64.025 | 0,42 | 561 | 17,65 | ||||
| 2026-02-17 | 13F | Qube Research & Technologies Ltd | 0 | -100,00 | 0 | |||||
| 2026-02-17 | 13F | Jones Financial Companies Lllp | 129.125 | 516,05 | 1.131 | 589,63 | ||||
| 2026-04-06 | 13F | CX Institutional | 620 | 0,00 | 0 | |||||
| 2026-02-12 | 13F | Adviser Investments LLC | 0 | -100,00 | 0 | |||||
| 2026-02-09 | 13F | Jefferies Financial Group Inc. | 34.700 | 6,55 | 304 | 24,69 | ||||
| 2026-02-10 | 13F | BW Gestao de Investimentos Ltda. | Call | 0 | -100,00 | 0 | -100,00 | |||
| 2026-02-13 | 13F | Gendell Jeffrey L | 820.569 | 7.188 | ||||||
| 2026-02-17 | 13F | Lombard Odier Asset Management (USA) Corp | 136.000 | -14,47 | 1.191 | 0,17 | ||||
| 2026-04-14 | 13F | Bay Harbor Wealth Management, LLC | 21 | -38,24 | 0 | |||||
| 2026-01-13 | 13F | Mather Group, Llc. | 0 | -100,00 | 0 | |||||
| 2026-02-13 | 13F | Neuberger Berman Group LLC | 14.638 | -22,80 | 128 | -9,22 | ||||
| 2025-11-14 | 13F | Ewing Morris & Co. Investment Partners Ltd. | 0 | -100,00 | 0 | -100,00 | ||||
| 2026-02-17 | 13F | Lombard Odier Asset Management (USA) Corp | Put | 100.000 | 0,00 | 876 | 17,11 | |||
| 2026-02-17 | 13F | Man Group plc | 157.759 | 78,35 | 1.382 | 108,93 | ||||
| 2026-02-12 | 13F | New York State Common Retirement Fund | 77.142 | 0,00 | 676 | 16,98 | ||||
| 2026-02-17 | 13F | Capstone Investment Advisors, Llc | 0 | -100,00 | 0 | -100,00 | ||||
| 2026-04-28 | 13F | Stratos Wealth Partners, LTD. | 21.408 | -25,29 | 142 | -43,82 | ||||
| 2026-02-13 | 13F | Bridgefront Capital, LLC | 34.957 | 306 | ||||||
| 2026-02-13 | 13F | Mariner, LLC | 0 | -100,00 | 0 | |||||
| 2026-02-05 | 13F | AlphaCore Capital LLC | 596 | 59.500,00 | 5 | |||||
| 2026-01-29 | 13F | Teachers Retirement System Of The State Of Kentucky | 96.548 | 0,00 | 1 | |||||
| 2026-02-17 | 13F | Appaloosa Lp | 2.500.000 | -51,36 | 21.900 | -43,04 | ||||
| 2026-04-22 | 13F | Janney Montgomery Scott LLC | 43.693 | -8,47 | 0 | |||||
| 2026-02-13 | 13F | Blueshift Asset Management, LLC | 0 | -100,00 | 0 | |||||
| 2026-02-11 | 13F | Simplex Trading, Llc | 441.421 | 13,87 | 3.867 | 193.200,00 | ||||
| 2026-02-23 | 13F | Beaird Harris Wealth Management, LLC | 0 | -100,00 | 0 | |||||
| 2026-02-11 | 13F | Simplex Trading, Llc | Call | 288.400 | 57,25 | 2.526 | 252.500,00 | |||
| 2026-02-11 | 13F | Simplex Trading, Llc | Put | 296.500 | -46,52 | 2.597 | 64.825,00 | |||
| 2026-04-29 | 13F | Oregon Public Employees Retirement Fund | 58.743 | 3,34 | 389 | -21,73 | ||||
| 2026-02-23 | 13F | Virtu Financial LLC | 0 | -100,00 | 0 | |||||
| 2025-11-14 | 13F | Aigen Investment Management, Lp | 0 | -100,00 | 0 | |||||
| 2026-02-13 | 13F | Citigroup Inc | 621.199 | -23,79 | 5.442 | -10,74 | ||||
| 2026-02-17 | 13F | Susquehanna Portfolio Strategies, LLC | 1.034.430 | 551,50 | 9.062 | 663,35 | ||||
| 2026-02-17 | 13F | Woodline Partners LP | 816.149 | 7.149 | ||||||
| 2025-11-06 | 13F | Assetmark, Inc | 0 | -100,00 | 0 | |||||
| 2026-04-21 | 13F | Fruth Investment Management | 63.366 | -1,99 | 0 | |||||
| 2026-02-04 | 13F | Virginia Retirement Systems Et Al | 68.950 | 6,73 | 604 | 25,05 | ||||
| 2026-02-18 | 13F | Mackenzie Financial Corp | 16.459 | 0,00 | 147 | 19,51 | ||||
| 2026-02-17 | 13F | Guggenheim Capital Llc | 30.044 | -49,24 | 263 | -40,50 | ||||
| 2026-02-10 | 13F | Jupiter Asset Management Ltd | 787.394 | -66,70 | 6.898 | -61,00 | ||||
| 2026-04-23 | 13F | Chelsea Counsel Co | 97.250 | 0,00 | 852 | 0,00 | ||||
| 2026-02-13 | 13F | Barclays Plc | 928.093 | 0,69 | 8.130 | 17,93 | ||||
| 2026-04-17 | 13F | Vermillion Wealth Management, Inc. | 26 | 0 | ||||||
| 2026-02-13 | 13F | Barclays Plc | Call | 450.000 | 0,00 | 3.942 | 17,11 | |||
| 2025-11-12 | 13F | Transce3nd, LLC | 0 | -100,00 | 0 | |||||
| 2026-02-11 | 13F | Los Angeles Capital Management Llc | 3.018 | 21 | ||||||
| 2026-02-12 | 13F | Ensign Peak Advisors, Inc | 19.752 | -99,21 | 173 | -99,07 | ||||
| 2026-02-13 | 13F | Public Employees Retirement Association Of Colorado | 28.840 | 0,00 | 0 | |||||
| 2026-03-09 | 13F | EMC Capital Management | 4.323 | -15,00 | 0 | |||||
| 2026-04-30 | 13F | KLCM Advisors, Inc. | 1.626.722 | -0,40 | 10.785 | -24,62 | ||||
| 2026-04-30 | 13F | KLCM Advisors, Inc. | Call | 386.000 | 0,00 | 2.559 | 373,89 | |||
| 2026-02-13 | 13F | Palisade Asset Management, LLC | 0 | -100,00 | 0 | |||||
| 2026-02-17 | 13F | D. E. Shaw & Co., Inc. | Put | 560.000 | -12,10 | 4.906 | 2,94 | |||
| 2026-02-12 | 13F | BlackRock, Inc. | 33.675.030 | 0,31 | 294.993 | 17,48 | ||||
| 2026-02-17 | 13F | D. E. Shaw & Co., Inc. | 1.633.775 | 38,92 | 14.312 | 62,70 | ||||
| 2026-02-17 | 13F | D. E. Shaw & Co., Inc. | Call | 135.700 | 0,00 | 1.189 | 17,04 | |||
| 2026-02-12 | 13F | SWAN Capital LLC | 50 | 0,00 | 0 | |||||
| 2025-11-13 | 13F | HITE Hedge Asset Management LLC | 0 | -100,00 | 0 | -100,00 | ||||
| 2026-02-17 | 13F | Grantham, Mayo, Van Otterloo & Co. LLC | 30.150 | 264 | ||||||
| 2025-11-14 | 13F | Texas Permanent School Fund | 0 | -100,00 | 0 | -100,00 | ||||
| 2025-11-10 | 13F | Pekin Hardy Strauss, Inc. | 0 | -100,00 | 0 | -100,00 | ||||
| 2026-02-17 | 13F | Invenomic Capital Management LP | 1.028.330 | -44,07 | 9.008 | -34,50 | ||||
| 2026-04-27 | 13F | New York State Teachers Retirement System | 213.140 | -20,32 | 1 | -50,00 | ||||
| 2026-02-12 | 13F | Swiss National Bank | 535.758 | 1,79 | 4.693 | 19,20 | ||||
| 2026-02-17 | 13F | Canada Pension Plan Investment Board | 1.231.911 | 0,33 | 10.792 | 17,50 | ||||
| 2026-02-05 | 13F | Atria Investments Llc | 29.166 | 3,64 | 255 | 21,43 | ||||
| 2026-01-28 | 13F | Geneos Wealth Management Inc. | 189 | 0,00 | 2 | 0,00 | ||||
| 2026-02-10 | 13F | Commonwealth Of Pennsylvania Public School Empls Retrmt Sys | 71.609 | -2,46 | 627 | 14,21 | ||||
| 2026-04-30 | 13F | Clear Street Markets Llc | 0 | -100,00 | 0 | |||||
| 2026-02-12 | 13F | DRW Securities, LLC | 0 | -100,00 | 0 | -100,00 | ||||
| 2026-02-13 | 13F | Marshall Wace, Llp | 0 | -100,00 | 0 | |||||
| 2026-02-13 | 13F | Prudential Financial Inc | 36.691 | -89,31 | 321 | -87,50 | ||||
| 2026-02-13 | 13F | Victory Capital Management Inc | 5.723.748 | 8,67 | 50.140 | 27,26 | ||||
| 2026-02-13 | 13F | Toroso Investments, LLC | 0 | -100,00 | 0 | -100,00 | ||||
| 2026-04-06 | 13F | Highline Wealth Partners Llc | 0 | -100,00 | 0 | |||||
| 2026-02-13 | 13F | Sei Investments Co | 529.518 | 1,64 | 4.639 | 19,10 | ||||
| 2026-02-17 | 13F | Solas Capital Management, LLC | 676.976 | -2,11 | 5.930 | 14,66 | ||||
| 2025-11-10 | 13F | Rosenberg Matthew Hamilton | 0 | -100,00 | 0 | |||||
| 2026-04-08 | 13F | Wealth Enhancement Advisory Services, Llc | 40.438 | 10,89 | 199 | -41,81 | ||||
| 2026-04-29 | 13F | Klp Kapitalforvaltning As | 60.409 | 4,68 | 401 | -20,79 | ||||
| 2026-02-17 | 13F | Jump Financial, LLC | 0 | -100,00 | 0 | -100,00 | ||||
| 2026-02-06 | 13F | Flynn Zito Capital Management, Llc | 14.033 | 25,29 | 123 | 46,99 | ||||
| 2026-04-06 | 13F | Versant Capital Management, Inc | 623 | -85,53 | 4 | -89,19 | ||||
| 2026-04-29 | 13F/A | Salem Investment Counselors Inc | 1.000 | 7 | ||||||
| 2026-01-29 | 13F | Comerica Bank | 68.481 | -9,42 | 600 | 6,02 | ||||
| 2026-02-03 | 13F | Bokf, Na | 0 | -100,00 | 0 | |||||
| 2026-02-10 | 13F | Axq Capital, Lp | 0 | -100,00 | 0 | |||||
| 2026-02-10 | 13F | Intech Investment Management Llc | 99.349 | -78,72 | 870 | -75,08 | ||||
| 2026-02-12 | 13F | Bank Of Montreal /can/ | 54.224 | 19,33 | 475 | 40,12 | ||||
| 2026-02-05 | 13F | Bessemer Group Inc | 1.166 | -62,06 | 0 | |||||
| 2026-04-15 | 13F | Trust Co Of Toledo Na /oh/ | 300 | 0,00 | 2 | -50,00 | ||||
| 2026-02-17 | 13F | EVR Research LP | 0 | -100,00 | 0 | -100,00 | ||||
| 2026-02-04 | 13F | Valeo Financial Advisors, LLC | 0 | -100,00 | 0 | |||||
| 2026-02-12 | 13F | Ci Investments Inc. | 55.000 | 0,00 | 482 | |||||
| 2026-02-05 | 13F | HFM Investment Advisors, LLC | 14 | -36,36 | 0 | |||||
| 2026-02-17 | 13F | Russell Investments Group, Ltd. | 86.984 | -26,11 | 766 | -13,07 | ||||
| 2026-01-14 | 13F | Net Worth Advisory Group | 25.519 | 15,92 | 224 | 35,98 | ||||
| 2026-02-12 | 13F | Cibc World Markets Corp | 18.265 | -43,27 | 160 | -51,95 | ||||
| 2026-02-17 | 13F | Jain Global LLC | 26.264 | 230 | ||||||
| 2026-02-12 | 13F | Xponance, Inc. | 35.546 | -21,23 | 311 | -7,72 | ||||
| 2026-02-11 | 13F | CenterBook Partners LP | 1.215.102 | 10.644 | ||||||
| 2026-02-17 | 13F | Captrust Financial Advisors | 10.609 | 93 | ||||||
| 2026-02-10 | 13F | New Mexico Educational Retirement Board | 57.800 | 0,00 | 1 | |||||
| 2026-02-06 | 13F | EverSource Wealth Advisors, LLC | 800 | -54,26 | 7 | -46,15 | ||||
| 2026-03-04 | 13F/A | Savant Capital, LLC | 0 | -100,00 | 0 | -100,00 | ||||
| 2026-02-12 | 13F | MetLife Investment Management, LLC | 287.775 | -1,42 | 2.521 | 15,44 | ||||
| 2026-02-17 | 13F | Equitable Holdings, Inc. | 10.951 | 96 | ||||||
| 2026-02-17 | 13F | Capital Fund Management S.a. | Put | 90.200 | 4,52 | 790 | 22,48 | |||
| 2026-02-17 | 13F | Capital Fund Management S.a. | Call | 99.500 | -21,84 | 872 | -8,51 | |||
| 2025-11-10 | 13F | Atlantic Trust, LLC | 0 | -100,00 | 0 | |||||
| 2026-02-12 | 13F | Steward Partners Investment Advisory, Llc | 552 | 10,40 | 5 | 33,33 | ||||
| 2026-02-17 | 13F | California State Teachers Retirement System | 257.492 | 3,23 | 2.256 | 20,91 | ||||
| 2026-04-06 | 13F | GAMMA Investing LLC | 4.142 | -48,63 | 27 | -61,43 | ||||
| 2026-02-11 | 13F | Barrow Hanley Mewhinney & Strauss Llc | 1.164 | 0,00 | 10 | 25,00 | ||||
| 2025-11-14 | 13F | Greenvale Capital LLP | 0 | -100,00 | 0 | |||||
| 2026-02-13 | 13F | Caxton Associates Llp | 374.845 | 3.284 | ||||||
| 2025-11-14 | 13F | Balyasny Asset Management Llc | 0 | -100,00 | 0 | |||||
| 2026-02-12 | 13F | Principal Securities, Inc. | 0 | -100,00 | 0 | |||||
| 2026-04-23 | 13F | Glass Jacobson Investment Advisors llc | 850 | 21,43 | 6 | -16,67 | ||||
| 2026-04-17 | 13F | Sovereign Financial Group, Inc. | 10.500 | 70 | ||||||
| 2026-02-13 | 13F | Dynamic Technology Lab Private Ltd | 25.257 | 221 | ||||||
| 2025-11-13 | 13F | Css Llc/il | Put | 0 | -100,00 | 0 | -100,00 | |||
| 2026-04-16 | 13F | SG Americas Securities, LLC | 1.447.677 | 113,53 | 10 | 80,00 | ||||
| 2026-02-05 | 13F | John G Ullman & Associates Inc | 17.300 | -5,46 | 152 | 11,03 | ||||
| 2026-02-12 | 13F | Quadrant Capital Group Llc | 693 | -96,21 | 6 | -95,59 | ||||
| 2025-11-21 | 13F/A | CIBC Bancorp USA Inc. | 27.853 | 208 | ||||||
| 2025-11-12 | 13F | HAP Trading, LLC | Put | 122.900 | 308 | |||||
| 2026-02-11 | 13F | Franklin Resources Inc | 106.276 | -35,93 | 931 | -25,00 | ||||
| 2026-02-06 | 13F | Pnc Financial Services Group, Inc. | 33.602 | 121,01 | 294 | 160,18 | ||||
| 2025-11-12 | 13F | HAP Trading, LLC | Call | 125.500 | 16 | |||||
| 2026-04-27 | 13F | Counterpoint Mutual Funds LLC | 124.171 | 823 | ||||||
| 2026-02-17 | 13F | Quadrature Capital Ltd | 37.215 | 326 | ||||||
| 2025-11-13 | 13F | Natixis Advisors, L.p. | 0 | -100,00 | 0 | |||||
| 2026-01-05 | 13F | Coastline Trust Co | 0 | -100,00 | 0 | |||||
| 2026-01-29 | 13F | Dunhill Financial, LLC | 5 | 0 | ||||||
| 2026-02-17 | 13F | Aquatic Capital Management LLC | 162.539 | 1.424 | ||||||
| 2026-04-22 | 13F | Sterling Capital Management LLC | 9.147 | -42,52 | 61 | -56,83 | ||||
| 2026-04-30 | 13F | Torren Management, LLC | 0 | -100,00 | 0 | |||||
| 2026-04-29 | 13F | Skopos Labs, Inc. | 0 | -100,00 | 0 | |||||
| 2026-02-13 | 13F | Mml Investors Services, Llc | 0 | -100,00 | 0 | -100,00 | ||||
| 2026-02-11 | 13F | Allianz Asset Management GmbH | 1.176.642 | 3,67 | 10.307 | 21,42 | ||||
| 2026-02-13 | 13F | Macquarie Group Ltd | 0 | -100,00 | 0 | -100,00 | ||||
| 2026-02-11 | 13F | CSM Advisors, LLC | 473.078 | 29,58 | 4 | 100,00 | ||||
| 2026-02-17 | 13F | Cetera Investment Advisers | 131.568 | 0,98 | 1.153 | 18,28 | ||||
| 2025-11-12 | 13F | NewSquare Capital LLC | 0 | -100,00 | 0 | |||||
| 2026-04-24 | 13F | SummerHaven Investment Management, LLC | 57.217 | -23,51 | 379 | -42,14 | ||||
| 2026-02-12 | 13F | Cloud Capital Management, LLC | 0 | -100,00 | 0 | |||||
| 2026-02-13 | 13F | Commerce Bank | 38.906 | 0,00 | 341 | 16,84 | ||||
| 2026-02-17 | 13F | Bank Of America Corp /de/ | 1.077.338 | 23,61 | 9.437 | 44,76 | ||||
| 2026-04-13 | 13F | Creative Financial Designs Inc /adv | 65 | 0,00 | 0 | |||||
| 2026-02-13 | 13F | Vontobel Holding Ltd. | 101.565 | 194,36 | 890 | 244,57 | ||||
| 2026-04-17 | 13F | HHM Wealth Advisors, LLC | 265 | -61,59 | 2 | -83,33 | ||||
| 2026-04-27 | 13F | 4wealth Advisors, Inc. | 98.877 | 3,34 | 622 | -25,89 | ||||
| 2026-02-17 | 13F | Advisory Services Network, LLC | 56.631 | 2,77 | 496 | 20,39 | ||||
| 2026-01-22 | 13F | Ransom Advisory, Ltd | 0 | -100,00 | 0 | -100,00 | ||||
| 2026-04-24 | 13F | Profund Advisors Llc | 10.144 | -9,19 | 67 | -30,93 | ||||
| 2026-02-17 | 13F | Advisor Group Holdings, Inc. | 51.410 | 70,71 | 450 | 77,87 | ||||
| 2026-03-04 | 13F | SHP Wealth Management | 150 | 1 | ||||||
| 2026-02-13 | 13F | SRS Capital Advisors, Inc. | 583 | -79,90 | 5 | -76,19 | ||||
| 2026-02-17 | 13F | Holocene Advisors, LP | 110.634 | 87,06 | 969 | 119,23 | ||||
| 2026-01-27 | 13F | Zurcher Kantonalbank (Zurich Cantonalbank) | 53.385 | -31,44 | 468 | -19,76 | ||||
| 2026-02-13 | 13F | Centaurus Financial, Inc. | 13.800 | 0 | ||||||
| 2026-02-17 | 13F | LaSalle St. Investment Advisors, LLC | 14.055 | 0 | ||||||
| 2026-04-20 | 13F | Sowell Financial Services LLC | 14.614 | 97 | ||||||
| 2026-02-12 | 13F | Scotia Capital Inc. | 16.309 | -28,54 | 143 | -16,47 | ||||
| 2026-02-13 | 13F | Morgan Stanley | 6.796.576 | 32,34 | 59.538 | 54,99 | ||||
| 2026-04-28 | 13F | Abel Hall, LLC | 0 | -100,00 | 0 | |||||
| 2025-11-10 | 13F | Kovitz Investment Group Partners, LLC | 0 | -100,00 | 0 | |||||
| 2026-02-13 | 13F | Pinnacle Wealth Planning Services, Inc. | 78 | 1 | ||||||
| 2026-04-10 | 13F | Daytona Street Capital LLC | 10.700 | 0,00 | 72 | -22,58 | ||||
| 2026-01-16 | 13F | FNY Investment Advisers, LLC | Call | 0 | -100,00 | 0 | ||||
| 2026-01-16 | 13F | FNY Investment Advisers, LLC | 0 | -100,00 | 0 | |||||
| 2025-11-07 | 13F | HighTower Advisors, LLC | Call | 0 | -100,00 | 0 | ||||
| 2026-02-13 | 13F | Segall Bryant & Hamill, Llc | 2.838.185 | -19,29 | 24.863 | -5,48 | ||||
| 2026-02-06 | 13F | Larson Financial Group LLC | 741 | -34,31 | 6 | -25,00 | ||||
| 2026-01-28 | 13F | CAPROCK Group, Inc. | 35.680 | 313 | ||||||
| 2026-04-24 | 13F | Retirement Systems of Alabama | 350.925 | 2,18 | 2.327 | -22,67 | ||||
| 2026-02-12 | 13F | Campbell & CO Investment Adviser LLC | 0 | -100,00 | 0 | |||||
| 2025-11-12 | 13F | Aster Capital Management (DIFC) Ltd | 0 | -100,00 | 0 | -100,00 | ||||
| 2026-04-22 | 13F | Pictet Asset Management Holding SA | 48.010 | 13,22 | 318 | -14,29 | ||||
| 2025-11-13 | 13F | C M Bidwell & Associates Ltd | 0 | -100,00 | 0 | |||||
| 2026-02-13 | 13F | Charles Schwab Investment Management Inc | 3.608.370 | -4,64 | 31.609 | 11,68 | ||||
| 2026-01-30 | 13F | Us Bancorp \de\ | 12.614 | 1,84 | 110 | 19,57 | ||||
| 2026-04-27 | 13F | Tsfg, Llc | 3.000 | 0,00 | 0 | |||||
| 2026-02-17 | 13F | Creative Planning | 74.857 | 41,39 | 656 | 65,40 | ||||
| 2025-11-19 | 13F | Caitong International Asset Management Co., Ltd | 0 | -100,00 | 0 | |||||
| 2026-04-20 | 13F | Ronald Blue Trust, Inc. | 539 | -72,96 | 4 | -82,35 | ||||
| 2026-04-28 | 13F | Southern Michigan Bank & Trust | 800 | 5 | ||||||
| 2026-02-13 | 13F | Wells Fargo & Company/mn | 619.267 | 22,22 | 5.425 | 43,15 | ||||
| 2026-02-06 | 13F | Covestor Ltd | 15 | 0,00 | 0 | |||||
| 2026-02-12 | 13F | Ironwood Investment Management Llc | 232.000 | 6,91 | 2.032 | 25,20 | ||||
| 2026-04-02 | 13F | Ares Financial Consulting, LLC | 215 | 0,00 | 1 | 0,00 | ||||
| 2026-02-11 | 13F | SOUTH STATE Corp | 0 | -100,00 | 0 | |||||
| 2026-04-20 | 13F | Davis Investment Partners, LLC | 0 | -100,00 | 0 | |||||
| 2026-04-23 | 13F | CWM Advisors, LLC | 91.168 | 35,98 | 604 | 2,90 | ||||
| 2026-04-30 | 13F | Hsbc Holdings Plc | 430.136 | 144,63 | 2.798 | 81,62 | ||||
| 2026-02-09 | 13F | Quest Partners LLC | 16.326 | -3,06 | 143 | 14,40 | ||||
| 2026-02-17 | 13F | Optiver Holding B.V. | 1.153 | -50,39 | 10 | -41,18 | ||||
| 2026-02-02 | 13F | Fifth Third Bancorp | 2.478 | -15,14 | 22 | 0,00 | ||||
| 2026-02-13 | 13F | Edgestream Partners, L.P. | 268.710 | 2.354 | ||||||
| 2026-04-21 | 13F | First United Bank Trust/ | 105 | 0,00 | 1 | |||||
| 2026-02-13 | 13F | State Street Corp | 10.450.140 | 0,35 | 91.543 | 17,53 | ||||
| 2026-02-11 | 13F | Flagship Wealth Advisors, Llc | 400 | 0,00 | 4 | 50,00 | ||||
| 2026-02-05 | 13F | Leuthold Group, Llc | 560.093 | 48,52 | 4.906 | 73,97 | ||||
| 2026-02-12 | 13F | Jane Street Group, Llc | 2.326.821 | 140,65 | 20.383 | 181,83 | ||||
| 2026-02-12 | 13F | Jane Street Group, Llc | Put | 1.005.200 | -3,54 | 8.806 | 12,97 | |||
| 2026-02-06 | 13F | Gsa Capital Partners Llp | 20.117 | 0 | ||||||
| 2026-02-12 | 13F | Jane Street Group, Llc | Call | 357.700 | 302,82 | 3.133 | 371,84 | |||
| 2026-02-17 | 13F | VARCOV Co. | 15.587 | 137 | ||||||
| 2026-02-09 | 13F | Keating Financial Advisory Services, Inc. | 110 | 1 | ||||||
| 2026-02-13 | 13F | Walleye Capital LLC | 0 | -100,00 | 0 | -100,00 | ||||
| 2026-02-17 | 13F | Susquehanna International Group, Llp | Call | 847.100 | 57,45 | 7.421 | 84,39 | |||
| 2026-02-17 | 13F | Susquehanna International Group, Llp | 732.203 | 21,92 | 6.414 | 42,79 | ||||
| 2026-02-17 | 13F | Susquehanna International Group, Llp | Put | 901.700 | -33,82 | 7.899 | -22,49 | |||
| 2026-02-04 | 13F | Securian Asset Management, Inc | 20.854 | -2,66 | 183 | 13,75 | ||||
| 2026-01-16 | 13F | Trust Co Of Vermont | 290 | 0,00 | 3 | 0,00 | ||||
| 2026-01-29 | 13F | McGowan Group Asset Management, Inc. | 26.060 | 228 | ||||||
| 2025-11-14 | 13F | Cubist Systematic Strategies, LLC | Call | 0 | -100,00 | 0 | ||||
| 2026-04-07 | 13F | CoreCap Advisors, LLC | 1.732 | 0,00 | 11 | -26,67 | ||||
| 2026-02-10 | 13F | Connor, Clark & Lunn Investment Management Ltd. | 81.912 | 718 | ||||||
| 2026-04-27 | 13F | PFG Investments, LLC | 22.790 | 151 | ||||||
| 2026-02-17 | 13F | Ancora Advisors, LLC | 1.400 | 0,00 | 12 | 20,00 | ||||
| 2026-02-17 | 13F | Lighthouse Investment Partners, LLC | 197.241 | 40,89 | 1.728 | 64,95 | ||||
| 2026-04-24 | 13F | ProShare Advisors LLC | 51.501 | -16,85 | 341 | -37,08 | ||||
| 2026-02-10 | 13F | Sivia Capital Partners, LLC | 11.172 | 98 | ||||||
| 2026-04-14 | 13F | West Branch Capital LLC | 329 | 0,00 | 2 | 0,00 | ||||
| 2026-02-13 | 13F | Umb Bank N A/mo | 1.336 | -38,74 | 12 | -31,25 | ||||
| 2026-02-06 | 13F | GPS Wealth Strategies Group, LLC | 0 | -100,00 | 0 | |||||
| 2026-02-10 | 13F | Rothschild Investment Llc | 932 | 288,33 | 8 | 700,00 | ||||
| 2025-11-14 | 13F | Cubist Systematic Strategies, LLC | Put | 0 | -100,00 | 0 | ||||
| 2026-04-28 | 13F | BW Gestao de Investimentos Ltda. | 218.470 | -18,11 | 1.448 | -38,04 | ||||
| 2026-04-29 | 13F | Hughes Financial Services, LLC | 1 | 0,00 | 0 | |||||
| 2025-11-17 | 13F | PharVision Advisers, LLC | 0 | -100,00 | 0 | |||||
| 2026-02-06 | 13F | Redmont Wealth Advisors Llc | 77.668 | 680 | ||||||
| 2026-02-06 | 13F | Lsv Asset Management | 4.838.364 | -0,95 | 42 | 16,67 | ||||
| 2026-02-17 | 13F | Alliancebernstein L.p. | 570.369 | 2,72 | 4.996 | 20,30 | ||||
| 2026-02-17 | 13F | Gallagher Fiduciary Advisors, LLC | 29.242 | 16,59 | 256 | 36,90 | ||||
| 2026-02-17 | 13F | Delaware Management Holdings, Inc. | 70.000 | 613 | ||||||
| 2026-02-13 | 13F | Quinn Opportunity Partners LLC | 924.540 | 15,00 | 8.099 | 34,67 | ||||
| 2026-04-30 | 13F | Nuveen, LLC | 870.961 | -51,34 | 5.774 | -63,17 | ||||
| 2026-04-28 | 13F | Golden State Wealth Management, LLC | 0 | -100,00 | 0 | |||||
| 2026-02-09 | 13F | Integrity Alliance, Llc. | 29.165 | 255 | ||||||
| 2026-02-17 | 13F | Bayesian Capital Management, LP | 11.200 | 98 | ||||||
| 2025-11-14 | 13F | Wolverine Trading, Llc | 242.382 | 309,96 | 1.818 | 187,05 | ||||
| 2025-11-14 | 13F | Wolverine Trading, Llc | Call | 209.500 | 6,02 | 1.571 | -25,83 | |||
| 2025-11-14 | 13F | Wolverine Trading, Llc | Put | 347.800 | 335,29 | 2.608 | 204,67 | |||
| 2026-02-17 | 13F | Gotham Asset Management, LLC | 32.652 | 286 | ||||||
| 2026-02-13 | 13F | Peak6 Llc | Put | 0 | -100,00 | 0 | ||||
| 2026-02-12 | 13F | Federation des caisses Desjardins du Quebec | 29.640 | 28,09 | 260 | 49,71 | ||||
| 2026-02-13 | 13F | Peak6 Llc | Call | 0 | -100,00 | 0 | ||||
| 2026-04-15 | 13F | Bayforest Capital Ltd | 43.480 | 155,93 | 288 | 94,59 | ||||
| 2026-02-12 | 13F | CIBC Private Wealth Group, LLC | 1.308 | 11 | ||||||
| 2026-02-13 | 13F | MAI Capital Management | 6.693 | 5,83 | 59 | 23,40 | ||||
| 2026-04-29 | 13F | WPG Advisers, LLC | 290 | 5,84 | 2 | -50,00 | ||||
| 2026-01-26 | 13F | Consolidated Investment Group LLC | 0 | -100,00 | 0 | -100,00 | ||||
| 2026-01-23 | 13F | Rsm Us Wealth Management Llc | 12.700 | -1,05 | 114 | 17,71 | ||||
| 2026-02-10 | 13F | Nomura Asset Management Co Ltd | 12.200 | 0,00 | 107 | 16,48 | ||||
| 2026-02-11 | 13F | Rise Advisors, LLC | 0 | -100,00 | 0 | |||||
| 2026-02-12 | 13F | Dimensional Fund Advisors Lp | 15.206.853 | 3,42 | 133.216 | 21,12 | ||||
| 2026-02-06 | 13F | VSM Wealth Advisory, LLC | 0 | -100,00 | 0 | |||||
| 2026-02-13 | 13F | Ontario Teachers Pension Plan Board | 133.479 | 1.169 | ||||||
| 2026-02-17 | 13F | Millennium Management Llc | 5.385.185 | 256,34 | 47.174 | 317,32 | ||||
| 2026-02-17 | 13F | Millennium Management Llc | Call | 500.000 | 0,00 | 4.380 | 17,11 | |||
| 2026-02-12 | 13F | ROSS\JOHNSON & Associates LLC | 19 | 0 | ||||||
| 2026-02-12 | 13F | Federated Hermes, Inc. | 110.973 | 18,61 | 972 | 39,06 | ||||
| 2026-02-17 | 13F | Millennium Management Llc | Put | 320.000 | -34,69 | 2.803 | -23,52 | |||
| 2026-04-30 | 13F | Private Trust Co Na | 7.063 | -2,43 | 47 | -26,98 | ||||
| 2026-02-17 | 13F | MIRAE ASSET GLOBAL ETFS HOLDINGS Ltd. | 128.200 | 5,61 | 1.123 | 23,68 | ||||
| 2026-04-30 | 13F | Cambridge Investment Research Advisors, Inc. | 23.829 | -32,89 | 0 | |||||
| 2026-01-22 | 13F | Massachusetts Financial Services Co /ma/ | 4.507.813 | 4,39 | 39.488 | 22,25 | ||||
| 2026-02-13 | 13F | Walleye Capital LLC | Call | 225.200 | 2.129,70 | 1.973 | 2.529,33 | |||
| 2026-02-24 | 13F | Anderson Financial Strategies, LLC | 185.180 | 5,12 | 1.622 | 23,16 | ||||
| 2026-02-11 | 13F | Meeder Asset Management Inc | 1.088 | 0,00 | 10 | 12,50 | ||||
| 2026-02-11 | 13F | Group One Trading, L.p. | Call | 399.200 | -1,19 | 3.497 | 15,72 | |||
| 2026-02-11 | 13F | Group One Trading, L.p. | Put | 411.700 | -22,60 | 3.606 | -9,35 | |||
| 2026-02-11 | 13F | Group One Trading, L.p. | 87.420 | -54,56 | 766 | -46,80 | ||||
| 2026-01-26 | 13F | Cwm, Llc | 33.921 | -32,64 | 0 | |||||
| 2025-11-14 | 13F | Algert Global Llc | 0 | -100,00 | 0 | |||||
| 2026-02-09 | 13F | IPG Investment Advisors LLC | 884.460 | -23,79 | 7.748 | -10,75 | ||||
| 2026-02-13 | 13F | Walleye Capital LLC | Put | 249.100 | 2.164,55 | 2.182 | 2.560,98 | |||
| 2026-02-11 | 13F | Brandywine Global Investment Management, LLC | 1.158.638 | -3,57 | 10.150 | 12,93 | ||||
| 2026-02-13 | 13F | Smartleaf Asset Management LLC | 1.209 | -33,50 | 11 | -23,08 | ||||
| 2026-04-27 | 13F | Leonteq Securities AG | 415.180 | 23,32 | 2.753 | -6,68 | ||||
| 2026-02-13 | 13F/A | Alberta Investment Management Corp | 0 | -100,00 | 0 | |||||
| 2026-04-23 | 13F | Sippican Capital Advisors | 335.785 | 6,22 | 2.226 | -19,61 | ||||
| 2026-02-17 | 13F | Quantinno Capital Management LP | 82.985 | 348,69 | 727 | 426,09 | ||||
| 2026-04-28 | 13F | Whittier Trust Co | 458 | 0,00 | 3 | -25,00 | ||||
| 2026-02-05 | 13F | Allworth Financial LP | 5.155 | -30,85 | 45 | -18,18 | ||||
| 2026-02-12 | 13F | Systematic Alpha Investments, LLC | 0 | -100,00 | 0 | -100,00 | ||||
| 2026-04-10 | 13F | AssuredPartners Investment Advisors, LLC | 0 | -100,00 | 0 | |||||
| 2026-02-17 | 13F | Ameriprise Financial Inc | 1.094.894 | -3,67 | 9.591 | 12,85 | ||||
| 2026-02-17 | 13F | XTX Topco Ltd | 117.181 | 31,40 | 1.027 | 53,82 | ||||
| 2026-04-14 | 13F | Thurston, Springer, Miller, Herd & Titak, Inc. | 2.000 | 0,00 | 13 | -23,53 | ||||
| 2026-02-13 | 13F | Inspire Advisors, LLC | 25.557 | 37,20 | 224 | 60,43 | ||||
| 2026-02-11 | 13F | Deseret Mutual Benefit Administrators | 2.562 | 0,00 | 22 | 15,79 | ||||
| 2026-02-17 | 13F | Aequim Alternative Investments LP | 30.000 | 0,00 | 263 | 16,96 | ||||
| 2026-02-11 | 13F | Deutsche Bank Ag\ | 244.259 | 2,79 | 2.140 | 20,37 | ||||
| 2026-02-05 | 13F | Gamco Investors, Inc. Et Al | 364.275 | 10,53 | 3.191 | 29,45 | ||||
| 2026-02-12 | 13F | Wealthspire Advisors, LLC | 0 | -100,00 | 0 | |||||
| 2026-02-17 | 13F | Magnetar Financial LLC | 0 | -100,00 | 0 | |||||
| 2026-02-13 | 13F | Centiva Capital, LP | Put | 149.300 | 140,42 | 1.308 | 181,68 | |||
| 2026-02-13 | 13F | Pathstone Holdings, LLC | 16.865 | -29,02 | 148 | -16,95 | ||||
| 2026-02-13 | 13F | Centiva Capital, LP | 62.100 | 544 | ||||||
| 2026-02-17 | 13F | SummitTX Capital, L.P. | 0 | -100,00 | 0 | -100,00 | ||||
| 2026-02-17 | 13F | Royal Bank Of Canada | Call | 50.000 | 0,00 | 438 | 17,11 | |||
| 2026-02-13 | 13F | Pin Oak Investment Advisors Inc | 75.055 | 1,44 | 1 | -100,00 | ||||
| 2026-02-17 | 13F | Royal Bank Of Canada | 283.309 | -37,97 | 2.482 | -27,34 | ||||
| 2025-11-07 | 13F | State of New Jersey Common Pension Fund D | 0 | -100,00 | 0 | |||||
| 2026-02-17 | 13F | Janus Henderson Group Plc | 121.841 | 0,00 | 1.067 | 17,01 | ||||
| 2026-02-11 | 13F | Prestige Wealth Management Group LLC | 61 | 0,00 | 1 | |||||
| 2026-02-17 | 13F | Petrus Trust Company, LTA | 0 | -100,00 | 0 | |||||
| 2025-11-21 | 13F | Nebula Research & Development LLC | 0 | -100,00 | 0 | -100,00 | ||||
| 2026-02-10 | 13F | Mutual Of America Capital Management Llc | 119.092 | -9,85 | 1.043 | 5,57 | ||||
| 2026-02-10 | 13F | Bnp Paribas | 400 | 0,00 | 4 | 50,00 | ||||
| 2026-04-07 | 13F | Signaturefd, Llc | 867 | -60,91 | 6 | -73,68 | ||||
| 2026-02-17 | 13F | Royal Bank Of Canada | Put | 250.000 | 0,00 | 2.190 | 17,11 | |||
| 2026-02-17 | 13F | Price T Rowe Associates Inc /md/ | 266.909 | 9,08 | 2 | 100,00 | ||||
| 2026-03-24 | 13F/A | Barclays Plc | Put | 0 | -100,00 | 0 | -100,00 | |||
| 2026-04-14 | 13F | Nbc Securities, Inc. | 100 | 0,00 | 1 | |||||
| 2026-01-29 | 13F | Vanguard Group Inc | 27.681.864 | -0,96 | 242.493 | 15,99 | ||||
| 2025-11-14 | 13F | Strategic Wealth Partners, Ltd. | 333 | 0,00 | 2 | -33,33 | ||||
| 2026-02-13 | 13F | Huber Capital Management LLC | 59.200 | -62,81 | 519 | -56,47 | ||||
| 2026-04-30 | 13F | Sequoia Financial Advisors, LLC | 18.332 | 24,12 | 122 | -6,20 | ||||
| 2026-02-05 | 13F | Elyxium Wealth, LLC | 387 | 3 | ||||||
| 2026-01-29 | 13F | IMC-Chicago, LLC | 130.251 | -58,93 | 1.141 | -51,94 | ||||
| 2026-02-13 | 13F | Rhumbline Advisers | 835.007 | -8,56 | 7.315 | 7,09 | ||||
| 2026-01-29 | 13F | IMC-Chicago, LLC | Put | 382.300 | -21,14 | 3.349 | -7,67 | |||
| 2026-01-29 | 13F | IMC-Chicago, LLC | Call | 443.300 | 85,95 | 3.883 | 117,78 | |||
| 2026-04-13 | 13F | IFP Advisors, Inc | 1.877 | 1,79 | 12 | -25,00 | ||||
| 2026-02-13 | 13F | Kilter Group LLC | 0 | -100,00 | 0 | |||||
| 2026-02-09 | 13F | Huntington National Bank | 0 | |||||||
| 2026-02-17 | 13F | Freestone Grove Partners LP | 0 | -100,00 | 0 | |||||
| 2026-02-17 | 13F | Wellington Management Group Llp | 28.047.790 | 6,32 | 245.699 | 24,51 | ||||
| 2026-02-10 | 13F | Foundations Investment Advisors, LLC | 18.732 | 41,92 | 164 | 67,35 | ||||
| 2026-02-13 | 13F | Ubs Asset Management Americas Inc | 931.552 | 67,22 | 8.160 | 95,87 | ||||
| 2026-04-17 | 13F | Cidel Asset Management Inc | 14.761 | 19,12 | 98 | -10,19 | ||||
| 2026-02-13 | 13F | Baird Financial Group, Inc. | 11.821 | 0,00 | 104 | 17,05 | ||||
| 2026-02-09 | 13F | GatePass Capital, LLC | 42.000 | 368 | ||||||
| 2026-02-13 | 13F | Colony Group, LLC | 0 | -100,00 | 0 | |||||
| 2026-02-17 | 13F | Schonfeld Strategic Advisors LLC | 100.777 | -81,44 | 883 | -78,29 | ||||
| 2026-02-17 | 13F | Maple Rock Capital Partners Inc. | 3.972.546 | -38,61 | 34.800 | -28,11 | ||||
| 2026-04-13 | 13F | St Germain D J Co Inc | 90 | 0,00 | 1 | |||||
| 2026-02-17 | 13F | State Of Wisconsin Investment Board | 348.407 | -27,91 | 3.052 | -15,57 | ||||
| 2026-04-29 | 13F | Police & Firemen's Retirement System of New Jersey | 76.334 | 6,12 | 506 | -19,68 | ||||
| 2026-04-23 | 13F | Fairway Wealth LLC | 0 | -100,00 | 0 | |||||
| 2026-02-17 | 13F | Capital Fund Management S.a. | 494.236 | 263,68 | 4.330 | 326,08 | ||||
| 2026-02-10 | 13F | Measured Wealth Private Client Group, LLC | 200 | 0,00 | 2 | 0,00 | ||||
| 2026-02-17 | 13F | Readystate Asset Management Lp | 1.787.762 | -4,48 | 15.661 | 11,87 | ||||
| 2026-02-17 | 13F | Siemens Fonds Invest GmbH | 20.532 | 51,89 | 184 | 81,19 | ||||
| 2026-02-17 | 13F | Shay Capital LLC | Call | 0 | -100,00 | 0 | -100,00 | |||
| 2026-02-06 | 13F | HighTower Advisors, LLC | 18.054 | -20,79 | 158 | -7,06 | ||||
| 2026-02-10 | 13F/A | Northwestern Mutual Wealth Management Co | 18.869 | 10,67 | 165 | 29,92 | ||||
| 2026-02-12 | 13F | Triumph Capital Management | 1.120 | 0,00 | 10 | 12,50 | ||||
| 2026-02-12 | 13F | Marex Group plc | 42.260 | 98,20 | 370 | 132,70 | ||||
| 2026-04-30 | 13F | LRI Investments, LLC | 133 | 0,00 | 1 | -100,00 | ||||
| 2026-04-13 | 13F | True Wealth Design, LLC | 3.229 | 68,97 | 21 | 31,25 | ||||
| 2026-02-09 | 13F | Legal & General Group Plc | 490.842 | -2,98 | 4.300 | 13,61 | ||||
| 2026-04-08 | 13F | NorthCrest Asset Manangement, LLC | 10.468 | -15,42 | 70 | -36,70 | ||||
| 2026-02-05 | 13F | Thrivent Financial For Lutherans | 137.521 | -10,07 | 1 | 0,00 | ||||
| 2026-02-10 | 13F | Bruce G. Allen Investments, LLC | 22 | -47,62 | 0 | |||||
| 2025-11-14 | 13F | Atlantic Investment Management Inc | 0 | -100,00 | 0 | |||||
| 2026-02-09 | 13F | Harbour Investments, Inc. | 1.668 | -20,00 | 15 | -6,67 |