Grundlæggende statistik
| Institutionelle ejere | 92 total, 92 long only, 0 short only, 0 long/short - change of -1,08% MRQ |
| Gennemsnitlig porteføljeallokering | 0.0345 % - change of -80,33% MRQ |
| Institutionelle aktier (lange) | 10.438.303 (ex 13D/G) - change of -7,41MM shares -41,53% MRQ |
| Institutionel værdi (lang) | $ 58.214 USD ($1000) |
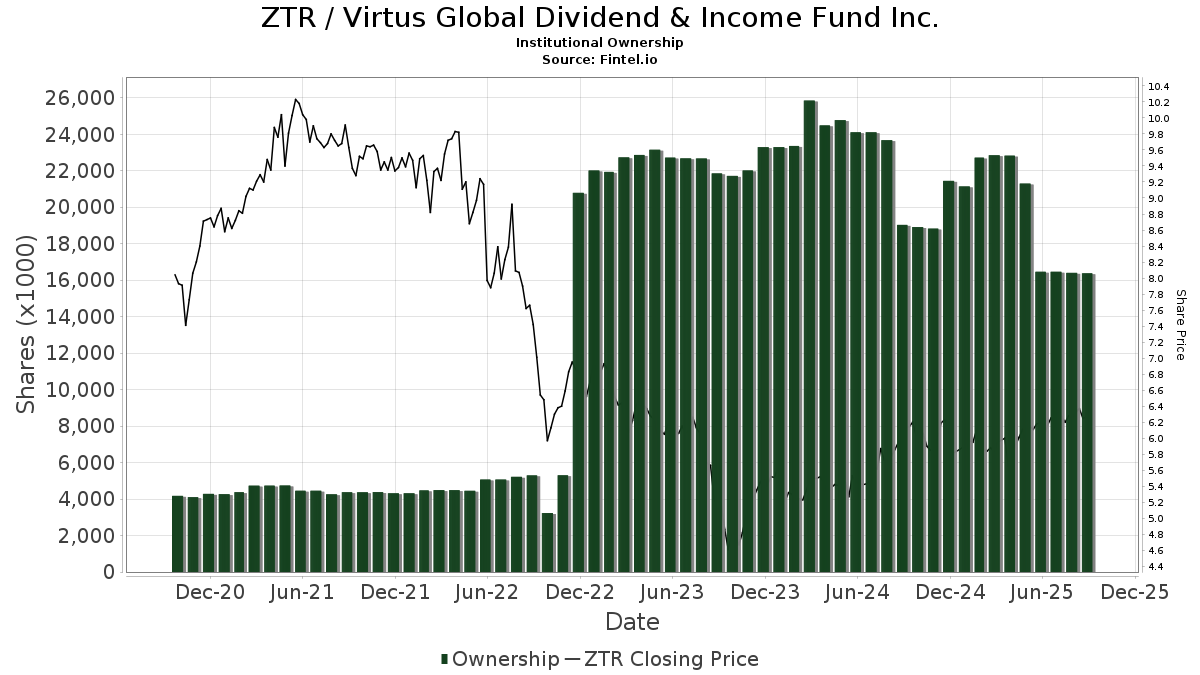
Institutionelt ejerskab og aktionærer
Virtus Global Dividend & Income Fund Inc. (US:ZTR) har 92 institutionelle ejere og aktionærer, der har indsendt 13D/G- eller 13F-formularer til Securities Exchange Commission (SEC). Disse institutioner har i alt 10,438,303 aktier. Største aktionærer omfatter LPL Financial LLC, Guggenheim Capital Llc, Penserra Capital Management LLC, Morgan Stanley, Absolute Investment Advisers Llc, Stifel Financial Corp, Capstone Investment Advisors, Llc, Private Advisor Group, LLC, Yakira Capital Management, Inc., and Quarry LP .
Virtus Global Dividend & Income Fund Inc. (NYSE:ZTR) institutionel ejerskabsstruktur viser aktuelle positioner i virksomheden efter institutioner og fonde, samt seneste ændringer i positionsstørrelse. Større aktionærer kan omfatte individuelle investorer, investeringsforeninger, hedgefonde eller institutioner. Skema 13D angiver, at investoren besidder (eller besidder) mere end 5 % af virksomheden og har til hensigt (eller har til hensigt at) aktivt at forfølge en ændring i forretningsstrategi. Skema 13G indikerer en passiv investering på over 5%.
The share price as of March 27, 2026 is 6,60 / share. Previously, on March 27, 2025, the share price was 5,93 / share. This represents an increase of 11,21% over that period.
Fondens stemningsscore
Fund Sentiment Score (fka Ownership Accumulation Score) finder de aktier, der bliver mest købt af fonde. Det er resultatet af en sofistikeret, multi-faktor kvantitativ model, der identificerer virksomheder med de højeste niveauer af institutionel akkumulering. Scoringsmodellen bruger en kombination af den samlede stigning i oplyste ejere, ændringerne i porteføljeallokeringer i disse ejere og andre målinger. Tallet går fra 0 til 100, hvor højere tal indikerer et højere niveau af akkumulering for sine jævnaldrende, og 50 er gennemsnittet.
Opdateringsfrekvens: Dagligt
Se Ownership Explorer, som giver en liste over højest rangerende virksomheder.
AI+ Ask Fintel’s AI assistant about Virtus Global Dividend & Income Fund Inc..
Select a question to share a public post with an AI-crafted answer.
Thinking of good questions…
Institutionel Put/Call-forhold
Ud over at indberette standardaktie- og gældsudstedelser skal institutter med mere end 100 mill. aktiver under forvaltning også oplyse deres put- og call-optionsbeholdninger. Da salgsoptioner generelt indikerer negativ stemning, og købsoptioner indikerer positiv stemning, kan vi få en fornemmelse af den overordnede institutionelle stemning ved at plotte forholdet mellem put og kald. Diagrammet til højre viser det historiske put/call-forhold for dette instrument.
Brug af Put/Call Ratio som en indikator for investorernes stemning overvinder en af de vigtigste mangler ved at bruge totalt institutionelt ejerskab, som er, at en betydelig mængde af aktiver under forvaltning investeres passivt for at spore indekser. Passivt forvaltede fonde køber typisk ikke optioner, så indikatoren for put/call-forholdet følger mere nøje følelsen af aktivt forvaltede fonde.
13F og NPORT arkivering
Detaljer om 13F-arkivering er gratis. Detaljer om NP-ansøgninger kræver et premium-medlemskab. Grønne rækker angiver nye positioner. Røde rækker angiver lukkede positioner. Klik på linket ikon for at se den fulde transaktionshistorik.
Opgrader
for at låse premium-data op og eksportere til Excel ![]() .
.
| Fil dato | Kilde | Investor | Type | Gennemsnitlig pris (Øst) |
Aktier | Δ Aktier (%) |
Rapporteret Værdi ($1000) |
Δ Værdi (%) |
Port Alloc (%) |
|
|---|---|---|---|---|---|---|---|---|---|---|
| 2026-01-08 | 13F | Integrated Capital Management, Inc. | 43.477 | 9,26 | 274 | 6,64 | ||||
| 2026-02-17 | 13F | Advisor Group Holdings, Inc. | 71.428 | 6,93 | 450 | 5,14 | ||||
| 2026-01-21 | 13F | Newbridge Financial Services Group, Inc. | 0 | -100,00 | 0 | |||||
| 2026-01-27 | 13F | First Horizon Corp | 0 | -100,00 | 0 | |||||
| 2026-01-06 | 13F | Doliver Advisors, Lp | 12.250 | -0,14 | 77 | -2,53 | ||||
| 2026-02-04 | 13F | Mascoma Wealth Management LLC | 11.900 | 0,00 | 75 | -2,63 | ||||
| 2026-02-13 | 13F | Stifel Financial Corp | 672.991 | -33,72 | 4.240 | -35,26 | ||||
| 2026-01-26 | 13F | JNBA Financial Advisors | 38 | -36,67 | 0 | |||||
| 2026-01-28 | 13F | Absolute Investment Advisers Llc | 686.219 | -18,78 | 4.313 | -20,87 | ||||
| 2026-02-04 | 13F | Beverly Hills Private Wealth, LLC | 83.446 | 0,00 | 538 | 0,00 | ||||
| 2025-11-14 | 13F | Almitas Capital LLC | 0 | -100,00 | 0 | |||||
| 2025-11-14 | 13F | Walleye Capital LLC | 0 | -100,00 | 0 | |||||
| 2026-02-10 | 13F | Envestnet Asset Management Inc | 244.527 | -1,17 | 1.541 | -3,45 | ||||
| 2026-02-17 | 13F | Oxford Asset Management Llp | 65.945 | 415 | ||||||
| 2026-02-17 | 13F | Royal Bank Of Canada | 56.031 | 11,14 | 353 | 8,62 | ||||
| 2026-01-29 | 13F | Concurrent Investment Advisors, LLC | 12.050 | -0,35 | 76 | -2,60 | ||||
| 2026-01-14 | 13F | Shulman DeMeo Asset Management LLC | 18.912 | -0,47 | 119 | -2,46 | ||||
| 2026-01-05 | 13F | Park Avenue Securities Llc | 216.213 | -1,06 | 1 | 0,00 | ||||
| 2026-02-17 | 13F | Cetera Investment Advisers | 44.514 | -4,72 | 280 | -6,98 | ||||
| 2026-02-13 | 13F | Mml Investors Services, Llc | 25.323 | 9,52 | 160 | 6,71 | ||||
| 2026-02-17 | 13F | Citadel Advisors Llc | 10.750 | 68 | ||||||
| 2026-02-17 | 13F | Bank Of America Corp /de/ | 245.239 | -14,79 | 1.545 | -16,76 | ||||
| 2026-02-17 | 13F | Creative Planning | 24.208 | 153 | ||||||
| 2026-02-11 | 13F | Janney Montgomery Scott LLC | 11.099 | 0,00 | 0 | |||||
| 2026-02-17 | 13F | Guggenheim Capital Llc | 1.246.096 | 2,01 | 7.850 | -0,36 | ||||
| 2026-01-26 | 13F | Cwm, Llc | 7.582 | 854,91 | 0 | |||||
| 2026-02-02 | 13F | Ashton Thomas Securities, Llc | 113.500 | 3,65 | 715 | 6,08 | ||||
| 2026-02-09 | 13F | MTM Investment Management, LLC | 124 | 0,00 | 1 | |||||
| 2025-10-23 | 13F | Spire Wealth Management | 0 | -100,00 | 0 | |||||
| 2026-02-06 | 13F | HighTower Advisors, LLC | 10.338 | -64,99 | 65 | -65,79 | ||||
| 2025-11-14 | 13F | Capstone Investment Advisors, Llc | 590.007 | 0,00 | 3.806 | 3,54 | ||||
| 2026-02-17 | 13F | Css Llc/il | 79.387 | -68,49 | 500 | -69,23 | ||||
| 2026-01-13 | 13F | CoreCap Advisors, LLC | 12.705 | 6,99 | 80 | 5,26 | ||||
| 2026-02-02 | 13F | Wolverine Asset Management Llc | 85.717 | -67,18 | 540 | -67,93 | ||||
| 2026-02-13 | 13F | Morgan Stanley | 695.521 | -48,81 | 4.382 | -50,01 | ||||
| 2026-01-08 | 13F | Gridiron Partners, LLC | 12.282 | -99,15 | 77 | -35,83 | ||||
| 2026-02-13 | 13F | Karpus Management, Inc. | 0 | -100,00 | 0 | |||||
| 2025-11-14 | 13F | Mangrove Partners | 0 | -100,00 | 0 | |||||
| 2026-02-13 | 13F | Citigroup Inc | 1 | 0,00 | 0 | |||||
| 2026-01-28 | 13F | Geneos Wealth Management Inc. | 1.145 | 0,00 | 7 | 0,00 | ||||
| 2026-02-13 | 13F | Kilter Group LLC | 1.966 | -8,43 | 12 | -7,69 | ||||
| 2026-02-11 | 13F | Cedar Mountain Advisors, LLC | 125 | 1 | ||||||
| 2026-02-13 | 13F | Wells Fargo & Company/mn | 138.949 | 0,40 | 875 | -1,91 | ||||
| 2026-02-17 | 13F | Ancora Advisors, LLC | 78 | 0,00 | 0 | |||||
| 2025-11-10 | 13F | Colonial Trust Advisors | 0 | -100,00 | 0 | -100,00 | ||||
| 2026-01-15 | 13F | Highline Wealth Partners Llc | 314 | 2 | ||||||
| 2026-02-17 | 13F | National Asset Management, Inc. | 10.064 | 63 | ||||||
| 2026-02-12 | 13F | Hrt Financial Lp | 10.033 | 0 | ||||||
| 2026-02-04 | 13F | Ameritas Advisory Services, LLC | 13.382 | -25,16 | 84 | -26,96 | ||||
| 2026-01-30 | 13F | Us Bancorp \de\ | 2.243 | 0,00 | 14 | 0,00 | ||||
| 2026-02-13 | 13F | Kestra Advisory Services, LLC | 0 | -100,00 | 0 | |||||
| 2026-01-21 | 13F | SJS Investment Consulting Inc. | 154 | 0,00 | 1 | |||||
| 2026-02-17 | 13F | Two Sigma Securities, Llc | 12.399 | 78 | ||||||
| 2025-11-14 | 13F | Millennium Management Llc | 0 | -100,00 | 0 | |||||
| 2026-02-02 | 13F | AlphaStar Capital Management, LLC | 17.402 | 0,00 | 110 | -2,68 | ||||
| 2026-01-26 | 13F | Old Point Trust & Financial Services N A | 8.000 | 0,00 | 50 | -1,96 | ||||
| 2026-01-29 | 13F | UBS Group AG | 5.847 | -28,80 | 37 | -30,77 | ||||
| 2026-02-12 | 13F | CF Capital LLC | 222.186 | -81,44 | 1.400 | -81,88 | ||||
| 2026-02-17 | 13F | Advisory Services Network, LLC | 0 | -100,00 | 0 | |||||
| 2026-02-12 | 13F | Penserra Capital Management LLC | 922.683 | 10,20 | 6 | 0,00 | ||||
| 2026-02-05 | 13F | Stephens Inc /ar/ | 115.879 | -26,95 | 730 | -28,64 | ||||
| 2026-02-11 | 13F | J.w. Cole Advisors, Inc. | 107.071 | -3,86 | 668 | -6,96 | ||||
| 2026-02-13 | 13F | Quarry LP | 265.646 | -19,90 | 1.674 | -21,79 | ||||
| 2026-02-17 | 13F | Fmr Llc | 1 | -80,00 | 0 | |||||
| 2026-02-13 | 13F | MAI Capital Management | 1 | 0 | ||||||
| 2025-10-06 | 13F | NWF Advisory Services Inc. | 10.439 | 0,00 | 65 | 14,29 | ||||
| 2026-02-09 | 13F | Blue Bell Private Wealth Management, Llc | 68.391 | -25,88 | 431 | -27,73 | ||||
| 2026-02-17 | 13F | Private Advisor Group, LLC | 337.575 | 14,61 | 2.127 | 11,95 | ||||
| 2026-01-07 | 13F | Aventura Private Wealth, LLC | 902 | 0,00 | 6 | 0,00 | ||||
| 2026-02-13 | 13F | Thomas J. Herzfeld Advisors, Inc. | 447 | -35,40 | 3 | -50,00 | ||||
| 2026-01-21 | 13F | Sound Income Strategies, LLC | 945 | 0,00 | 6 | -16,67 | ||||
| 2026-02-12 | 13F | Jane Street Group, Llc | 69.313 | 130,56 | 437 | 125,91 | ||||
| 2026-02-12 | 13F | CIBC Private Wealth Group, LLC | 0 | -100,00 | 0 | |||||
| 2026-02-19 | 13F | Invesco Ltd. | 124.894 | -9,74 | 787 | -11,88 | ||||
| 2026-02-13 | 13F | Yakira Capital Management, Inc. | 281.673 | -58,74 | 1.775 | -59,71 | ||||
| 2026-02-17 | 13F | Alpine Global Management, LLC | 108.211 | -82,82 | 682 | -83,24 | ||||
| 2026-01-13 | 13F | Dakota Wealth Management | 17.053 | -39,82 | 107 | -41,21 | ||||
| 2026-01-07 | 13F | Hilltop National Bank | 280 | -37,08 | 2 | -50,00 | ||||
| 2026-02-11 | 13F | LPL Financial LLC | 1.434.012 | 0,03 | 9.034 | -2,29 | ||||
| 2025-10-24 | 13F | MorganRosel Wealth Management, LLC | 0 | -100,00 | 0 | |||||
| 2026-02-13 | 13F | Mariner, LLC | 13.956 | -7,44 | 88 | -10,31 | ||||
| 2025-11-14 | 13F | Susquehanna International Group, Llp | 0 | -100,00 | 0 | |||||
| 2026-02-17 | 13F | Raymond James Financial Inc | 89.078 | -29,11 | 561 | -30,74 | ||||
| 2026-02-13 | 13F | Bulldog Investors, LLP | 0 | -100,00 | 0 | |||||
| 2026-02-24 | 13F | Chelsea Counsel Co | 65 | -36,89 | 0 | |||||
| 2026-02-11 | 13F | Closed-End Fund Advisors, Inc. | 10.522 | 66 | ||||||
| 2026-01-26 | 13F | Shaker Financial Services, LLC | 19.241 | -72,68 | 121 | -73,35 | ||||
| 2026-02-09 | 13F | Key FInancial Inc | 71 | 0,00 | 0 | |||||
| 2026-01-29 | 13F | UMA Financial Services, Inc. | 222 | 0,00 | 1 | 0,00 | ||||
| 2026-02-10 | 13F | Pasadena Private Wealth, LLC | 12.303 | -14,73 | 78 | -17,20 | ||||
| 2026-02-12 | 13F | Wedbush Securities Inc | 17.266 | -3,60 | 0 | |||||
| 2026-02-10 | 13F/A | Northwestern Mutual Wealth Management Co | 519 | 3 | ||||||
| 2026-02-05 | 13F | Cambridge Investment Research Advisors, Inc. | 20.726 | 0,01 | 0 | |||||
| 2026-01-23 | 13F | Westside Investment Management, Inc. | 62 | 0 | ||||||
| 2026-02-13 | 13F | Sculptor Capital LP | 217.653 | -37,25 | 1.371 | -38,71 | ||||
| 2026-02-17 | 13F | Decision Investments, Inc | 16.100 | 101 | ||||||
| 2026-02-10 | 13F | Rothschild Investment Llc | 145 | 0,00 | 1 | |||||
| 2026-02-13 | 13F | Glen Eagle Advisors, LLC | 406 | 0,00 | 3 | 0,00 | ||||
| 2026-02-12 | 13F | Wealthspire Advisors, LLC | 0 | -100,00 | 0 | |||||
| 2026-03-05 | 13F | Bayban | 10.339 | 65 | ||||||
| 2026-01-20 | 13F | Stratos Wealth Advisors, LLC | 24.747 | 2,35 | 156 | 0,00 | ||||
| 2026-01-29 | 13F | Nbc Securities, Inc. | 2.821 | -36,79 | 18 | -39,29 | ||||
| 2026-02-06 | 13F | Pnc Financial Services Group, Inc. | 20.428 | -33,76 | 129 | -35,35 | ||||
| 2026-01-09 | 13F | Tactive Advisors, LLC | 13.895 | -37,34 | 88 | -39,16 | ||||
| 2026-02-12 | 13F | Advisors Asset Management, Inc. | 130.444 | 822 | ||||||
| 2026-02-12 | 13F | Commonwealth Equity Services, Llc | 42.034 | -14,48 | 265 | |||||
| 2026-02-17 | 13F | Saba Capital Management, L.P. | 0 | -100,00 | 0 | |||||
| 2026-02-17 | 13F | Nomura Holdings Inc | 0 | -100,00 | 0 | |||||
| 2026-02-11 | 13F | Avise Financial Cooperative, Inc. | 26.864 | 169 | ||||||
| 2026-02-17 | 13F | Readystate Asset Management Lp | 28.873 | 7,99 | 182 | 5,23 |