Grundlæggende statistik
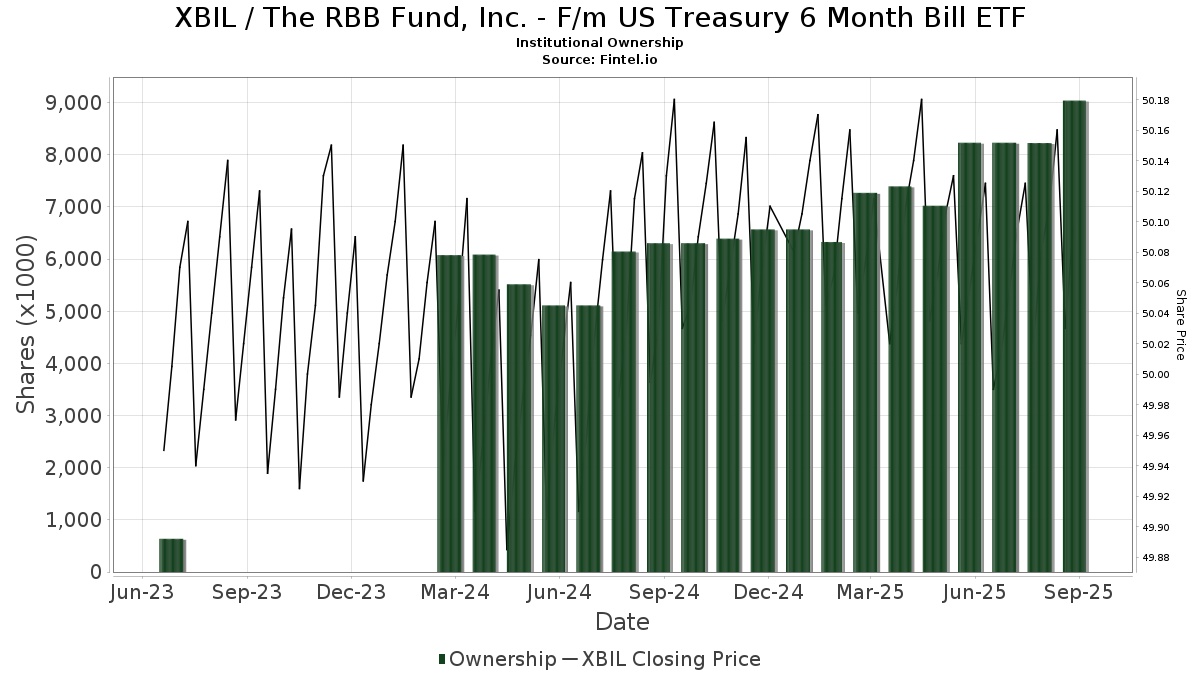
| Institutionelle ejere | 92 total, 92 long only, 0 short only, 0 long/short - change of 1,09% MRQ |
| Gennemsnitlig porteføljeallokering | 0.1741 % - change of -42,83% MRQ |
| Institutionelle aktier (lange) | 7.755.024 (ex 13D/G) - change of -1,37MM shares -15,03% MRQ |
| Institutionel værdi (lang) | $ 386.652 USD ($1000) |
Institutionelt ejerskab og aktionærer
The RBB Fund, Inc. - F/m US Treasury 6 Month Bill ETF (US:XBIL) har 92 institutionelle ejere og aktionærer, der har indsendt 13D/G- eller 13F-formularer til Securities Exchange Commission (SEC). Disse institutioner har i alt 7,755,024 aktier. Største aktionærer omfatter LPL Financial LLC, Acorn Financial Advisory Services Inc /adv, UBS Group AG, Cetera Investment Advisers, Stifel Financial Corp, Raymond James Financial Inc, Mml Investors Services, Llc, IHT Wealth Management, LLC, Commonwealth Equity Services, Llc, and Moors & Cabot, Inc. .
The RBB Fund, Inc. - F/m US Treasury 6 Month Bill ETF (NasdaqGM:XBIL) institutionel ejerskabsstruktur viser aktuelle positioner i virksomheden efter institutioner og fonde, samt seneste ændringer i positionsstørrelse. Større aktionærer kan omfatte individuelle investorer, investeringsforeninger, hedgefonde eller institutioner. Skema 13D angiver, at investoren besidder (eller besidder) mere end 5 % af virksomheden og har til hensigt (eller har til hensigt at) aktivt at forfølge en ændring i forretningsstrategi. Skema 13G indikerer en passiv investering på over 5%.
The share price as of March 6, 2026 is 50,08 / share. Previously, on March 7, 2025, the share price was 50,06 / share. This represents an increase of 0,03% over that period.
Fondens stemningsscore
Fund Sentiment Score (fka Ownership Accumulation Score) finder de aktier, der bliver mest købt af fonde. Det er resultatet af en sofistikeret, multi-faktor kvantitativ model, der identificerer virksomheder med de højeste niveauer af institutionel akkumulering. Scoringsmodellen bruger en kombination af den samlede stigning i oplyste ejere, ændringerne i porteføljeallokeringer i disse ejere og andre målinger. Tallet går fra 0 til 100, hvor højere tal indikerer et højere niveau af akkumulering for sine jævnaldrende, og 50 er gennemsnittet.
Opdateringsfrekvens: Dagligt
Se Ownership Explorer, som giver en liste over højest rangerende virksomheder.
AI+ Ask Fintel’s AI assistant about The RBB Fund, Inc. - F/m US Treasury 6 Month Bill ETF.
Select a question to share a public post with an AI-crafted answer.
Thinking of good questions…
Institutionel Put/Call-forhold
Ud over at indberette standardaktie- og gældsudstedelser skal institutter med mere end 100 mill. aktiver under forvaltning også oplyse deres put- og call-optionsbeholdninger. Da salgsoptioner generelt indikerer negativ stemning, og købsoptioner indikerer positiv stemning, kan vi få en fornemmelse af den overordnede institutionelle stemning ved at plotte forholdet mellem put og kald. Diagrammet til højre viser det historiske put/call-forhold for dette instrument.
Brug af Put/Call Ratio som en indikator for investorernes stemning overvinder en af de vigtigste mangler ved at bruge totalt institutionelt ejerskab, som er, at en betydelig mængde af aktiver under forvaltning investeres passivt for at spore indekser. Passivt forvaltede fonde køber typisk ikke optioner, så indikatoren for put/call-forholdet følger mere nøje følelsen af aktivt forvaltede fonde.
13F og NPORT arkivering
Detaljer om 13F-arkivering er gratis. Detaljer om NP-ansøgninger kræver et premium-medlemskab. Grønne rækker angiver nye positioner. Røde rækker angiver lukkede positioner. Klik på linket ikon for at se den fulde transaktionshistorik.
Opgrader
for at låse premium-data op og eksportere til Excel ![]() .
.
| Fil dato | Kilde | Investor | Type | Gennemsnitlig pris (Øst) |
Aktier | Δ Aktier (%) |
Rapporteret Værdi ($1000) |
Δ Værdi (%) |
Port Alloc (%) |
|
|---|---|---|---|---|---|---|---|---|---|---|
| 2026-02-12 | 13F | Commonwealth Equity Services, Llc | 185.326 | -9,22 | 9.279 | 92.690,00 | ||||
| 2026-02-11 | 13F | Jessup Wealth Management, Inc | 120 | 6 | ||||||
| 2026-02-13 | 13F | Gts Securities Llc | 50.741 | 2.541 | ||||||
| 2026-02-13 | 13F | Sofos Investments, Inc. | 5 | -86,11 | 0 | -100,00 | ||||
| 2026-02-04 | 13F | Pensionmark Financial Group, Llc | 27.510 | 93,79 | 712 | -0,14 | ||||
| 2026-02-12 | 13F | Manchester Financial Inc | 18.495 | -8,14 | 926 | -8,32 | ||||
| 2026-01-29 | 13F | D.a. Davidson & Co. | 0 | -100,00 | 0 | |||||
| 2026-01-28 | 13F | Geneos Wealth Management Inc. | 5.664 | 0,00 | 284 | -0,35 | ||||
| 2026-01-21 | 13F | Newbridge Financial Services Group, Inc. | 0 | -100,00 | 0 | |||||
| 2026-02-09 | 13F | Kingsview Wealth Management, LLC | 4.104 | -8,60 | 205 | -8,89 | ||||
| 2026-01-14 | 13F | Global View Capital Management LLC | 16.103 | -3,03 | 806 | -3,24 | ||||
| 2026-02-03 | 13F | We Are One Seven, LLC | 5.829 | 292 | ||||||
| 2026-02-06 | 13F | Portland Financial Advisors Inc | 5.869 | 2,07 | 294 | 1,74 | ||||
| 2026-02-12 | 13F | Hrt Financial Lp | 4.206 | 0 | ||||||
| 2026-02-17 | 13F | IHT Wealth Management, LLC | 232.293 | -1,99 | 11.631 | -2,24 | ||||
| 2026-02-12 | 13F | Principal Securities, Inc. | 0 | -100,00 | 0 | |||||
| 2026-02-11 | 13F | LPL Financial LLC | 2.270.496 | -0,71 | 113.684 | -0,96 | ||||
| 2025-11-14 | 13F | Susquehanna International Group, Llp | 0 | -100,00 | 0 | |||||
| 2026-01-08 | 13F | Wealth Enhancement Advisory Services, Llc | 172.349 | 20,84 | 8.634 | 20,89 | ||||
| 2026-02-17 | 13F/A | Kovack Advisors, Inc. | 4.723 | 236 | ||||||
| 2026-02-13 | 13F | Mariner, LLC | 11.845 | 73,71 | 593 | 73,39 | ||||
| 2026-02-18 | 13F | GWM Advisors LLC | 332 | 17 | ||||||
| 2026-02-02 | 13F | Benjamin Edwards Inc | 63.097 | -2,93 | 3.159 | -3,16 | ||||
| 2025-11-06 | 13F | Financial Advocates Investment Management | 0 | -100,00 | 0 | |||||
| 2026-02-05 | 13F | Stephens Inc /ar/ | 5.522 | 0,00 | 276 | -0,36 | ||||
| 2026-02-12 | 13F | Steward Partners Investment Advisory, Llc | 5.994 | 1,25 | 300 | 1,01 | ||||
| 2026-02-03 | 13F | Acorn Financial Advisory Services Inc /adv | 556.358 | -52,99 | 27.857 | -53,11 | ||||
| 2026-02-12 | 13F | Great Valley Advisor Group, Inc. | 11.992 | 20,04 | 600 | 19,76 | ||||
| 2026-01-12 | 13F | Sax Wealth Advisors, Llc | 12.631 | -26,00 | 632 | -26,17 | ||||
| 2026-02-06 | 13F | Copia Wealth Management | 68.974 | -20,28 | 3.454 | -20,47 | ||||
| 2026-01-20 | 13F | Coastal Investment Advisors, Inc. | 0 | -100,00 | 0 | -100,00 | ||||
| 2026-02-13 | 13F | Retirement Capital Strategies | 66.454 | -19,23 | 3.327 | -19,42 | ||||
| 2025-11-14 | 13F | Ausdal Financial Partners, Inc. | 0 | -100,00 | 0 | -100,00 | ||||
| 2026-02-03 | 13F | International Assets Investment Management, Llc | 15.440 | -20,88 | 773 | -20,72 | ||||
| 2026-02-17 | 13F | Mpwm Advisory Solutions, Llc | 0 | -100,00 | 0 | |||||
| 2026-02-02 | 13F | KPP Advisory Services LLC | 14.580 | -0,95 | 730 | -1,08 | ||||
| 2026-02-11 | 13F | Janney Montgomery Scott LLC | 8.712 | 0,00 | 0 | |||||
| 2026-02-10 | 13F | Moors & Cabot, Inc. | 173.659 | 0,07 | 8.695 | -0,17 | ||||
| 2026-02-17 | 13F | Strive Financial Group ,LLC | 0 | 0 | ||||||
| 2026-01-14 | 13F | Wealthcare Advisory Partners LLC | 40.704 | 1,88 | 2.038 | 1,65 | ||||
| 2026-02-02 | 13F | Truist Financial Corp | 29.992 | 70,16 | 1.502 | 69,80 | ||||
| 2026-02-02 | 13F | Verus Financial Partners, Inc. | 4.100 | 0,00 | 206 | 0,00 | ||||
| 2026-01-22 | 13F | Curran Financial Partners, LLC | 23.116 | 12,60 | 1.157 | 12,33 | ||||
| 2026-02-13 | 13F | Morgan Stanley | 140.972 | 256,00 | 7.059 | 255,21 | ||||
| 2026-02-04 | 13F | Money Concepts Capital Corp | 16.640 | 0,00 | 833 | -0,24 | ||||
| 2026-02-10 | 13F | Envestnet Asset Management Inc | 96.607 | -5,70 | 4.837 | -5,93 | ||||
| 2026-01-29 | 13F | Nbc Securities, Inc. | 500 | 0,00 | 25 | 0,00 | ||||
| 2026-02-17 | 13F | Ibex Wealth Advisors | 0 | -100,00 | 0 | |||||
| 2026-01-07 | 13F | Harbor Investment Advisory, Llc | 27.932 | 85,95 | 1.399 | 85,66 | ||||
| 2026-01-15 | 13F | Alpine Bank Wealth Management | 93.065 | 133,54 | 4.660 | 132,95 | ||||
| 2026-01-29 | 13F | UBS Group AG | 542.420 | -14,10 | 27.159 | -14,31 | ||||
| 2026-02-13 | 13F | Mml Investors Services, Llc | 264.714 | -6,26 | 13.254 | -6,50 | ||||
| 2026-02-13 | 13F | Integrity Financial Corp /WA | 500 | 0,00 | 25 | 0,00 | ||||
| 2026-01-28 | 13F | Lebenthal Global Advisors, LLC | 18.036 | 903 | ||||||
| 2026-02-17 | 13F | Citadel Advisors Llc | 16.172 | 810 | ||||||
| 2025-11-12 | 13F | Gentry Private Wealth, Llc | 0 | -100,00 | 0 | |||||
| 2026-02-09 | 13F | Prospera Financial Services Inc | 48.195 | -14,26 | 2.413 | -14,46 | ||||
| 2026-02-17 | 13F | Tower Research Capital LLC (TRC) | 50.489 | -33,46 | 2.528 | -33,64 | ||||
| 2026-02-02 | 13F | Sun Financial Inc | 10.777 | 540 | ||||||
| 2026-02-10 | 13F | Marshall & Sterling Wealth Advisors Inc. | 13.886 | 1,25 | 695 | 1,02 | ||||
| 2026-02-17 | 13F | Cetera Investment Advisers | 443.672 | 86,19 | 22.215 | 85,74 | ||||
| 2026-01-20 | 13F | Revolve Wealth Partners, LLC | 4.734 | -39,21 | 237 | -39,23 | ||||
| 2026-01-28 | 13F | Milestone Asset Management, Llc | 16.529 | 3,97 | 828 | 3,63 | ||||
| 2026-02-11 | 13F | Gateway Wealth Partners, LLC | 30.610 | -7,03 | 1.533 | -7,26 | ||||
| 2026-02-17 | 13F | Private Advisor Group, LLC | 34.382 | -50,57 | 1.721 | -50,70 | ||||
| 2026-02-13 | 13F | Pitcairn Wealth Advisors LLC | 12.456 | 624 | ||||||
| 2026-01-05 | 13F | GoalVest Advisory LLC | 0 | -100,00 | 0 | |||||
| 2026-01-26 | 13F | David Kennon Inc | 9.813 | 4,92 | 491 | 4,69 | ||||
| 2026-01-14 | 13F | Moisand Fitzgerald Tamayo, LLC | 534 | 27 | ||||||
| 2026-02-17 | 13F | Raymond James Financial Inc | 380.074 | -1,53 | 19.030 | -1,77 | ||||
| 2026-02-24 | 13F | Lynch Investment Planning, LLC | 6.932 | 347 | ||||||
| 2026-01-29 | 13F | Comerica Bank | 5.800 | 93,33 | 290 | 93,33 | ||||
| 2026-02-03 | 13F | F/M Investments LLC | 146.740 | -0,98 | 7.347 | -1,22 | ||||
| 2026-02-04 | 13F | 49 Wealth Management, Llc | 53.318 | -56,23 | 2.670 | -56,35 | ||||
| 2026-02-13 | 13F | Denver Wealth Management, Inc. | 24.181 | -63,31 | 1.211 | -63,42 | ||||
| 2026-02-05 | 13F | Cambridge Investment Research Advisors, Inc. | 5.873 | 31,09 | 0 | |||||
| 2025-10-24 | 13F | Heck Capital Advisors, LLC | 0 | -100,00 | 0 | |||||
| 2026-01-20 | 13F | Stratos Wealth Partners, LTD. | 12.085 | -62,63 | 605 | -62,72 | ||||
| 2026-01-27 | 13F | Sterling Group Wealth Management, LLC | 35.021 | -11,79 | 1.754 | -12,00 | ||||
| 2026-02-17 | 13F | Advisor Group Holdings, Inc. | 700 | 100,00 | 35 | 105,88 | ||||
| 2026-02-17 | 13F | Snowden Capital Advisors LLC | 8.205 | 56,35 | 411 | 55,89 | ||||
| 2026-02-12 | 13F | Bank Of Montreal /can/ | 100 | 5 | ||||||
| 2026-02-17 | 13F | Fmr Llc | 0 | -100,00 | 0 | |||||
| 2026-02-06 | 13F | Envestnet Portfolio Solutions, Inc. | 4.933 | -15,82 | 247 | -16,33 | ||||
| 2026-02-13 | 13F | Resources Investment Advisors, LLC. | 4.541 | 0,51 | 227 | 0,44 | ||||
| 2026-01-22 | 13F | Networth Advisors, LLC | 512 | 26 | ||||||
| 2026-01-26 | 13F | Private Trust Co Na | 10.997 | 0,00 | 551 | -0,18 | ||||
| 2026-02-12 | 13F | Founders Financial Alliance, LLC | 40.243 | -2,42 | 2.015 | -2,71 | ||||
| 2026-02-13 | 13F | Stifel Financial Corp | 387.682 | -52,86 | 19.411 | -52,98 | ||||
| 2026-02-17 | 13F | Royal Bank Of Canada | 0 | -100,00 | 0 | |||||
| 2026-01-27 | 13F | Belpointe Asset Management LLC | 20.299 | 7,77 | 1.016 | 7,51 | ||||
| 2026-02-13 | 13F | B & T Capital Management DBA Alpha Capital Management | 6.710 | -35,73 | 336 | -36,07 | ||||
| 2026-02-06 | 13F | Global Retirement Partners, LLC | 4.957 | 0,38 | 248 | 0,40 | ||||
| 2026-02-13 | 13F | Kestra Advisory Services, LLC | 0 | -100,00 | 0 | |||||
| 2026-02-13 | 13F | Wbi Investments, Inc. | 4.302 | 0,02 | 215 | 0,00 | ||||
| 2026-02-06 | 13F | Flynn Zito Capital Management, Llc | 9.672 | 0,62 | 484 | 0,41 | ||||
| 2026-01-12 | 13F | Spinnaker Investment Group, LLC | 97.553 | 16,99 | 4.884 | 16,70 | ||||
| 2026-02-10 | 13F | Goldman Sachs Group Inc | 79.131 | -14,03 | 3.962 | -14,24 | ||||
| 2026-02-12 | 13F | Jane Street Group, Llc | 25.911 | -67,07 | 1.297 | -67,16 | ||||
| 2025-11-12 | 13F | Ted Buchan & Co | 0 | -100,00 | 0 | |||||
| 2026-01-23 | 13F | Fonville Wealth Management LLC | 69.453 | 2,61 | 3.478 | 2,36 | ||||
| 2026-02-13 | 13F | Integrated Wealth Concepts LLC | 133.576 | 7,23 | 6.688 | 6,97 | ||||
| 2026-01-06 | 13F | Unique Wealth, Llc | 8.416 | -6,48 | 421 | -6,65 | ||||
| 2026-02-17 | 13F | Equitable Holdings, Inc. | 59.249 | 20,01 | 2.967 | 19,69 | ||||
| 2026-01-14 | 13F | Spire Wealth Management | 12.035 | -21,51 | 603 | -21,72 | ||||
| 2026-02-06 | 13F | IFP Advisors, Inc | 19.877 | -0,73 | 995 | -1,00 | ||||
| 2025-10-24 | 13F | Bay Colony Advisory Group, Inc d/b/a Bay Colony Advisors | 0 | -100,00 | 0 | |||||
| 2026-02-09 | 13F | Atticus Wealth Management, Llc | 4.752 | -46,29 | 238 | -46,62 | ||||
| 2026-02-12 | 13F | Pitcairn Co | 0 | -100,00 | 0 | |||||
| 2026-02-13 | 13F | Barclays Plc | 60.000 | 3.004 | ||||||
| 2026-02-13 | 13F | Wells Fargo & Company/mn | 224 | -0,44 | 11 | 0,00 |