Grundlæggende statistik
| Institutionelle aktier (lange) | 28.389.113 - 101,32% (ex 13D/G) - change of -9,53MM shares -25,13% MRQ |
| Institutionel værdi (lang) | $ 942.850 USD ($1000) |
Institutionelt ejerskab og aktionærer
Pursuit Attractions and Hospitality, Inc. (US:VVI) har 168 institutionelle ejere og aktionærer, der har indsendt 13D/G- eller 13F-formularer til Securities Exchange Commission (SEC). Disse institutioner har i alt 28,389,113 aktier. Største aktionærer omfatter Crestview Partners IV GP, L.P., BlackRock, Inc., River Road Asset Management, LLC, Vanguard Group Inc, Victory Capital Management Inc, Allspring Global Investments Holdings, LLC, Fmr Llc, TimesSquare Capital Management, LLC, State Street Corp, and Advisory Research Inc .
Pursuit Attractions and Hospitality, Inc. (NYSE:VVI) institutionel ejerskabsstruktur viser aktuelle positioner i virksomheden efter institutioner og fonde, samt seneste ændringer i positionsstørrelse. Større aktionærer kan omfatte individuelle investorer, investeringsforeninger, hedgefonde eller institutioner. Skema 13D angiver, at investoren besidder (eller besidder) mere end 5 % af virksomheden og har til hensigt (eller har til hensigt at) aktivt at forfølge en ændring i forretningsstrategi. Skema 13G indikerer en passiv investering på over 5%.

Fondens stemningsscore
Fund Sentiment Score (fka Ownership Accumulation Score) finder de aktier, der bliver mest købt af fonde. Det er resultatet af en sofistikeret, multi-faktor kvantitativ model, der identificerer virksomheder med de højeste niveauer af institutionel akkumulering. Scoringsmodellen bruger en kombination af den samlede stigning i oplyste ejere, ændringerne i porteføljeallokeringer i disse ejere og andre målinger. Tallet går fra 0 til 100, hvor højere tal indikerer et højere niveau af akkumulering for sine jævnaldrende, og 50 er gennemsnittet.
Opdateringsfrekvens: Dagligt
Se Ownership Explorer, som giver en liste over højest rangerende virksomheder.
AI+ Ask Fintel’s AI assistant about Pursuit Attractions and Hospitality, Inc..
Select a question to share a public post with an AI-crafted answer.
Thinking of good questions…
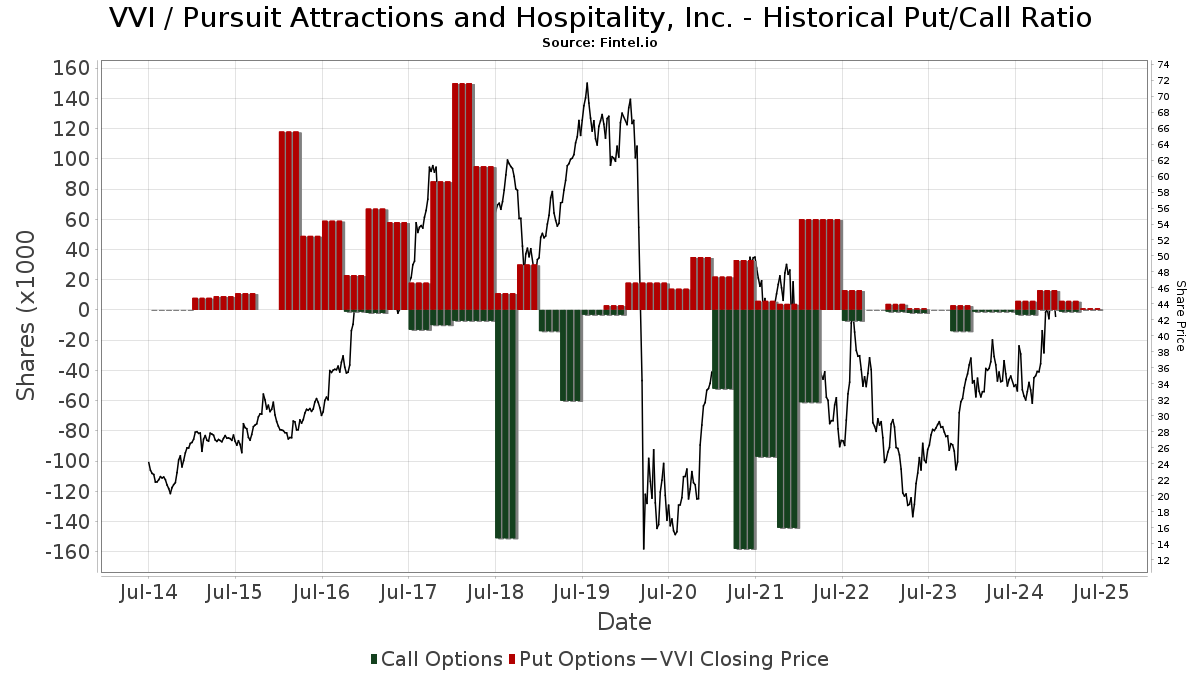
Institutionel Put/Call-forhold
Ud over at indberette standardaktie- og gældsudstedelser skal institutter med mere end 100 mill. aktiver under forvaltning også oplyse deres put- og call-optionsbeholdninger. Da salgsoptioner generelt indikerer negativ stemning, og købsoptioner indikerer positiv stemning, kan vi få en fornemmelse af den overordnede institutionelle stemning ved at plotte forholdet mellem put og kald. Diagrammet til højre viser det historiske put/call-forhold for dette instrument.
Brug af Put/Call Ratio som en indikator for investorernes stemning overvinder en af de vigtigste mangler ved at bruge totalt institutionelt ejerskab, som er, at en betydelig mængde af aktiver under forvaltning investeres passivt for at spore indekser. Passivt forvaltede fonde køber typisk ikke optioner, så indikatoren for put/call-forholdet følger mere nøje følelsen af aktivt forvaltede fonde.
13F og NPORT arkivering
Detaljer om 13F-arkivering er gratis. Detaljer om NP-ansøgninger kræver et premium-medlemskab. Grønne rækker angiver nye positioner. Røde rækker angiver lukkede positioner. Klik på linket ikon for at se den fulde transaktionshistorik.
Opgrader
for at låse premium-data op og eksportere til Excel ![]() .
.
| Fil dato | Kilde | Investor | Type | Gennemsnitlig pris (Øst) |
Aktier | Δ Aktier (%) |
Rapporteret Værdi ($1000) |
Δ Værdi (%) |
Port Alloc (%) |
|
|---|---|---|---|---|---|---|---|---|---|---|
| 2026-02-17 | 13F | Citadel Advisors Llc | 88.472 | -37,64 | 2.980 | -41,96 | ||||
| 2026-02-12 | 13F | BlackRock, Inc. | 3.268.847 | 2,07 | 110.095 | -4,98 | ||||
| 2026-02-12 | 13F | Renaissance Technologies Llc | 0 | -100,00 | 0 | |||||
| 2026-02-17 | 13F | Qube Research & Technologies Ltd | 345.349 | 186,42 | 11.631 | 166,64 | ||||
| 2026-01-29 | 13F | UBS Group AG | 40.726 | -46,92 | 1.372 | -50,59 | ||||
| 2026-02-04 | 13F | Virginia Retirement Systems Et Al | 26.300 | -10,24 | 886 | -16,51 | ||||
| 2025-11-05 | 13F | Alps Advisors Inc | 0 | -100,00 | 0 | |||||
| 2026-02-17 | 13F | ISAM Funds (UK) Ltd | 0 | -100,00 | 0 | |||||
| 2025-11-04 | 13F | State of Wyoming | 0 | -100,00 | 0 | |||||
| 2026-02-17 | 13F | Ameriprise Financial Inc | 42.854 | -6,19 | 1.443 | -12,65 | ||||
| 2026-02-17 | 13F | Manatuck Hill Partners, LLC | 131.400 | 112,97 | 4.426 | 98,25 | ||||
| 2026-02-02 | 13F | Strs Ohio | 200 | 0,00 | 7 | -14,29 | ||||
| 2026-01-21 | 13F | Yousif Capital Management, Llc | 0 | -100,00 | 0 | |||||
| 2026-01-08 | 13F | Chesapeake Asset Management Llc | 7.520 | -22,01 | 253 | -27,30 | ||||
| 2026-02-13 | 13F | Entropy Technologies, LP | 8.869 | 299 | ||||||
| 2026-02-17 | 13F | Boothbay Fund Management, Llc | 237.608 | 38,76 | 8.003 | 29,17 | ||||
| 2026-02-17 | 13F | Bank Of America Corp /de/ | 158.319 | -19,18 | 5.332 | -24,76 | ||||
| 2026-02-09 | 13F | Wiser Advisor Group LLC | 100 | 0,00 | 3 | 0,00 | ||||
| 2026-02-13 | 13F | Transamerica Financial Advisors, Inc. | 3 | 0 | ||||||
| 2026-02-13 | 13F | Smartleaf Asset Management LLC | 330 | 11,49 | 11 | 10,00 | ||||
| 2026-02-09 | 13F | Redmond Asset Management, LLC | 31.876 | 0,46 | 1.074 | -6,45 | ||||
| 2026-02-26 | 13F | Anchor Investment Management, LLC | 126 | 0,00 | 4 | 0,00 | ||||
| 2026-02-13 | 13F | Charles Schwab Investment Management Inc | 195.276 | 1,88 | 6.577 | -5,16 | ||||
| 2026-02-11 | 13F | Franklin Resources Inc | 9.145 | 43,86 | 308 | 34,50 | ||||
| 2026-02-10 | 13F | Goldman Sachs Group Inc | 204.181 | 29,83 | 6.877 | 20,84 | ||||
| 2026-02-17 | 13F | Northern Trust Corp | 221.750 | -6,58 | 7.469 | -13,03 | ||||
| 2026-02-05 | 13F | Allworth Financial LP | 119 | 26,60 | 4 | 33,33 | ||||
| 2026-02-10 | 13F | Bnp Paribas Arbitrage, Sa | 4.744 | -10,63 | 160 | -17,19 | ||||
| 2026-02-13 | 13F | Morgan Stanley | 366.828 | 5,75 | 12.355 | -1,56 | ||||
| 2026-02-17 | 13F | Brevan Howard Capital Management LP | 12.467 | 420 | ||||||
| 2026-02-13 | 13F | Arrowstreet Capital, Limited Partnership | 0 | -100,00 | 0 | |||||
| 2026-02-17 | 13F | Janus Henderson Group Plc | 8.971 | 0,00 | 302 | -6,79 | ||||
| 2026-01-30 | 13F | Us Bancorp \de\ | 520 | -3,17 | 18 | -10,53 | ||||
| 2026-02-17 | 13F | California State Teachers Retirement System | 19.536 | -0,11 | 658 | -7,07 | ||||
| 2025-11-14 | 13F | DRW Securities, LLC | 0 | -100,00 | 0 | |||||
| 2026-01-29 | 13F | Teachers Retirement System Of The State Of Kentucky | 5.362 | -11,58 | 0 | |||||
| 2026-02-09 | 13F | Royce & Associates Lp | 284.113 | -3,07 | 9.569 | -9,77 | ||||
| 2026-02-05 | 13F | Thrivent Financial For Lutherans | 14.770 | -4,73 | 0 | |||||
| 2026-02-17 | 13F | State Of Wisconsin Investment Board | 0 | -100,00 | 0 | |||||
| 2026-02-13 | 13F | Public Sector Pension Investment Board | 0 | -100,00 | 0 | |||||
| 2026-02-12 | 13F | Jane Street Group, Llc | 21.902 | -3,03 | 738 | -9,79 | ||||
| 2025-11-14 | 13F | Squarepoint Ops LLC | 0 | -100,00 | 0 | |||||
| 2026-01-16 | 13F | Louisiana State Employees Retirement System | 9.800 | -1,01 | 330 | -7,82 | ||||
| 2026-02-06 | 13F | Bastion Asset Management Inc. | 8.298 | 289 | ||||||
| 2026-01-28 | 13F | Arizona State Retirement System | 5.940 | -5,26 | 200 | -11,50 | ||||
| 2026-02-11 | 13F | LPL Financial LLC | 9.820 | 331 | ||||||
| 2026-02-17 | 13F | GEM Realty Capital | 0 | -100,00 | 0 | |||||
| 2026-01-23 | 13F | Assetmark, Inc | 299 | 2,40 | 10 | 0,00 | ||||
| 2026-01-20 | 13F | Signaturefd, Llc | 49 | -5,77 | 2 | 0,00 | ||||
| 2026-02-17 | 13F | Aristotle Capital Boston, LLC | 543.068 | -9,31 | 18.291 | -15,57 | ||||
| 2026-02-13 | 13F | Sei Investments Co | 161.422 | 7,11 | 5.437 | -0,29 | ||||
| 2026-02-17 | 13F | Price T Rowe Associates Inc /md/ | 31.124 | 18,69 | 1 | |||||
| 2026-02-17 | 13F | Atom Investors LP | 46.718 | 1.573 | ||||||
| 2026-01-28 | 13F | Klp Kapitalforvaltning As | 4.600 | 17,95 | 155 | 9,22 | ||||
| 2026-01-30 | 13F | New York State Teachers Retirement System | 33.333 | 0,00 | 1 | 0,00 | ||||
| 2026-02-13 | 13F | Crestview Partners IV GP, L.P. | 6.697.979 | 0,00 | 225.588 | -6,91 | ||||
| 2026-02-17 | 13F | Alliancebernstein L.p. | 521.934 | -37,83 | 17.579 | -42,13 | ||||
| 2025-11-21 | 13F | Nebula Research & Development LLC | 0 | -100,00 | 0 | |||||
| 2026-01-29 | 13F | Comerica Bank | 73.994 | 136,44 | 2.492 | 120,14 | ||||
| 2026-02-13 | 13F | Advisory Research Inc | 694.821 | -4,40 | 23.402 | -11,01 | ||||
| 2026-02-11 | 13F | Deutsche Bank Ag\ | 18.331 | -20,24 | 617 | -25,75 | ||||
| 2026-01-29 | 13F | UMA Financial Services, Inc. | 18 | 1 | ||||||
| 2026-02-12 | 13F | Dimensional Fund Advisors Lp | 598.524 | 4,62 | 20.158 | -2,62 | ||||
| 2026-02-05 | 13F | High Note Wealth, LLC | 56 | 2 | ||||||
| 2026-02-05 | 13F | Amalgamated Bank | 6.265 | -0,33 | 0 | |||||
| 2026-02-05 | 13F | Bessemer Group Inc | 45 | -54,08 | 0 | |||||
| 2026-02-06 | 13F | Larson Financial Group LLC | 587 | -25,60 | 20 | -32,14 | ||||
| 2026-02-17 | 13F | Algert Global Llc | 104.100 | 4 | ||||||
| 2026-01-09 | 13F | SG Americas Securities, LLC | 7.451 | 2,57 | 0 | |||||
| 2026-02-17 | 13F | Gotham Asset Management, LLC | 0 | -100,00 | 0 | |||||
| 2026-02-13 | 13F | Verition Fund Management LLC | 7.656 | -19,87 | 258 | -25,51 | ||||
| 2026-02-12 | 13F | Rossby Financial, LCC | 21 | 10,53 | 1 | |||||
| 2026-02-12 | 13F | MetLife Investment Management, LLC | 12.302 | 0,00 | 414 | -6,97 | ||||
| 2026-02-09 | 13F | Atlantic Trust, LLC | 0 | -100,00 | 0 | |||||
| 2026-02-13 | 13F | Quarry LP | 23 | 1 | ||||||
| 2026-02-13 | 13F | Police & Firemen's Retirement System of New Jersey | 5.849 | 0,00 | 197 | -7,11 | ||||
| 2026-02-12 | 13F | CIBC Private Wealth Group, LLC | 230 | -87,79 | 8 | -89,71 | ||||
| 2026-01-14 | 13F | Moisand Fitzgerald Tamayo, LLC | 10 | 0,00 | 0 | |||||
| 2026-02-17 | 13F | Advisor Group Holdings, Inc. | 411 | 2,24 | 14 | -7,14 | ||||
| 2026-01-16 | 13F | Sims Investment Management, Llc | 36.898 | -1,89 | 1.243 | -8,68 | ||||
| 2026-02-06 | 13F | Pnc Financial Services Group, Inc. | 13.564 | 11,84 | 457 | 4,11 | ||||
| 2026-02-17 | 13F | Royal Bank Of Canada | 4.082 | -71,75 | 138 | -73,61 | ||||
| 2026-02-12 | 13F | Quadrant Capital Group Llc | 8.067 | 0,00 | 272 | -6,87 | ||||
| 2026-01-23 | 13F | Farther Finance Advisors, LLC | 93 | 389,47 | 3 | |||||
| 2026-02-11 | 13F | Vermillion Wealth Management, Inc. | 0 | -100,00 | 0 | |||||
| 2025-11-14 | 13F | Man Group plc | 0 | -100,00 | 0 | |||||
| 2026-02-13 | 13F | Caitong International Asset Management Co., Ltd | 0 | -100,00 | 0 | |||||
| 2026-02-11 | 13F | Los Angeles Capital Management Llc | 9.145 | -51,87 | 322 | -53,28 | ||||
| 2026-01-29 | 13F | Vanguard Group Inc | 1.575.649 | 1,23 | 53.068 | -5,76 | ||||
| 2026-02-10 | 13F | Bank of New York Mellon Corp | 170.949 | 30,91 | 5.758 | 21,87 | ||||
| 2026-02-17 | 13F | Russell Investments Group, Ltd. | 123.260 | 11,21 | 4.151 | 3,52 | ||||
| 2026-02-24 | 13F | River Road Asset Management, LLC | 2.032.605 | 3,56 | 68.458 | -3,60 | ||||
| 2026-02-19 | 13F | Invesco Ltd. | 51.752 | -53,48 | 1.743 | -56,70 | ||||
| 2026-01-05 | 13F | GAMMA Investing LLC | 176 | 282,61 | 6 | 400,00 | ||||
| 2026-02-13 | 13F | SRS Capital Advisors, Inc. | 57 | 0,00 | 2 | -50,00 | ||||
| 2026-02-13 | 13F | Marshall Wace, Llp | 58.457 | 1.969 | ||||||
| 2026-02-13 | 13F | Parkside Financial Bank & Trust | 57 | 0,00 | 2 | -50,00 | ||||
| 2026-02-13 | 13F | Victory Capital Management Inc | 1.527.115 | -14,91 | 51.433 | -20,79 | ||||
| 2026-02-06 | 13F | Global Retirement Partners, LLC | 14 | 0,00 | 0 | |||||
| 2026-02-13 | 13F | Pinnacle Wealth Planning Services, Inc. | 931 | 31 | ||||||
| 2026-02-09 | 13F | Geode Capital Management, Llc | 504.899 | -0,68 | 17.007 | -7,54 | ||||
| 2026-02-11 | 13F | Illinois Municipal Retirement Fund | 11.321 | -1,86 | 381 | -8,63 | ||||
| 2026-02-09 | 13F | Hantz Financial Services, Inc. | 478 | 330,63 | 0 | |||||
| 2025-11-12 | 13F | Ameriflex Group, Inc. | 0 | -100,00 | 0 | |||||
| 2026-02-10 | 13F | Envestnet Asset Management Inc | 9.482 | 32,97 | 319 | 23,64 | ||||
| 2026-02-13 | 13F | American Century Companies Inc | 49.757 | 0,21 | 1.676 | -6,74 | ||||
| 2026-02-17 | 13F | Kemnay Advisory Services Inc. | 1.641 | 55 | ||||||
| 2026-02-17 | 13F | Raymond James Financial Inc | 136.637 | -5,04 | 4.602 | -11,62 | ||||
| 2026-02-11 | 13F | Ameritas Investment Partners, Inc. | 1.724 | 58 | ||||||
| 2026-02-04 | 13F | Atlantic Union Bankshares Corp | 25 | 0,00 | 1 | |||||
| 2026-02-17 | 13F | Aquatic Capital Management LLC | 5.192 | 175 | ||||||
| 2025-11-14 | 13F | Susquehanna International Group, Llp | 0 | -100,00 | 0 | -100,00 | ||||
| 2025-11-14 | 13F | Lazard Asset Management Llc | 0 | -100,00 | 0 | |||||
| 2026-02-12 | 13F | Nuveen, LLC | 65.398 | 0,91 | 2.203 | -6,06 | ||||
| 2026-02-11 | 13F | CenterBook Partners LP | 0 | -100,00 | 0 | -100,00 | ||||
| 2026-02-17 | 13F | Aster Capital Management (DIFC) Ltd | 293 | 946,43 | 10 | 800,00 | ||||
| 2026-02-12 | 13F | Swiss National Bank | 41.800 | 2,70 | 1.408 | -4,42 | ||||
| 2026-02-17 | 13F/A | RBF Capital, LLC | 36.000 | -8,40 | 1.212 | -14,71 | ||||
| 2026-02-12 | 13F | Steward Partners Investment Advisory, Llc | 76 | 0,00 | 3 | 0,00 | ||||
| 2025-11-13 | 13F | Panagora Asset Management Inc | 0 | -100,00 | 0 | |||||
| 2025-11-14 | 13F | Corton Capital Inc. | 6.334 | 229 | ||||||
| 2026-02-11 | 13F | Jpmorgan Chase & Co | 8.718 | -0,73 | 294 | -7,57 | ||||
| 2026-01-07 | 13F | Massmutual Trust Co Fsb/adv | 13 | -65,79 | 0 | -100,00 | ||||
| 2026-01-30 | 13F | Keybank National Association/oh | 9.600 | -5,42 | 323 | -11,99 | ||||
| 2026-02-06 | 13F | TimesSquare Capital Management, LLC | 927.024 | 10,42 | 31.222 | 2,79 | ||||
| 2025-11-12 | 13F | Simplex Trading, Llc | Put | 0 | -100,00 | 0 | ||||
| 2026-02-06 | 13F | Covestor Ltd | 2 | 0,00 | 0 | |||||
| 2026-02-13 | 13F | Barclays Plc | 43.123 | -31,38 | 1.452 | -35,50 | ||||
| 2026-02-13 | 13F | Wells Fargo & Company/mn | 29.008 | 39,75 | 977 | 30,13 | ||||
| 2026-01-23 | 13F | State of Alaska, Department of Revenue | 12.413 | 1,07 | 0 | |||||
| 2026-02-12 | 13F | Bank Of Montreal /can/ | 17.809 | 0,71 | 600 | -6,26 | ||||
| 2025-12-02 | 13F | IFP Advisors, Inc | 0 | 19 | 63,64 | |||||
| 2026-02-17 | 13F | Quantinno Capital Management LP | 9.469 | 319 | ||||||
| 2026-01-30 | 13F | Torren Management, LLC | 140 | 5 | ||||||
| 2025-10-24 | 13F | Meeder Asset Management Inc | 0 | -100,00 | 0 | |||||
| 2026-02-12 | 13F | New York State Common Retirement Fund | 246.801 | 8,41 | 8.312 | 0,92 | ||||
| 2026-02-13 | 13F | MAI Capital Management | 101 | 3 | ||||||
| 2026-02-17 | 13F | Fmr Llc | 965.802 | -6,08 | 32.528 | -12,57 | ||||
| 2026-02-09 | 13F | Legal & General Group Plc | 48.514 | -9,72 | 1.634 | -16,00 | ||||
| 2026-02-13 | 13F | Manufacturers Life Insurance Company, The | 0 | -100,00 | 0 | |||||
| 2026-02-17 | 13F | Tower Research Capital LLC (TRC) | 1.479 | 59,55 | 50 | 48,48 | ||||
| 2026-02-04 | 13F | LRI Investments, LLC | 127 | -36,82 | 4 | -42,86 | ||||
| 2026-02-17 | 13F | Creative Planning | 10.685 | 58,48 | 360 | 47,74 | ||||
| 2026-02-11 | 13F | Parallel Advisors, LLC | 171 | 0,00 | 6 | -16,67 | ||||
| 2026-01-15 | 13F | Nisa Investment Advisors, Llc | 649 | 36,63 | 22 | 23,53 | ||||
| 2025-11-14 | 13F | Texas Permanent School Fund | 0 | -100,00 | 0 | -100,00 | ||||
| 2025-11-14 | 13F/A | Skopos Labs, Inc. | 0 | -100,00 | 0 | -100,00 | ||||
| 2026-02-13 | 13F | BNP Paribas Asset Management Holding S.A. | 457 | 53,36 | 0 | |||||
| 2026-02-11 | 13F | Winton Capital Group Ltd | 0 | -100,00 | 0 | |||||
| 2026-02-13 | 13F | Ubs Asset Management Americas Inc | 39.585 | -68,36 | 1.333 | -70,55 | ||||
| 2026-02-06 | 13F | Gsa Capital Partners Llp | 12.497 | 0 | ||||||
| 2026-02-13 | 13F | Prudential Financial Inc | 20.248 | -7,10 | 682 | -13,58 | ||||
| 2026-01-26 | 13F | Cwm, Llc | 509 | 8,99 | 0 | |||||
| 2026-02-02 | 13F | Fifth Third Bancorp | 123 | 2,50 | 4 | 0,00 | ||||
| 2026-02-17 | 13F | MIRAE ASSET GLOBAL ETFS HOLDINGS Ltd. | 9.865 | 0,01 | 332 | -6,74 | ||||
| 2026-02-13 | 13F | Citigroup Inc | 14.126 | 64,05 | 476 | 52,73 | ||||
| 2026-02-13 | 13F | State Street Corp | 813.263 | 3,22 | 27.391 | -3,91 | ||||
| 2026-02-17 | 13F | XTX Topco Ltd | 26.326 | 887 | ||||||
| 2026-01-27 | 13F | Zurcher Kantonalbank (Zurich Cantonalbank) | 13.109 | 101,31 | 442 | 87,66 | ||||
| 2026-01-20 | 13F | Harbor Capital Advisors, Inc. | 240 | -1,64 | 0 | |||||
| 2026-02-13 | 13F | Sterling Capital Management LLC | 1.157 | -16,04 | 39 | -22,45 | ||||
| 2025-11-14 | 13F | Granahan Investment Management Inc/ma | 0 | -100,00 | 0 | |||||
| 2026-02-12 | 13F | JPL Wealth Management, LLC | 0 | -100,00 | 0 | |||||
| 2026-02-06 | 13F | EverSource Wealth Advisors, LLC | 12 | -70,00 | 0 | -100,00 | ||||
| 2026-02-12 | 13F | Loomis Sayles & Co L P | 319.140 | 0,70 | 10.749 | -6,26 | ||||
| 2026-02-17 | 13F | Canada Pension Plan Investment Board | 1.300 | 44 | ||||||
| 2026-02-18 | 13F | SkyView Investment Advisors, LLC | 24.967 | 0,78 | 1 | |||||
| 2026-02-17 | 13F | Ancora Advisors, LLC | 145.056 | -1,50 | 4.885 | -8,31 | ||||
| 2026-02-17 | 13F | Armistice Capital, Llc | 47.500 | 0,00 | 1.600 | -6,93 | ||||
| 2025-11-12 | 13F | Simplex Trading, Llc | 0 | -100,00 | 0 | |||||
| 2026-01-15 | 13F | Allspring Global Investments Holdings, LLC | 1.436.183 | -5,11 | 47.983 | -10,69 | ||||
| 2025-11-12 | 13F | First Trust Advisors Lp | 0 | -100,00 | 0 | |||||
| 2026-02-09 | 13F | Penn Capital Management Co Inc | 363.936 | 6,24 | 12.270 | -1,10 | ||||
| 2026-02-09 | 13F | Clear Investment Research, Llc | 0 | -100,00 | 0 | |||||
| 2026-02-10 | 13F | Rothschild Investment Llc | 59 | 7,27 | 2 | 0,00 | ||||
| 2026-02-17 | 13F | Millennium Management Llc | 189.967 | -58,26 | 6.398 | -61,14 | ||||
| 2026-02-17 | 13F | ArrowMark Colorado Holdings LLC | 326.868 | 6,63 | 11.009 | -0,74 | ||||
| 2026-02-04 | 13F | Oregon Public Employees Retirement Fund | 4.923 | 1,48 | 166 | -5,71 | ||||
| 2026-02-14 | 13F | Rockefeller Capital Management L.P. | 354 | 91,35 | 12 | 83,33 | ||||
| 2026-01-08 | 13F | Versant Capital Management, Inc | 131 | 0,00 | 4 | 0,00 | ||||
| 2026-01-21 | 13F | Sound Income Strategies, LLC | 68 | 2 | ||||||
| 2026-02-03 | 13F | Farmers & Merchants Investments Inc | 16 | 0,00 | 1 | |||||
| 2026-02-10 | 13F/A | Northwestern Mutual Wealth Management Co | 37 | -48,61 | 1 | -50,00 | ||||
| 2026-01-28 | 13F | DekaBank Deutsche Girozentrale | 1.135 | 0,00 | 0 | |||||
| 2026-02-09 | 13F | Huntington National Bank | 1 | 0,00 | 0 | |||||
| 2026-02-12 | 13F | Ensign Peak Advisors, Inc | 6.434 | -59,24 | 217 | -62,17 | ||||
| 2026-02-17 | 13F | Zacks Investment Management | 30.994 | 92,52 | 1.044 | 79,21 | ||||
| 2025-10-08 | 13F | Veracity Capital LLC | 0 | -100,00 | 0 | |||||
| 2026-02-02 | 13F | Principal Financial Group Inc | 102.459 | -1,26 | 3.451 | -8,10 | ||||
| 2026-02-06 | 13F | Cullen/frost Bankers, Inc. | 333 | 11 | ||||||
| 2026-02-18 | 13F | JCP Investment Management, LLC | 15.000 | 505 | ||||||
| 2026-02-12 | 13F | Wealthspire Advisors, LLC | 0 | -100,00 | 0 | |||||
| 2026-02-17 | 13F | Optiver Holding B.V. | 100 | -12,28 | 3 | -25,00 | ||||
| 2025-11-14 | 13F | ExodusPoint Capital Management, LP | 0 | -100,00 | 0 | |||||
| 2026-01-27 | 13F | Deroy & Devereaux Private Investment Counsel Inc | 109.790 | -3,13 | 4 | -25,00 | ||||
| 2025-10-24 | 13F | Forum Financial Management, LP | 0 | -100,00 | 0 | |||||
| 2026-02-13 | 13F | Great West Life Assurance Co /can/ | 17.850 | 0,00 | 1 | |||||
| 2025-11-12 | 13F | Simplex Trading, Llc | Call | 0 | -100,00 | 0 | ||||
| 2026-02-17 | 13F | Bayesian Capital Management, LP | 0 | -100,00 | 0 | |||||
| 2026-02-17 | 13F | Jones Financial Companies Lllp | 14 | 0,00 | 0 | |||||
| 2026-01-28 | 13F | Salomon & Ludwin, LLC | 0 | -100,00 | 0 | |||||
| 2026-02-13 | 13F | Rhumbline Advisers | 65.802 | 3,06 | 2.216 | -4,07 | ||||
| 2026-01-22 | 13F | Financial Consulate, Inc | 145 | 0,00 | 5 | -20,00 | ||||
| 2026-02-13 | 13F | Resources Investment Advisors, LLC. | 13.695 | -1,60 | 461 | -8,35 | ||||
| 2026-02-18 | 13F | State of Tennessee, Treasury Department | 4.726 | -7,32 | 164 | -10,87 | ||||
| 2026-02-05 | 13F | Teton Advisors, LLC | 10.000 | 0,00 | 337 | -6,93 | ||||
| 2026-02-10 | 13F | Intech Investment Management Llc | 7.792 | 0,00 | 262 | -6,76 | ||||
| 2026-02-12 | 13F | State Board Of Administration Of Florida Retirement System | 0 | -100,00 | 0 | |||||
| 2026-02-09 | 13F | Quest Partners LLC | 11.433 | 257,50 | 385 | 234,78 | ||||
| 2026-02-13 | 13F | Umb Bank N A/mo | 151 | 169,64 | 5 | 150,00 |