Grundlæggende statistik
| Institutionelle ejere | 80 total, 80 long only, 0 short only, 0 long/short - change of 33,33% MRQ |
| Gennemsnitlig porteføljeallokering | 0.1384 % - change of 5,52% MRQ |
| Institutionelle aktier (lange) | 5.552.997 (ex 13D/G) - change of 2,44MM shares 78,22% MRQ |
| Institutionel værdi (lang) | $ 536.829 USD ($1000) |
Institutionelt ejerskab og aktionærer
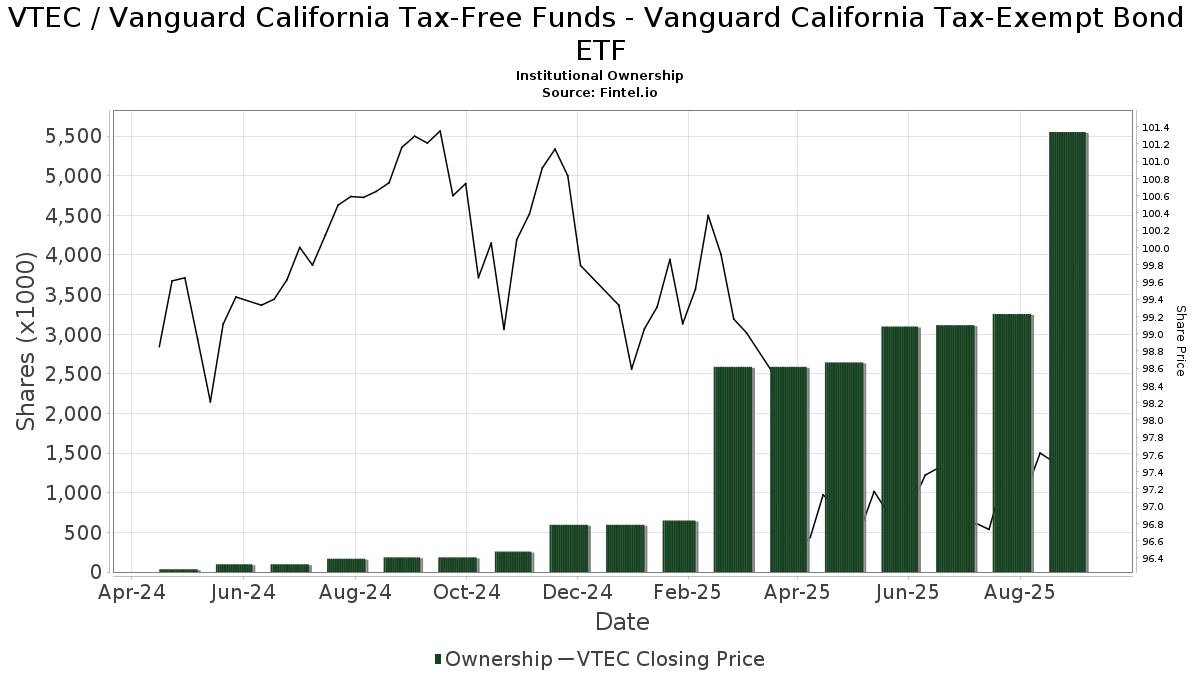
Vanguard California Tax-Free Funds - Vanguard California Tax-Exempt Bond ETF (US:VTEC) har 80 institutionelle ejere og aktionærer, der har indsendt 13D/G- eller 13F-formularer til Securities Exchange Commission (SEC). Disse institutioner har i alt 5,552,997 aktier. Største aktionærer omfatter Charles Schwab Investment Management Inc, Cetera Investment Advisers, Bank Of America Corp /de/, Captrust Financial Advisors, CI Private Wealth, LLC, Wedmont Private Capital, Susquehanna International Group, Llp, LPL Financial LLC, Brio Consultants, LLC, and Eclectic Associates Inc /adv .
Vanguard California Tax-Free Funds - Vanguard California Tax-Exempt Bond ETF (BATS:VTEC) institutionel ejerskabsstruktur viser aktuelle positioner i virksomheden efter institutioner og fonde, samt seneste ændringer i positionsstørrelse. Større aktionærer kan omfatte individuelle investorer, investeringsforeninger, hedgefonde eller institutioner. Skema 13D angiver, at investoren besidder (eller besidder) mere end 5 % af virksomheden og har til hensigt (eller har til hensigt at) aktivt at forfølge en ændring i forretningsstrategi. Skema 13G indikerer en passiv investering på over 5%.
The share price as of September 12, 2025 is 99,47 / share. Previously, on September 13, 2024, the share price was 101,29 / share. This represents a decline of 1,80% over that period.
Fondens stemningsscore
Fund Sentiment Score (fka Ownership Accumulation Score) finder de aktier, der bliver mest købt af fonde. Det er resultatet af en sofistikeret, multi-faktor kvantitativ model, der identificerer virksomheder med de højeste niveauer af institutionel akkumulering. Scoringsmodellen bruger en kombination af den samlede stigning i oplyste ejere, ændringerne i porteføljeallokeringer i disse ejere og andre målinger. Tallet går fra 0 til 100, hvor højere tal indikerer et højere niveau af akkumulering for sine jævnaldrende, og 50 er gennemsnittet.
Opdateringsfrekvens: Dagligt
Se Ownership Explorer, som giver en liste over højest rangerende virksomheder.
Institutionel Put/Call-forhold
Ud over at indberette standardaktie- og gældsudstedelser skal institutter med mere end 100 mill. aktiver under forvaltning også oplyse deres put- og call-optionsbeholdninger. Da salgsoptioner generelt indikerer negativ stemning, og købsoptioner indikerer positiv stemning, kan vi få en fornemmelse af den overordnede institutionelle stemning ved at plotte forholdet mellem put og kald. Diagrammet til højre viser det historiske put/call-forhold for dette instrument.
Brug af Put/Call Ratio som en indikator for investorernes stemning overvinder en af de vigtigste mangler ved at bruge totalt institutionelt ejerskab, som er, at en betydelig mængde af aktiver under forvaltning investeres passivt for at spore indekser. Passivt forvaltede fonde køber typisk ikke optioner, så indikatoren for put/call-forholdet følger mere nøje følelsen af aktivt forvaltede fonde.
13F og NPORT arkivering
Detaljer om 13F-arkivering er gratis. Detaljer om NP-ansøgninger kræver et premium-medlemskab. Grønne rækker angiver nye positioner. Røde rækker angiver lukkede positioner. Klik på linket ikon for at se den fulde transaktionshistorik.
Opgrader
for at låse premium-data op og eksportere til Excel ![]() .
.
| Fil dato | Kilde | Investor | Type | Gennemsnitlig pris (Øst) |
Aktier | Δ Aktier (%) |
Rapporteret Værdi ($1000) |
Δ Værdi (%) |
Port Alloc (%) |
|
|---|---|---|---|---|---|---|---|---|---|---|
| 2025-08-08 | 13F | Larson Financial Group LLC | 1.000 | 0,00 | 98 | -1,02 | ||||
| 2025-07-29 | 13F | FLC Capital Advisors | 20.258 | -2,70 | 1.977 | -3,47 | ||||
| 2025-08-12 | 13F | Charles Schwab Investment Management Inc | 3.879.597 | 71,50 | 378.687 | 70,12 | ||||
| 2025-08-13 | 13F | Flow Traders U.s. Llc | 8.825 | 1 | ||||||
| 2025-08-14 | 13F | GWM Advisors LLC | 3.363 | 0,00 | 328 | -0,61 | ||||
| 2025-07-03 | 13F | Fiduciary Financial Group, Llc | 3.108 | 0,00 | 303 | 0,33 | ||||
| 2025-08-14 | 13F | Bank Of America Corp /de/ | 218.786 | 185,63 | 21.356 | 183,34 | ||||
| 2025-08-01 | 13F | Equita Financial Network, Inc. | 0 | -100,00 | 0 | |||||
| 2025-08-13 | 13F | Beacon Pointe Advisors, LLC | 2.543 | 248 | ||||||
| 2025-08-08 | 13F | Cetera Investment Advisers | 225.420 | 10.448,43 | 22.003 | 10.377,62 | ||||
| 2025-08-14 | 13F | Wells Fargo & Company/mn | 1 | 0 | ||||||
| 2025-08-15 | 13F | CI Private Wealth, LLC | 79.392 | 7.749 | ||||||
| 2025-07-29 | 13F | Aspiriant, Llc | 2.530 | 1,20 | 247 | 0,00 | ||||
| 2025-07-31 | 13F | CVA Family Office, LLC | 184 | -44,91 | 18 | -46,87 | ||||
| 2025-05-15 | 13F | Moneta Group Investment Advisors Llc | 0 | -100,00 | 0 | |||||
| 2025-08-14 | 13F | Gotham Asset Management, LLC | 39.612 | 0,00 | 3.867 | -0,80 | ||||
| 2025-07-17 | 13F | Eclectic Associates Inc /adv | 53.092 | 55,97 | 5.182 | 54,73 | ||||
| 2025-08-28 | 13F/A | Tolleson Wealth Management, Inc. | 3.300 | 0,00 | 322 | -0,62 | ||||
| 2025-07-31 | 13F | Buckingham Strategic Partners | 39.000 | 3.807 | ||||||
| 2025-08-13 | 13F | Jones Financial Companies Lllp | 18.188 | 78,70 | 1.771 | 76,92 | ||||
| 2025-09-04 | 13F/A | Advisor Group Holdings, Inc. | 7.027 | 225,17 | 686 | 223,11 | ||||
| 2025-08-11 | 13F | Wealthspire Advisors, LLC | 3.448 | 337 | ||||||
| 2025-07-16 | 13F | Paragon Capital Management Ltd | 2.064 | 201 | ||||||
| 2025-07-25 | 13F | Concurrent Investment Advisors, LLC | 14.898 | 5,31 | 1.454 | 4,45 | ||||
| 2025-08-12 | 13F | Weaver Consulting Group | 2.248 | 219 | ||||||
| 2025-08-13 | 13F | Guggenheim Capital Llc | 17.154 | 1.674 | ||||||
| 2025-07-14 | 13F | Sweeney & Michel, Llc | 5.176 | 57,61 | 502 | 59,55 | ||||
| 2025-07-23 | 13F | Joel Isaacson & Co., LLC | 2.675 | 261 | ||||||
| 2025-08-14 | 13F | Hrt Financial Lp | 0 | -100,00 | 0 | |||||
| 2025-08-15 | 13F | Morgan Stanley | 1.942 | 190 | ||||||
| 2025-07-16 | 13F | Blue Oak Capital, LLC | 19.091 | 8,07 | 1.863 | 7,19 | ||||
| 2025-07-31 | 13F | Oppenheimer & Co Inc | 6.792 | 663 | ||||||
| 2025-07-08 | 13F | Zrc Wealth Management, Llc | 0 | -100,00 | 0 | |||||
| 2025-08-07 | 13F | Allworth Financial LP | 3.903 | 390.200,00 | 381 | |||||
| 2025-08-12 | 13F | Jpmorgan Chase & Co | 19.031 | 8,10 | 1.858 | 7,22 | ||||
| 2025-08-14 | 13F | Raymond James Financial Inc | 21.369 | 13,88 | 2.086 | 12,95 | ||||
| 2025-08-14 | 13F | Fort Point Capital Partners LLC | 18.478 | 5,90 | 1.804 | 5,07 | ||||
| 2025-05-15 | 13F | Citadel Advisors Llc | 0 | -100,00 | 0 | |||||
| 2025-07-24 | 13F | NavPoint Financial, Inc. | 3.207 | 313 | ||||||
| 2025-08-04 | 13F | Spire Wealth Management | 20 | 0,00 | 2 | 0,00 | ||||
| 2025-08-14 | 13F | Aqr Capital Management Llc | 9.281 | 119,10 | 906 | 117,55 | ||||
| 2025-08-14 | 13F | Royal Bank Of Canada | 1.819 | -93,85 | 178 | -93,89 | ||||
| 2025-07-10 | 13F | Wedmont Private Capital | 70.763 | 5,38 | 6.889 | 6,96 | ||||
| 2025-08-14 | 13F | Susquehanna International Group, Llp | 68.306 | 6.667 | ||||||
| 2025-08-11 | 13F | United Capital Financial Advisers, Llc | 5.624 | 549 | ||||||
| 2025-08-12 | 13F | Proequities, Inc. | 0 | 0 | ||||||
| 2025-07-30 | 13F | Retirement Planning Group | 6.626 | -29,71 | 647 | -30,31 | ||||
| 2025-08-08 | 13F | Meridian Wealth Management, LLC | 5.375 | 9,58 | 525 | 8,71 | ||||
| 2025-08-13 | 13F | Northwestern Mutual Wealth Management Co | 2.399 | 234 | ||||||
| 2025-08-11 | 13F | Core Wealth Partners LLC | 2.639 | 0,00 | 258 | -0,77 | ||||
| 2025-08-06 | 13F | Climber Capital SA | 3.110 | 0,00 | 302 | 13,16 | ||||
| 2025-07-18 | 13F | First Pacific Financial | 1.547 | 151 | ||||||
| 2025-08-14 | 13F | Quantinno Capital Management LP | 2.850 | 0,00 | 278 | -0,71 | ||||
| 2025-04-25 | 13F | Ameritas Advisory Services, LLC | 0 | -100,00 | 0 | |||||
| 2025-08-06 | 13F | Commonwealth Equity Services, Llc | 29.905 | 68,00 | 3 | 100,00 | ||||
| 2025-07-17 | 13F | Luminvest Wealth Management LLC | 11.904 | 1.162 | ||||||
| 2025-08-11 | 13F | Elequin Capital Lp | 0 | -100,00 | 0 | |||||
| 2025-08-07 | 13F | Brio Consultants, LLC | 59.384 | 12,20 | 5.796 | 11,29 | ||||
| 2025-07-10 | 13F | Financial Management Network Inc | 20.844 | -28,09 | 2.034 | -27,50 | ||||
| 2025-07-31 | 13F | Opes Wealth Management LLC | 0 | -100,00 | 0 | |||||
| 2025-08-15 | 13F | WFA of San Diego, LLC | 590 | 58 | ||||||
| 2025-08-07 | 13F | PFG Advisors | 0 | -100,00 | 0 | |||||
| 2025-07-31 | 13F | Ndwm Llc | 24.955 | 2.436 | ||||||
| 2025-05-15 | 13F | JDM Financial Group LLC | 0 | -100,00 | 0 | |||||
| 2025-07-10 | 13F | Wealth Enhancement Advisory Services, Llc | 5.045 | 0,00 | 492 | -0,81 | ||||
| 2025-07-23 | 13F | Values Added Financial LLC | 0 | -100,00 | 0 | |||||
| 2025-08-13 | 13F | Twin Peaks Wealth Advisors, LLC | 2.389 | 233 | ||||||
| 2025-08-13 | 13F | EverSource Wealth Advisors, LLC | 253 | 0,80 | 25 | 0,00 | ||||
| 2025-08-08 | 13F | Creative Planning | 52.635 | 230,79 | 5.138 | 228,24 | ||||
| 2025-08-13 | 13F | Cerity Partners LLC | 7.195 | 702 | ||||||
| 2025-08-06 | 13F | Golden State Wealth Management, LLC | 505 | 0,00 | 49 | 0,00 | ||||
| 2025-07-17 | 13F | Albion Financial Group /ut | 625 | 47,06 | 61 | 48,78 | ||||
| 2025-07-28 | 13F | Compass Advisory Group LLC | 0 | -100,00 | 0 | |||||
| 2025-08-07 | 13F | Evoke Wealth, Llc | 26.042 | 24,04 | 2.542 | 23,05 | ||||
| 2025-07-29 | 13F | Ariston Services Group | 5.444 | 0,42 | 531 | -0,38 | ||||
| 2025-08-13 | 13F | North Berkeley Wealth Management, LLC | 8.322 | 0,00 | 812 | -0,73 | ||||
| 2025-08-14 | 13F | Old Mission Capital Llc | 0 | -100,00 | 0 | |||||
| 2025-08-14 | 13F | Sand Hill Global Advisors, LLC | 8.451 | 825 | ||||||
| 2025-08-14 | 13F | Jane Street Group, Llc | 8.579 | -82,16 | 837 | -82,31 | ||||
| 2025-08-11 | 13F | Bell Investment Advisors, Inc | 37.108 | 2.783,29 | 3.622 | 2.774,60 | ||||
| 2025-07-09 | 13F | Catalyst Private Wealth, Llc | 2.465 | 241 | ||||||
| 2025-08-06 | 13F | Wedbush Securities Inc | 13.796 | 2,10 | 1 | 0,00 | ||||
| 2025-07-23 | 13F | Roberts Wealth Advisors, LLC | 0 | -100,00 | 0 | |||||
| 2025-08-11 | 13F | Root Financial Partners, LLC | 12.418 | 46,40 | 1.212 | 45,32 | ||||
| 2025-07-23 | 13F | Steel Peak Wealth Management LLC | 22.245 | -18,80 | 2.171 | -19,44 | ||||
| 2025-07-30 | 13F | Blume Capital Management, Inc. | 2.500 | 0,00 | 244 | -0,81 | ||||
| 2025-07-18 | 13F | TPG Advisors LLC | 4.006 | 0,00 | 391 | -0,76 | ||||
| 2025-08-12 | 13F | Martin Worley Group | 2.935 | 286 | ||||||
| 2025-07-09 | 13F | Keystone Wealth Services, LLC | 5.500 | -2,60 | 537 | -3,42 | ||||
| 2025-08-12 | 13F | LPL Financial LLC | 64.633 | 627,93 | 6.309 | 622,57 | ||||
| 2025-08-15 | 13F | Captrust Financial Advisors | 154.216 | 33,46 | 15.053 | 32,40 | ||||
| 2025-08-26 | 13F | Nautilus Advisors LLC | 4.341 | 2,38 | 424 | 1,44 | ||||
| 2025-05-13 | 13F | Bridgewealth Advisory Group, LLC | 0 | -100,00 | 0 | |||||
| 2025-08-14 | 13F | Diversify Advisory Services, LLC | 19.805 | 1.930 | ||||||
| 2025-07-17 | 13F | Elser Financial Planning, Inc | 3.890 | 377 | ||||||
| 2025-07-10 | 13F | Hurlow Wealth Management Group, Inc. | 3.011 | 294 |