Grundlæggende statistik
| Institutionelle aktier (lange) | 218.279.284 - 94,33% (ex 13D/G) - change of -62,88MM shares -22,28% MRQ |
| Institutionel værdi (lang) | $ 3.707.895 USD ($1000) |
Institutionelt ejerskab og aktionærer
Viavi Solutions Inc. (US:VIAV) har 412 institutionelle ejere og aktionærer, der har indsendt 13D/G- eller 13F-formularer til Securities Exchange Commission (SEC). Disse institutioner har i alt 218,279,284 aktier. Største aktionærer omfatter BlackRock, Inc., Vanguard Group Inc, Capital World Investors, Wellington Management Group Llp, State Street Corp, Arrowstreet Capital, Limited Partnership, Geode Capital Management, Llc, Dimensional Fund Advisors Lp, Schroder Investment Management Group, and Morgan Stanley .
Viavi Solutions Inc. (NasdaqGS:VIAV) institutionel ejerskabsstruktur viser aktuelle positioner i virksomheden efter institutioner og fonde, samt seneste ændringer i positionsstørrelse. Større aktionærer kan omfatte individuelle investorer, investeringsforeninger, hedgefonde eller institutioner. Skema 13D angiver, at investoren besidder (eller besidder) mere end 5 % af virksomheden og har til hensigt (eller har til hensigt at) aktivt at forfølge en ændring i forretningsstrategi. Skema 13G indikerer en passiv investering på over 5%.
The share price as of April 17, 2026 is 44,14 / share. Previously, on April 21, 2025, the share price was 9,67 / share. This represents an increase of 356,41% over that period.

Fondens stemningsscore
Fund Sentiment Score (fka Ownership Accumulation Score) finder de aktier, der bliver mest købt af fonde. Det er resultatet af en sofistikeret, multi-faktor kvantitativ model, der identificerer virksomheder med de højeste niveauer af institutionel akkumulering. Scoringsmodellen bruger en kombination af den samlede stigning i oplyste ejere, ændringerne i porteføljeallokeringer i disse ejere og andre målinger. Tallet går fra 0 til 100, hvor højere tal indikerer et højere niveau af akkumulering for sine jævnaldrende, og 50 er gennemsnittet.
Opdateringsfrekvens: Dagligt
Se Ownership Explorer, som giver en liste over højest rangerende virksomheder.
AI+ Ask Fintel’s AI assistant about Viavi Solutions Inc..
Select a question to share a public post with an AI-crafted answer.
Thinking of good questions…
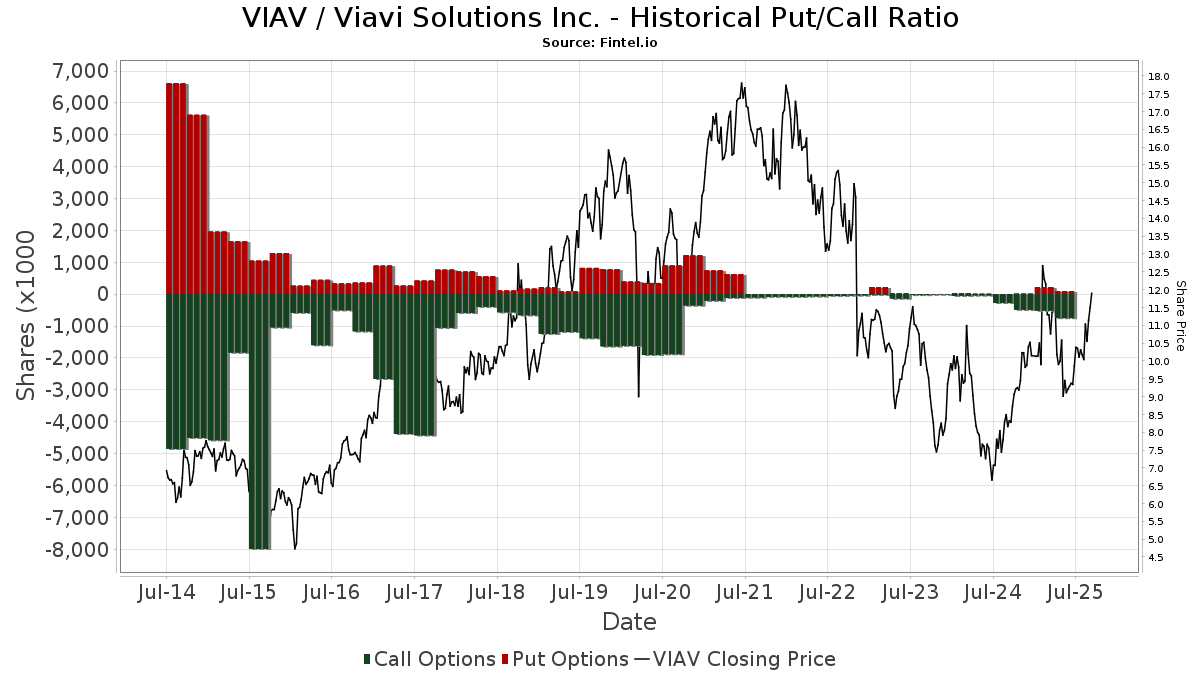
Institutionel Put/Call-forhold
Ud over at indberette standardaktie- og gældsudstedelser skal institutter med mere end 100 mill. aktiver under forvaltning også oplyse deres put- og call-optionsbeholdninger. Da salgsoptioner generelt indikerer negativ stemning, og købsoptioner indikerer positiv stemning, kan vi få en fornemmelse af den overordnede institutionelle stemning ved at plotte forholdet mellem put og kald. Diagrammet til højre viser det historiske put/call-forhold for dette instrument.
Brug af Put/Call Ratio som en indikator for investorernes stemning overvinder en af de vigtigste mangler ved at bruge totalt institutionelt ejerskab, som er, at en betydelig mængde af aktiver under forvaltning investeres passivt for at spore indekser. Passivt forvaltede fonde køber typisk ikke optioner, så indikatoren for put/call-forholdet følger mere nøje følelsen af aktivt forvaltede fonde.
13D/G-arkivering
Vi præsenterer 13D/G ansøgninger separat fra 13F ansøgninger på grund af den forskellige behandling af SEC. 13D/G-ansøgninger kan indgives af grupper af investorer (med én ledende), hvorimod 13F-ansøgninger ikke kan. Dette resulterer i situationer, hvor en investor kan indsende en 13D/G, der rapporterer én værdi for de samlede aktier (der repræsenterer alle de aktier, der ejes af investorgruppen), men derefter indsender en 13F, der rapporterer en anden værdi for de samlede aktier (der udelukkende repræsenterer deres egne) ejendomsret). Det betyder, at aktieejerskab af 13D/G-arkiver og 13F-arkiveringer ofte ikke er direkte sammenlignelige, så vi præsenterer dem separat.
Bemærk: Fra den 16. maj 2021 viser vi ikke længere ejere, der ikke har indsendt en 13D/G inden for det seneste år. Tidligere viste vi den fulde historie af 13D/G-arkiver. Generelt skal enheder, der er forpligtet til at indgive 13D/G-ansøgninger, indgive mindst årligt, før de indsender en afsluttende ansøgning. Dog forlader fonde nogle gange positioner uden at indsende en afsluttende ansøgning (dvs. de afvikler), så visning af den fulde historie resulterede nogle gange i forvirring om det nuværende ejerskab. For at undgå forvirring viser vi nu kun 'aktuelle' ejere - det vil sige - ejere, der har anmeldt inden for det seneste år.
Upgrade to unlock premium data.
| Fil dato | Form | Investor | Forrige Aktier |
Seneste Aktier |
Δ Aktier (Procent) |
Ejendomsret (Procent) |
Δ Ejerskab (Procent) |
|
|---|---|---|---|---|---|---|---|---|
| 2026-03-27 | VANGUARD GROUP INC | 31,423,731 | 0 | -100.00 | 0.00 | -100.00 | ||
| 2026-02-17 | T. Rowe Price Investment Management, Inc. | 11,228,680 | 8,497,432 | -24.32 | 3.80 | -24.00 | ||
| 2026-02-10 | WELLINGTON MANAGEMENT GROUP LLP | 14,415,112 | 10,999,595 | -23.69 | 4.90 | -24.62 | ||
| 2025-04-30 | BlackRock, Inc. | 36,202,003 | 33,864,710 | -6.46 | 15.20 | -6.75 |
13F og NPORT arkivering
Detaljer om 13F-arkivering er gratis. Detaljer om NP-ansøgninger kræver et premium-medlemskab. Grønne rækker angiver nye positioner. Røde rækker angiver lukkede positioner. Klik på linket ikon for at se den fulde transaktionshistorik.
Opgrader
for at låse premium-data op og eksportere til Excel ![]() .
.
| Fil dato | Kilde | Investor | Type | Gennemsnitlig pris (Øst) |
Aktier | Δ Aktier (%) |
Rapporteret Værdi ($1000) |
Δ Værdi (%) |
Port Alloc (%) |
|
|---|---|---|---|---|---|---|---|---|---|---|
| 2026-02-17 | 13F | Trexquant Investment LP | 79.437 | 1.416 | ||||||
| 2026-02-11 | 13F | Fox Run Management, L.l.c. | 0 | -100,00 | 0 | |||||
| 2025-11-12 | 13F | Group One Trading, L.p. | 0 | -100,00 | 0 | -100,00 | ||||
| 2026-02-02 | 13F | Nkcfo Llc | 0 | -100,00 | 0 | |||||
| 2026-04-13 | 13F | JCIC Asset Management Inc. | 1.137 | 0,00 | 38 | 85,00 | ||||
| 2026-02-12 | 13F | Quadrant Capital Group Llc | 29.635 | 0,49 | 528 | 41,18 | ||||
| 2026-02-02 | 13F | Strs Ohio | 8.900 | 159 | ||||||
| 2026-02-12 | 13F | Hollencrest Capital Management | 58 | 0,00 | 1 | |||||
| 2026-02-13 | 13F | Walleye Capital LLC | Call | 114.100 | 2.033 | |||||
| 2026-02-13 | 13F | Walleye Capital LLC | Put | 23.400 | 417 | |||||
| 2025-11-06 | 13F | Ameritas Advisory Services, LLC | 0 | -100,00 | 0 | |||||
| 2026-02-13 | 13F | Walleye Capital LLC | 1 | 0 | ||||||
| 2026-02-13 | 13F | Delos Wealth Advisors, LLC | 0 | -100,00 | 0 | |||||
| 2026-02-17 | 13F | Engineers Gate Manager LP | 203.527 | 3.627 | ||||||
| 2026-01-30 | 13F | Torren Management, LLC | 44 | 1 | ||||||
| 2026-02-13 | 13F | Public Employees Retirement Association Of Colorado | 26.557 | 0,00 | 0 | |||||
| 2026-01-30 | 13F | Bogart Wealth, LLC | 12 | 0,00 | 0 | |||||
| 2025-11-07 | 13F | CenterBook Partners LP | 88.212 | 1.119 | ||||||
| 2026-02-17 | 13F | Ameriprise Financial Inc | 3.754.289 | 139,11 | 66.901 | 235,78 | ||||
| 2026-02-17 | 13F | Kemnay Advisory Services Inc. | 7.503 | 134 | ||||||
| 2026-02-17 | 13F | Guggenheim Capital Llc | 47.128 | 61,36 | 840 | 126,76 | ||||
| 2026-02-17 | 13F | CWM Advisors, LLC | 26.092 | -69,78 | 465 | -57,63 | ||||
| 2026-02-12 | 13F | Castleark Management Llc | 349.370 | 6.226 | ||||||
| 2026-02-13 | 13F | Rhumbline Advisers | 603.577 | -8,15 | 10.756 | 28,97 | ||||
| 2026-02-12 | 13F | Renaissance Technologies Llc | 1.125.588 | 12,30 | 20.058 | 57,69 | ||||
| 2026-02-05 | 13F | HFM Investment Advisors, LLC | 10 | 0,00 | 0 | |||||
| 2026-02-17 | 13F | Amundi | 37.154 | -7,02 | 662 | 29,80 | ||||
| 2026-02-05 | 13F | Thrivent Financial For Lutherans | 153.365 | -4,78 | 3 | 0,00 | ||||
| 2026-02-10 | 13F | Bowen Hanes & Co Inc | 1.870.000 | 33 | ||||||
| 2026-02-10 | 13F/A | Northwestern Mutual Wealth Management Co | 1.250 | 0,00 | 22 | 46,67 | ||||
| 2026-02-13 | 13F | JustInvest LLC | 17.228 | 23,39 | 307 | 73,45 | ||||
| 2026-02-02 | 13F | Principal Financial Group Inc | 1.067.242 | -1,12 | 19.018 | 38,86 | ||||
| 2026-04-07 | 13F | Retirement Wealth Solutions LLC | 27 | -73,79 | 1 | -100,00 | ||||
| 2026-04-08 | 13F | NorthCrest Asset Manangement, LLC | 28.201 | -0,15 | 1.040 | 103,52 | ||||
| 2026-02-12 | 13F | Pitcairn Co | 0 | -100,00 | 0 | |||||
| 2026-02-11 | 13F | Group One Trading, L.p. | Put | 22.400 | 5.500,00 | 399 | 7.880,00 | |||
| 2026-02-12 | 13F | MetLife Investment Management, LLC | 119.393 | -6,28 | 2.128 | 31,62 | ||||
| 2026-02-17 | 13F | Lazard Asset Management Llc | 310.101 | 9,60 | 5.526 | 53,93 | ||||
| 2026-01-28 | 13F | Teacher Retirement System Of Texas | 0 | -100,00 | 0 | |||||
| 2026-02-17 | 13F | Cetera Investment Advisers | 86.263 | -17,97 | 1.537 | 15,22 | ||||
| 2026-02-11 | 13F | Group One Trading, L.p. | Call | 181.600 | 38,31 | 3.236 | 94,24 | |||
| 2026-02-02 | 13F | Oppenheimer Asset Management Inc. | 16.143 | 288 | ||||||
| 2026-02-17 | 13F | Oberweis Asset Management Inc/ | 508.100 | 9.054 | ||||||
| 2026-02-17 | 13F | Silvercrest Asset Management Group Llc | 787.117 | 41,39 | 14.026 | 98,56 | ||||
| 2026-02-17 | 13F | Weiss Asset Management LP | 89.346 | 1.592 | ||||||
| 2026-02-17 | 13F | Janus Henderson Group Plc | 101.306 | 0,00 | 1.806 | 40,36 | ||||
| 2026-01-21 | 13F | Flagship Harbor Advisors, Llc | 12 | 0 | ||||||
| 2026-02-12 | 13F | Andra AP-fonden | 0 | -100,00 | 0 | |||||
| 2026-02-12 | 13F | Ankerstar Wealth, LLC | 35 | 1 | ||||||
| 2026-02-17 | 13F | Polar Asset Management Partners Inc. | 187.363 | 3.339 | ||||||
| 2026-02-03 | 13F | Mitsubishi UFJ Kokusai Asset Management Co., Ltd. | 363 | 0,00 | 7 | 50,00 | ||||
| 2026-02-12 | 13F | State Board Of Administration Of Florida Retirement System | 64.730 | -27,89 | 1.153 | 1,23 | ||||
| 2026-01-28 | 13F | Salomon & Ludwin, LLC | 1.333 | 5,71 | 24 | 50,00 | ||||
| 2026-02-18 | 13F | State of Tennessee, Treasury Department | 86.904 | 4,00 | 2.126 | 100,47 | ||||
| 2026-02-13 | 13F | Great West Life Assurance Co /can/ | 191.574 | -15,99 | 3 | 50,00 | ||||
| 2026-01-26 | 13F/A | Phocas Financial Corp. | 211.672 | -24,38 | 3.772 | 3,80 | ||||
| 2026-02-04 | 13F | Fourth Dimension Wealth, LLC | 12 | 0,00 | 0 | |||||
| 2025-11-14 | 13F | Point72 Europe (London) LLP | 2.268 | 29 | ||||||
| 2025-11-14 | 13F | Point72 (DIFC) Ltd | 13.060 | 166 | ||||||
| 2026-04-08 | 13F | DiNuzzo Private Wealth, Inc. | 34 | -8,11 | 1 | |||||
| 2026-01-29 | 13F | Nbc Securities, Inc. | 0 | -100,00 | 0 | |||||
| 2026-02-17 | 13F | Two Sigma Advisers, Lp | 653.700 | 2.612,45 | 11.649 | 3.719,02 | ||||
| 2026-02-13 | 13F | SRS Capital Advisors, Inc. | 11.616 | 1.277,94 | 1 | -90,00 | ||||
| 2026-02-05 | 13F | Bessemer Group Inc | 233.200 | 1.839,94 | 4 | |||||
| 2026-02-12 | 13F | Principal Securities, Inc. | 0 | -100,00 | 0 | -100,00 | ||||
| 2026-02-17 | 13F | Polar Capital Holdings Plc | 836.504 | 14.907 | ||||||
| 2026-04-17 | 13F | Vermillion Wealth Management, Inc. | 14 | 0 | ||||||
| 2026-02-12 | 13F | Ensign Peak Advisors, Inc | 16.150 | -48,73 | 288 | -28,07 | ||||
| 2025-10-24 | 13F | Hemington Wealth Management | 319 | 11,15 | 0 | |||||
| 2026-02-12 | 13F | Grey Fox Wealth Advisors, LLC | 0 | -100,00 | 0 | |||||
| 2026-02-17 | 13F | Occudo Quantitative Strategies Lp | 64.968 | 28,05 | 1.158 | 79,94 | ||||
| 2025-11-14 | 13F | Marex Group plc | 0 | -100,00 | 0 | -100,00 | ||||
| 2026-02-13 | 13F | Quarry LP | 711 | 13 | ||||||
| 2026-03-03 | 13F/A | Caitong International Asset Management Co., Ltd | 9.469 | 169 | ||||||
| 2026-01-27 | 13F | TD Waterhouse Canada Inc. | 9.068 | 0,03 | 162 | 38,79 | ||||
| 2026-04-09 | 13F | Tompkins Financial Corp | 0 | -100,00 | 0 | |||||
| 2026-01-30 | 13F | New York State Teachers Retirement System | 260.277 | -3,02 | 5 | 33,33 | ||||
| 2026-02-17 | 13F | Hancock Whitney Corp | 26.480 | 5,17 | 472 | 47,65 | ||||
| 2026-02-17 | 13F | Millennium Management Llc | 2.136.891 | 83,69 | 38.079 | 157,95 | ||||
| 2026-02-13 | 13F | Schroder Investment Management Group | 4.759.016 | -21,26 | 85.710 | 11,75 | ||||
| 2026-01-21 | 13F | Sound Income Strategies, LLC | 405 | 8 | ||||||
| 2026-02-10 | 13F | Norges Bank | 573.802 | 10.225 | ||||||
| 2026-02-10 | 13F | State of Wyoming | 1.884 | 34 | ||||||
| 2026-02-12 | 13F | Cloud Capital Management, LLC | 0 | -100,00 | 0 | |||||
| 2026-02-06 | 13F | Covestor Ltd | 2.260 | -37,76 | 0 | |||||
| 2026-02-11 | 13F | Rise Advisors, LLC | 0 | -100,00 | 0 | |||||
| 2026-02-13 | 13F | Morgan Stanley | 4.050.927 | 48,19 | 72.188 | 108,10 | ||||
| 2026-02-17 | 13F | Fmr Llc | 598.600 | 26,14 | 10.667 | 77,13 | ||||
| 2026-01-28 | 13F | Arizona State Retirement System | 62.042 | -6,08 | 1.106 | 31,86 | ||||
| 2026-02-13 | 13F | Barclays Plc | 351.419 | 7,13 | 6.262 | 50,46 | ||||
| 2026-02-18 | 13F | Mackenzie Financial Corp | 85.009 | -11,86 | 1.528 | 24,94 | ||||
| 2026-02-02 | 13F | Eq Wealth Advisors, Llc | 125 | 2 | ||||||
| 2026-02-13 | 13F | Sterling Capital Management LLC | 1.437 | 167,60 | 26 | 316,67 | ||||
| 2026-02-13 | 13F | Pinnacle Wealth Planning Services, Inc. | 3.879 | 69 | ||||||
| 2026-02-13 | 13F | Pathstone Holdings, LLC | 82.676 | 16,95 | 1.473 | 64,21 | ||||
| 2026-02-13 | 13F | Police & Firemen's Retirement System of New Jersey | 60.810 | -2,20 | 1.084 | 37,26 | ||||
| 2026-02-13 | 13F | Herald Investment Management Ltd | 275.000 | 4.900 | ||||||
| 2026-02-10 | 13F | MidAtlantic Capital Management, Inc. | 5 | 0 | ||||||
| 2026-02-11 | 13F | Financiere des Professionnels - Fonds d,investissement inc. | 20.217 | 0,00 | 360 | 40,63 | ||||
| 2026-02-13 | 13F | Edgestream Partners, L.P. | 99.351 | -70,55 | 1.770 | -58,64 | ||||
| 2026-02-12 | 13F | Voya Investment Management Llc | 218.279 | -25,48 | 3.890 | 4,66 | ||||
| 2026-04-14 | 13F | Bay Harbor Wealth Management, LLC | 35 | 45,83 | 1 | |||||
| 2026-02-06 | 13F | Pnc Financial Services Group, Inc. | 36.413 | -1,68 | 649 | 38,17 | ||||
| 2026-02-19 | 13F | Invesco Ltd. | 3.809.513 | 115,98 | 67.886 | 203,30 | ||||
| 2026-02-20 | 13F | Sunbelt Securities, Inc. | 1 | 0,00 | 0 | |||||
| 2026-02-03 | 13F | Sequoia Financial Advisors, LLC | 14.773 | 29,74 | 263 | 82,64 | ||||
| 2026-04-08 | 13F | Thompson Investment Management, Inc. | 219.851 | -41,00 | 7.317 | 10,18 | ||||
| 2026-02-17 | 13F | Royal Bank Of Canada | 123.045 | -20,65 | 2.193 | 11,49 | ||||
| 2026-01-28 | 13F | Klp Kapitalforvaltning As | 48.000 | 0,00 | 855 | 40,39 | ||||
| 2026-02-17 | 13F | Brevan Howard Capital Management LP | 12.285 | -83,01 | 219 | -76,23 | ||||
| 2026-04-07 | 13F | Carolina Wealth Advisors, LLC | 465 | 15 | ||||||
| 2026-02-17 | 13F | Raymond James Financial Inc | 420.292 | 23,96 | 7.490 | 74,08 | ||||
| 2026-02-12 | 13F | New York State Common Retirement Fund | 116.973 | 65,22 | 2.084 | 132,07 | ||||
| 2026-02-13 | 13F | Caxton Associates Llp | 115.744 | 390,88 | 2.063 | 589,63 | ||||
| 2025-11-07 | 13F | Sierra Ocean, Llc | 0 | -100,00 | 0 | |||||
| 2026-01-29 | 13F | Cornerstone Investment Partners, LLC | 13.557 | 0,07 | 242 | 40,94 | ||||
| 2026-02-11 | 13F | 111 Capital | 0 | -100,00 | 0 | -100,00 | ||||
| 2026-02-13 | 13F | Cramer Rosenthal Mcglynn Llc | 156.692 | 2.792 | ||||||
| 2026-02-06 | 13F | Tensor Edge Capital, LLC | 150.000 | 2.673 | ||||||
| 2026-02-17 | 13F | Qube Research & Technologies Ltd | 415.020 | -54,81 | 7.396 | -36,55 | ||||
| 2026-02-17 | 13F | State Of Wisconsin Investment Board | 204.316 | 201,54 | 3.641 | 323,75 | ||||
| 2026-04-14 | 13F | Beacon Investment Advisory Services, Inc. | 29 | 1 | ||||||
| 2026-02-13 | 13F | Y-Intercept (Hong Kong) Ltd | 182.380 | -26,53 | 3.250 | 3,21 | ||||
| 2026-04-13 | 13F | IFP Advisors, Inc | 2.874 | 1.212,33 | 96 | 3.066,67 | ||||
| 2026-04-09 | 13F | Moody National Bank Trust Division | 0 | -100,00 | 0 | |||||
| 2026-02-09 | 13F | Geode Capital Management, Llc | 5.351.211 | 0,39 | 95.373 | 40,98 | ||||
| 2026-02-12 | 13F | Xponance, Inc. | 17.481 | 0,38 | 312 | 41,36 | ||||
| 2026-01-29 | 13F | Concurrent Investment Advisors, LLC | 95.107 | 1.695 | ||||||
| 2026-04-17 | 13F | Bell Investment Advisors, Inc | 371 | 0,00 | 12 | 100,00 | ||||
| 2026-02-17 | 13F | Summit Partners Public Asset Management, Llc | 1.599.365 | -20,94 | 28.501 | 11,02 | ||||
| 2026-02-17 | 13F | Defiance ETFs, LLC | 822.781 | 14.818 | ||||||
| 2026-01-13 | 13F | Mather Group, Llc. | 0 | -100,00 | 0 | |||||
| 2026-02-11 | 13F | Los Angeles Capital Management Llc | 109.529 | -0,51 | 1.873 | 34,00 | ||||
| 2026-02-09 | 13F | Jefferies Financial Group Inc. | 101.199 | 1.803 | ||||||
| 2026-02-13 | 13F | Neuberger Berman Group LLC | 192.143 | -5,23 | 3.424 | 33,09 | ||||
| 2026-02-13 | 13F | Public Sector Pension Investment Board | 0 | -100,00 | 0 | |||||
| 2026-02-13 | 13F | Neo Ivy Capital Management | 0 | -100,00 | 0 | |||||
| 2026-03-04 | 13F | SHP Wealth Management | 2 | 0 | ||||||
| 2026-01-12 | 13F | Rialto Wealth Management, LLC | 20 | 53,85 | 0 | |||||
| 2026-02-10 | 13F | Quantbot Technologies LP | 0 | -100,00 | 0 | |||||
| 2026-02-17 | 13F | T. Rowe Price Investment Management, Inc. | 3.340.431 | -70,25 | 60 | -58,45 | ||||
| 2026-02-02 | 13F | Qrg Capital Management, Inc. | 39.785 | 2,32 | 709 | 43,61 | ||||
| 2026-02-06 | 13F | Larson Financial Group LLC | 2.096 | 3,66 | 37 | 48,00 | ||||
| 2026-02-17 | 13F | Creative Planning | 220.553 | 19,62 | 3.930 | 68,02 | ||||
| 2026-02-13 | 13F | Mml Investors Services, Llc | 31.172 | -0,11 | 555 | 40,15 | ||||
| 2026-01-29 | 13F | Vanguard Group Inc | 29.303.129 | -3,01 | 522.182 | 36,20 | ||||
| 2026-01-29 | 13F | Retirement Solution Inc. | 10.400 | 0,00 | 185 | 41,22 | ||||
| 2026-04-13 | 13F | Highland Capital Management, Llc | 13.337 | 444 | ||||||
| 2026-04-17 | 13F | Leeward Investments, LLC - MA | 1.424.272 | -11,27 | 47.400 | 65,72 | ||||
| 2026-01-21 | 13F | Yousif Capital Management, Llc | 60.007 | -12,95 | 1.119 | 27,92 | ||||
| 2026-02-03 | 13F | Mma Asset Management Llc | 0 | -100,00 | 0 | |||||
| 2026-02-11 | 13F | Cookson Peirce & Co Inc | 97.507 | 4,25 | 1.738 | 46,46 | ||||
| 2026-01-29 | 13F | Pictet Asset Management Holding SA | 30.474 | 0,93 | 543 | 41,78 | ||||
| 2026-02-17 | 13F | Aqr Capital Management Llc | 70.726 | 27,95 | 1.260 | 79,74 | ||||
| 2026-02-02 | 13F | Sachetta, LLC | 16 | 0,00 | 0 | |||||
| 2026-02-05 | 13F | Cambridge Investment Research Advisors, Inc. | 76.580 | 440,51 | 1 | |||||
| 2026-02-09 | 13F | White Pine Capital Llc | 75.321 | -2,12 | 1.342 | 37,50 | ||||
| 2026-02-17 | 13F | Balyasny Asset Management Llc | 454.286 | -61,26 | 8.095 | -45,60 | ||||
| 2026-02-12 | 13F | Loomis Sayles & Co L P | 1.269.629 | 22.625 | ||||||
| 2026-04-06 | 13F | Versant Capital Management, Inc | 1.280 | 0,00 | 43 | 90,91 | ||||
| 2026-02-09 | 13F | New Age Alpha Advisors, LLC | 11.810 | 210 | ||||||
| 2026-04-13 | 13F | Salem Investment Counselors Inc | 225 | 7 | ||||||
| 2026-02-11 | 13F | O'shaughnessy Asset Management, Llc | 16.126 | 287 | ||||||
| 2026-02-11 | 13F | GW&K Investment Management, LLC | 2.553.789 | 46 | ||||||
| 2026-01-26 | 13F | Whittier Trust Co | 537 | 0,00 | 10 | 50,00 | ||||
| 2026-02-17 | 13F | Ancora Advisors, LLC | 37 | 1 | ||||||
| 2026-02-10 | 13F | Rothschild Investment Llc | 797 | 0,13 | 14 | 40,00 | ||||
| 2026-02-17 | 13F | Tower Research Capital LLC (TRC) | 6.200 | -13,20 | 110 | 22,22 | ||||
| 2026-04-13 | 13F | St Germain D J Co Inc | 11 | -99,89 | 0 | -100,00 | ||||
| 2026-01-15 | 13F | Nisa Investment Advisors, Llc | 3.353 | -9,55 | 60 | 25,53 | ||||
| 2026-03-12 | 13F/A | Peak6 Llc | 0 | -100,00 | 0 | -100,00 | ||||
| 2026-02-12 | 13F | BlackRock, Inc. | 33.240.965 | 2,06 | 592.354 | 43,32 | ||||
| 2026-02-10 | 13F | Bnp Paribas Arbitrage, Sa | 1.181.705 | 1.198,69 | 21.058 | 1.724,70 | ||||
| 2025-11-07 | 13F | Shell Asset Management Co | 7.535 | -61,09 | 0 | |||||
| 2026-01-23 | 13F | Assetmark, Inc | 3.505 | -16,90 | 62 | 16,98 | ||||
| 2026-02-09 | 13F | Knights of Columbus Asset Advisors LLC | 149.302 | -33,35 | 2.661 | -6,40 | ||||
| 2025-11-14 | 13F | Texas Permanent School Fund | 0 | -100,00 | 0 | |||||
| 2026-04-20 | 13F | Ronald Blue Trust, Inc. | 0 | -100,00 | 0 | |||||
| 2026-02-13 | 13F | Nfj Investment Group, Llc | 207.360 | -8,51 | 3.695 | 28,48 | ||||
| 2026-02-17 | 13F | Bayesian Capital Management, LP | 0 | -100,00 | 0 | |||||
| 2026-04-20 | 13F | Moody Aldrich Partners Llc | 61.582 | 2.049 | ||||||
| 2026-02-17 | 13F | XTX Topco Ltd | 19.774 | -32,78 | 352 | -5,63 | ||||
| 2026-02-13 | 13F | First Trust Advisors Lp | 24.524 | 437 | ||||||
| 2026-02-13 | 13F | Wells Fargo & Company/mn | 877.779 | 10,13 | 15.642 | 54,66 | ||||
| 2026-02-17 | 13F | Citadel Advisors Llc | Put | 59.500 | 1.060 | |||||
| 2026-02-13 | 13F | Clarity Asset Management, Inc. | 100 | 2 | ||||||
| 2026-02-17 | 13F | Citadel Advisors Llc | Call | 397.200 | 99,20 | 7.078 | 179,76 | |||
| 2026-02-12 | 13F | Kovack Advisors, Inc. | 138.810 | -25,13 | 2.500 | 6,25 | ||||
| 2026-02-13 | 13F | Citigroup Inc | 60.777 | -39,61 | 1.083 | -15,19 | ||||
| 2026-02-17 | 13F | Cim Investment Mangement Inc | 28.997 | 0,00 | 517 | 40,60 | ||||
| 2026-02-11 | 13F | Franklin Resources Inc | 120.343 | 2,95 | 2.145 | 44,57 | ||||
| 2026-02-17 | 13F | Capital Fund Management S.a. | Put | 23.900 | 426 | |||||
| 2026-02-17 | 13F | Citadel Advisors Llc | 296.592 | 62,70 | 5.285 | 128,49 | ||||
| 2026-02-04 | 13F | First Eagle Investment Management, LLC | 723.800 | -6,22 | 12.898 | 31,69 | ||||
| 2026-02-11 | 13F | Capital World Investors | 15.620.410 | 4,45 | 278.356 | 46,67 | ||||
| 2026-02-13 | 13F | Victory Capital Management Inc | 2.177.174 | -36,54 | 38.797 | -10,89 | ||||
| 2026-01-22 | 13F | Glass Jacobson Investment Advisors llc | 7 | 0,00 | 0 | |||||
| 2026-01-20 | 13F | Princeton Global Asset Management LLC | 81 | 0,00 | 1 | 0,00 | ||||
| 2026-04-15 | 13F | FNY Investment Advisers, LLC | 0 | -100,00 | 0 | |||||
| 2026-04-20 | 13F | State of Alaska, Department of Revenue | 124.224 | 0,52 | 4 | 100,00 | ||||
| 2026-02-10 | 13F | CIBC Asset Management Inc | 0 | -100,00 | 0 | -100,00 | ||||
| 2026-02-13 | 13F | Nicholas Investment Partners, LP | 124.276 | 2.215 | ||||||
| 2026-02-17 | 13F | Aristeia Capital Llc | 39.498 | 44,74 | 704 | 103,18 | ||||
| 2026-02-13 | 13F | Arrowstreet Capital, Limited Partnership | 6.673.145 | 0,50 | 118.915 | 41,13 | ||||
| 2026-02-13 | 13F | Entropy Technologies, LP | 0 | -100,00 | 0 | |||||
| 2026-02-13 | 13F | Mariner, LLC | 0 | -100,00 | 0 | |||||
| 2026-02-17 | 13F | Public Employees Retirement System Of Ohio | 3.647 | -12,27 | 65 | 23,08 | ||||
| 2026-02-11 | 13F | LPL Financial LLC | 98.125 | 34,78 | 1.749 | 89,38 | ||||
| 2026-02-17 | 13F | Divisar Capital Management LLC | 190.805 | 90,81 | 3.400 | 167,93 | ||||
| 2026-02-13 | 13F | Sirios Capital Management L P | 154.161 | -34,84 | 2.747 | -8,49 | ||||
| 2026-02-17 | 13F | Advisor Group Holdings, Inc. | 139.042 | 572,42 | 2.478 | 852,69 | ||||
| 2026-02-13 | 13F | Kestra Advisory Services, LLC | 5.068 | 90 | ||||||
| 2026-02-10 | 13F | Bank of New York Mellon Corp | 2.167.184 | -8,75 | 38.619 | 28,14 | ||||
| 2026-02-11 | 13F | Gilpin Wealth Management, Llc | 18 | 0 | ||||||
| 2026-02-17 | 13F | Ophir Asset Management Pty Ltd | 629.466 | -33,38 | 11.217 | -6,45 | ||||
| 2026-01-29 | 13F | Sanctuary Advisors, LLC | 11.007 | 0,14 | 196 | 41,01 | ||||
| 2026-02-13 | 13F | MAI Capital Management | 1.524 | 72,01 | 27 | 145,45 | ||||
| 2025-11-20 | 13F/A | BRYN MAWR TRUST Co | 0 | -100,00 | 0 | -100,00 | ||||
| 2026-02-18 | 13F | Vident Advisory, LLC | 23.017 | 410 | ||||||
| 2026-02-10 | 13F | Intech Investment Management Llc | 109.258 | 29,12 | 1.947 | 81,36 | ||||
| 2026-04-10 | 13F | Abound Wealth Management | 6 | -66,67 | 0 | |||||
| 2026-01-14 | 13F | ORG Partners LLC | 40 | 1 | ||||||
| 2026-02-17 | 13F | Dean Investment Associates, Llc | 325.544 | 33,82 | 5.801 | 87,92 | ||||
| 2026-01-21 | 13F | Greenleaf Trust | 17.500 | 0,74 | 312 | 41,36 | ||||
| 2026-02-17 | 13F | Tudor Investment Corp Et Al | Put | 16.500 | 294 | |||||
| 2026-02-17 | 13F | Tudor Investment Corp Et Al | 401.104 | 7.148 | ||||||
| 2025-11-14 | 13F | Walleye Trading LLC | 0 | -100,00 | 0 | -100,00 | ||||
| 2026-02-17 | 13F | Tudor Investment Corp Et Al | Call | 26.600 | 474 | |||||
| 2026-04-14 | 13F | Moisand Fitzgerald Tamayo, LLC | 154 | 0,00 | 5 | 150,00 | ||||
| 2026-02-13 | 13F | Umb Bank N A/mo | 2.187 | 3,06 | 39 | 46,15 | ||||
| 2026-01-23 | 13F | Optima Capital Llc | 47 | 1 | ||||||
| 2026-02-13 | 13F | Walleye Trading LLC | Put | 12.100 | 266,67 | 216 | 424,39 | |||
| 2026-04-07 | 13F | Farther Finance Advisors, LLC | 1.391 | 115,99 | 49 | 345,45 | ||||
| 2026-02-13 | 13F | Walleye Trading LLC | Call | 60.500 | 52,78 | 1.078 | 114,74 | |||
| 2026-02-13 | 13F | Verition Fund Management LLC | 126.335 | 36,61 | 2.251 | 91,90 | ||||
| 2026-02-09 | 13F | Huntington National Bank | 1.934 | 0,47 | 34 | 41,67 | ||||
| 2026-02-11 | 13F | Simplex Trading, Llc | 0 | -100,00 | 0 | |||||
| 2026-01-07 | 13F | Harbor Investment Advisory, Llc | 28 | 0,00 | 0 | |||||
| 2026-02-11 | 13F | Picton Mahoney Asset Management | 0 | -100,00 | 0 | -100,00 | ||||
| 2026-02-17 | 13F | Mercer Global Advisors Inc /adv | 11.070 | 2,98 | 197 | 44,85 | ||||
| 2026-01-16 | 13F | Standard Life Aberdeen plc | 1.598.687 | 0,88 | 28.489 | 41,66 | ||||
| 2026-02-11 | 13F | Parallel Advisors, LLC | 45 | 4.400,00 | 1 | |||||
| 2026-02-13 | 13F | First National Bank Of Omaha | 33.461 | -2,13 | 596 | 37,64 | ||||
| 2026-04-17 | 13F | Fifth Third Wealth Advisors LLC | 7.046 | 234 | ||||||
| 2026-01-30 | 13F | State of New Jersey Common Pension Fund D | 130.088 | -34,04 | 2.318 | -7,35 | ||||
| 2026-02-12 | 13F | Cibc World Markets Corp | 14.654 | -46,31 | 261 | -4,74 | ||||
| 2026-01-28 | 13F | Universal- Beteiligungs- und Servicegesellschaft mbH | 11.792 | 210 | ||||||
| 2026-04-13 | 13F | Wolff Wiese Magana Llc | 12 | 0,00 | 0 | |||||
| 2026-02-11 | 13F | Vise Technologies, Inc. | 17.166 | 16,39 | 306 | 63,10 | ||||
| 2026-02-18 | 13F | GWM Advisors LLC | 33 | 32,00 | 1 | |||||
| 2026-02-12 | 13F | Gagnon Securities Llc | 23.992 | 0,00 | 428 | 40,46 | ||||
| 2026-01-22 | 13F | Harwood Advisory Group, LLC | 26 | 0,00 | 0 | |||||
| 2026-02-13 | 13F | Commerce Bank | 31.874 | -16,08 | 568 | 17,88 | ||||
| 2026-02-17 | 13F | Captrust Financial Advisors | 14.163 | -4,97 | 252 | 33,33 | ||||
| 2026-01-26 | 13F | Moran Wealth Management, LLC | 64.850 | 9,30 | 1.156 | 53,59 | ||||
| 2026-04-15 | 13F | Fortitude Family Office, LLC | 138 | 150,91 | 5 | |||||
| 2026-04-20 | 13F | Louisiana State Employees Retirement System | 102.600 | 0,39 | 3.415 | 87,48 | ||||
| 2025-11-21 | 13F/A | CIBC Bancorp USA Inc. | 23.612 | 300 | ||||||
| 2026-02-02 | 13F | Wolverine Asset Management Llc | Put | 200 | 4 | |||||
| 2025-11-06 | 13F | Profund Advisors Llc | 0 | -100,00 | 0 | |||||
| 2026-02-17 | 13F | Credit Agricole S A | 155.566 | 2.772 | ||||||
| 2026-04-08 | 13F | Wealth Enhancement Trust Services, Inc. | 2.600 | -10,34 | 87 | 68,63 | ||||
| 2026-01-14 | 13F | Jfs Wealth Advisors, Llc | 158 | 83,72 | 3 | 100,00 | ||||
| 2026-02-17 | 13F | G2 Investment Partners Management LLC | 825.000 | 84,69 | 14.702 | 159,37 | ||||
| 2026-01-29 | 13F | Virtus Wealth Solutions LLC | 107.500 | 1.916 | ||||||
| 2026-01-20 | 13F | Harbor Capital Advisors, Inc. | 568 | 6,57 | 0 | |||||
| 2026-02-17 | 13F | Westerly Capital Management, Llc | Call | 0 | -100,00 | 0 | ||||
| 2026-02-11 | 13F | Janney Montgomery Scott LLC | 17.052 | -2,64 | 0 | |||||
| 2026-02-05 | 13F | Allworth Financial LP | 2.096 | -0,33 | 37 | 42,31 | ||||
| 2026-02-10 | 13F | Lido Advisors, LLC | 24.555 | 1,96 | 337 | 10,49 | ||||
| 2026-02-14 | 13F | Rockefeller Capital Management L.P. | 2.176 | 5,73 | 39 | 46,15 | ||||
| 2026-02-13 | 13F | Manufacturers Life Insurance Company, The | 0 | -100,00 | 0 | |||||
| 2026-02-17 | 13F | Worth Venture Partners, LLC | 16.525 | 0,00 | 294 | 40,67 | ||||
| 2026-02-13 | 13F | Squarepoint Ops LLC | 550.477 | -20,95 | 9.810 | 11,01 | ||||
| 2026-02-12 | 13F | Counterpoint Mutual Funds LLC | 27.921 | -12,67 | 498 | 22,72 | ||||
| 2026-01-26 | 13F | Whittier Trust Co Of Nevada Inc | 68 | 0,00 | 1 | |||||
| 2025-11-07 | 13F | Putney Financial Group LLC | 0 | -100,00 | 0 | |||||
| 2026-02-17 | 13F | Westerly Capital Management, Llc | 1.150.000 | -42,50 | 20.493 | -19,26 | ||||
| 2026-01-28 | 13F | Geneos Wealth Management Inc. | 68 | 0,00 | 1 | |||||
| 2025-11-14 | 13F | Wolverine Trading, Llc | Call | 11.000 | -9,09 | 138 | 13,22 | |||
| 2026-02-17 | 13F | D. E. Shaw & Co., Inc. | 812.096 | -41,23 | 14.472 | -17,47 | ||||
| 2026-04-09 | 13F | Sanders Morris Harris Llc | 12.500 | 416 | ||||||
| 2026-03-12 | 13F/A | Peak6 Llc | Call | 668.700 | 11.916 | |||||
| 2026-02-13 | 13F | Smartleaf Asset Management LLC | 15.306 | 41,26 | 276 | 103,70 | ||||
| 2025-10-30 | 13F | Twin Peaks Wealth Advisors, LLC | 0 | -100,00 | 0 | |||||
| 2026-04-08 | 13F | Wealth Enhancement Advisory Services, Llc | 53.538 | 47,01 | 935 | 35,56 | ||||
| 2026-02-03 | 13F/A | Bank Of America Corp /de/ | Call | 0 | -100,00 | 0 | -100,00 | |||
| 2026-02-17 | 13F | Ameriflex Group, Inc. | 8 | -50,00 | 0 | |||||
| 2026-02-17 | 13F | Northern Trust Corp | 2.352.264 | -4,18 | 41.917 | 34,55 | ||||
| 2026-02-17 | 13F | Capital Fund Management S.a. | 95.245 | 1.697 | ||||||
| 2026-02-17 | 13F | Bank Of America Corp /de/ | 2.037.304 | -29,28 | 36.305 | -0,69 | ||||
| 2026-01-08 | 13F | True Wealth Design, LLC | 0 | -100,00 | 0 | |||||
| 2026-02-17 | 13F | Parsifal Capital Management, LP | 3.385.700 | 60.333 | ||||||
| 2026-02-04 | 13F | Versor Investments LP | 33.615 | 599 | ||||||
| 2026-02-17 | 13F | Advisory Services Network, LLC | 0 | -100,00 | 0 | |||||
| 2026-02-13 | 13F | Dynamic Technology Lab Private Ltd | 20.057 | 357 | ||||||
| 2026-01-30 | 13F | Us Bancorp \de\ | 11.939 | -23,03 | 213 | 8,16 | ||||
| 2026-02-12 | 13F | Wealthspire Advisors, LLC | 0 | -100,00 | 0 | |||||
| 2026-02-26 | 13F | TD Capital Management LLC | 19 | 0 | ||||||
| 2026-01-21 | 13F | SJS Investment Consulting Inc. | 17 | 0,00 | 0 | |||||
| 2026-01-29 | 13F | Teachers Retirement System Of The State Of Kentucky | 234.108 | -6,16 | 4 | 33,33 | ||||
| 2026-02-09 | 13F | Hartland & Co., LLC | 3 | -94,74 | 0 | |||||
| 2026-02-11 | 13F | Simplex Trading, Llc | Put | 2.300 | -54,00 | 41 | ||||
| 2026-02-11 | 13F | Simplex Trading, Llc | Call | 435.900 | 21,52 | 7.768 | 194.075,00 | |||
| 2026-02-17 | 13F | SageView Advisory Group, LLC | 8.915 | 159 | ||||||
| 2026-02-17 | 13F | Magnetar Financial LLC | 13.178 | 235 | ||||||
| 2026-02-17 | 13F | Mangrove Partners | 14.535 | 259 | ||||||
| 2026-04-08 | 13F | Miracle Mile Advisors, LLC | 6.795 | 226 | ||||||
| 2025-10-27 | 13F | Bangor Savings Bank | 0 | -100,00 | 0 | |||||
| 2026-01-22 | 13F | Financial Consulate, Inc | 50 | 0,00 | 1 | |||||
| 2026-04-07 | 13F | CoreCap Advisors, LLC | 44 | 0,00 | 1 | |||||
| 2026-01-29 | 13F | IMC-Chicago, LLC | Call | 168.200 | 336,88 | 2.997 | 514,14 | |||
| 2026-02-09 | 13F | Atlantic Trust, LLC | 0 | -100,00 | 0 | |||||
| 2026-02-10 | 13F | Axq Capital, Lp | 0 | -100,00 | 0 | |||||
| 2025-11-12 | 13F | Bellwether Advisors, LLC | 0 | -100,00 | 0 | |||||
| 2026-04-17 | 13F | AdvisorNet Financial, Inc | 3.015 | 24,84 | 100 | 132,56 | ||||
| 2026-02-17 | 13F | Quantinno Capital Management LP | 18.077 | 21,01 | 322 | 70,37 | ||||
| 2026-02-17 | 13F | Aquatic Capital Management LLC | 0 | -100,00 | 0 | |||||
| 2026-02-13 | 13F | Parkside Financial Bank & Trust | 173 | 343,59 | 3 | |||||
| 2026-02-05 | 13F | Leuthold Group, Llc | 22.009 | 1,05 | 392 | 42,03 | ||||
| 2026-02-12 | 13F | Campbell & CO Investment Adviser LLC | 0 | -100,00 | 0 | |||||
| 2026-02-13 | 13F | Golden State Wealth Management, LLC | 12 | -14,29 | 0 | |||||
| 2026-02-10 | 13F | Mutual Of America Capital Management Llc | 25.510 | 2,01 | 455 | 43,22 | ||||
| 2026-02-13 | 13F | Headlands Technologies LLC | 56.934 | 142,31 | 1.015 | 240,27 | ||||
| 2026-02-17 | 13F | California State Teachers Retirement System | 210.993 | 2,45 | 3.760 | 43,86 | ||||
| 2026-04-13 | 13F | Creative Financial Designs Inc /adv | 25 | 0,00 | 1 | |||||
| 2026-02-13 | 13F | Charles Schwab Investment Management Inc | 2.935.636 | -4,19 | 52.313 | 34,55 | ||||
| 2026-04-10 | 13F | Country Trust Bank | 37 | 0,00 | 1 | |||||
| 2026-02-17 | 13F | Cinctive Capital Management LP | 139.215 | 2.481 | ||||||
| 2026-04-15 | 13F | Exchange Traded Concepts, Llc | 90 | 3 | ||||||
| 2026-02-13 | 13F | Marshall Wace, Llp | 2.187.600 | 38.983 | ||||||
| 2026-02-13 | 13F | Sei Investments Co | 664.167 | 94,47 | 11.835 | 173,14 | ||||
| 2026-02-17 | 13F | Susquehanna International Group, Llp | Call | 680.800 | -0,84 | 12.132 | 39,24 | |||
| 2026-03-05 | 13F | Bayban | 30 | 1 | ||||||
| 2026-02-10 | 13F | Commonwealth Of Pennsylvania Public School Empls Retrmt Sys | 55.257 | -2,81 | 985 | 36,48 | ||||
| 2026-02-17 | 13F | Susquehanna International Group, Llp | 44.548 | -74,53 | 794 | -64,26 | ||||
| 2026-02-17 | 13F | Susquehanna International Group, Llp | Put | 160.900 | 185,79 | 2.867 | 301,54 | |||
| 2026-04-17 | 13F | Braeburn Wealth Management LLC | 22.555 | 751 | ||||||
| 2026-02-09 | 13F | Legal & General Group Plc | 560.864 | -4,69 | 9.995 | 33,84 | ||||
| 2026-02-17 | 13F | Price T Rowe Associates Inc /md/ | 1.505.528 | -22,78 | 27 | 8,33 | ||||
| 2026-02-17 | 13F | ExodusPoint Capital Management, LP | 0 | -100,00 | 0 | -100,00 | ||||
| 2026-03-11 | 13F | Leonteq Securities AG | 0 | -100,00 | 0 | |||||
| 2026-02-17 | 13F | Capstone Investment Advisors, Llc | 0 | -100,00 | 0 | -100,00 | ||||
| 2026-02-17 | 13F | Alliancebernstein L.p. | 255.184 | -4,20 | 4.547 | 34,53 | ||||
| 2026-02-13 | 13F | Ubs Asset Management Americas Inc | 455.085 | 1,89 | 8.110 | 43,09 | ||||
| 2026-02-12 | 13F | Dimensional Fund Advisors Lp | 4.871.415 | -28,85 | 86.811 | -0,07 | ||||
| 2026-02-17 | 13F | Summit Global Investments | 0 | -100,00 | 0 | |||||
| 2026-04-16 | 13F | Sheets Smith Wealth Management | 21.789 | -0,26 | 725 | 86,38 | ||||
| 2026-02-12 | 13F | Nuveen, LLC | 490.139 | -0,78 | 8.734 | 39,34 | ||||
| 2026-02-10 | 13F | Acadian Asset Management Llc | 440.691 | 1.043,37 | 8 | |||||
| 2026-02-04 | 13F | Madison Asset Management, LLC | 169.009 | 3.012 | ||||||
| 2026-02-12 | 13F | Earnest Partners Llc | 772.124 | -5,29 | 13.759 | 33,00 | ||||
| 2026-04-07 | 13F | Eastern Bank | 861 | 0,00 | 29 | 86,67 | ||||
| 2026-04-14 | 13F | Prospera Financial Services Inc | 6.387 | -65,58 | 213 | -35,76 | ||||
| 2026-02-17 | 13F | SummitTX Capital, L.P. | 28.831 | 514 | ||||||
| 2026-02-13 | 13F | American Century Companies Inc | 605.778 | 5,24 | 10.795 | 47,78 | ||||
| 2026-02-09 | 13F | Fisher Asset Management, LLC | 443.296 | -5,55 | 7.900 | 32,62 | ||||
| 2026-01-28 | 13F | WPG Advisers, LLC | 395 | 7,63 | 7 | 75,00 | ||||
| 2026-02-10 | 13F | Goldman Sachs Group Inc | 2.195.062 | 65,59 | 39.116 | 132,54 | ||||
| 2026-02-17 | 13F | Boothbay Fund Management, Llc | 206.542 | 11,66 | 3.681 | 56,80 | ||||
| 2026-02-06 | 13F | EverSource Wealth Advisors, LLC | 1.258 | 11,52 | 22 | 57,14 | ||||
| 2026-02-04 | 13F | Oregon Public Employees Retirement Fund | 51.094 | 1,59 | 910 | 42,63 | ||||
| 2026-02-10 | 13F | Jupiter Asset Management Ltd | 282.582 | -10,25 | 5.036 | 26,03 | ||||
| 2026-02-19 | 13F | CI Private Wealth, LLC | 11.313 | 2,79 | 203 | 45,32 | ||||
| 2026-02-11 | 13F | Allianz Asset Management GmbH | 1.889.657 | 29,86 | 33.674 | 82,36 | ||||
| 2026-01-23 | 13F | Westside Investment Management, Inc. | 62 | 0,00 | 1 | |||||
| 2026-02-17 | 13F | Numerai GP LLC | 45.681 | -34,81 | 814 | -8,44 | ||||
| 2026-02-06 | 13F | Legato Capital Management LLC | 138.310 | 10,09 | 2.465 | 54,58 | ||||
| 2026-02-17 | 13F | Canada Pension Plan Investment Board | 49.900 | 154,59 | 889 | 258,47 | ||||
| 2026-02-11 | 13F | Jpmorgan Chase & Co | 681.276 | 69,94 | 12.140 | 138,65 | ||||
| 2026-04-08 | 13F | Heritage Family Offices, LLP | 8.830 | -37,16 | 294 | 17,20 | ||||
| 2026-02-17 | 13F | Elequin Capital Lp | 95 | 2 | ||||||
| 2026-01-29 | 13F | UMA Financial Services, Inc. | 102 | 45,71 | 2 | |||||
| 2026-01-26 | 13F | Private Trust Co Na | 1.285 | 14,43 | 23 | 57,14 | ||||
| 2026-01-29 | 13F | Dunhill Financial, LLC | 3 | 0 | ||||||
| 2026-02-13 | 13F | Bridgefront Capital, LLC | 60.605 | -1,35 | 1.080 | 38,51 | ||||
| 2026-02-17 | 13F | Abel Hall, LLC | 10.392 | 185 | ||||||
| 2026-02-12 | 13F | Jane Street Group, Llc | Call | 799.100 | 20,38 | 14.240 | 69,05 | |||
| 2026-02-17 | 13F | Jump Financial, LLC | 93.700 | 1.670 | ||||||
| 2026-02-20 | 13F | Dean Capital Management | 221.405 | 10,31 | 3.945 | 54,89 | ||||
| 2026-02-12 | 13F | Jane Street Group, Llc | Put | 10.700 | 191 | |||||
| 2026-02-17 | 13F | MIRAE ASSET GLOBAL ETFS HOLDINGS Ltd. | 102.837 | -0,06 | 1.833 | 40,38 | ||||
| 2026-02-04 | 13F | Virginia Retirement Systems Et Al | 0 | -100,00 | 0 | |||||
| 2026-02-09 | 13F | Hantz Financial Services, Inc. | 2.845 | 86,19 | 0 | |||||
| 2026-01-29 | 13F | Quent Capital, LLC | 1.354 | 0,00 | 24 | 41,18 | ||||
| 2026-01-23 | 13F | Financial Connections Group, Inc. | 250 | 0,00 | 0 | |||||
| 2026-02-17 | 13F | Optiver Holding B.V. | 0 | -100,00 | 0 | |||||
| 2026-04-16 | 13F | SG Americas Securities, LLC | 109.753 | 133,80 | 4 | |||||
| 2026-02-13 | 13F | Centiva Capital, LP | 13.839 | 247 | ||||||
| 2026-03-06 | 13F | Hsbc Holdings Plc | 12.085 | 218 | ||||||
| 2026-02-17 | 13F | Maryland State Retirement & Pension System | 32.572 | 1,49 | 580 | 42,51 | ||||
| 2026-02-17 | 13F | Point72 Asset Management, L.P. | Put | 48.500 | 864 | |||||
| 2026-02-02 | 13F | Danske Bank A/s | 0 | -100,00 | 0 | |||||
| 2026-02-17 | 13F | Point72 Asset Management, L.P. | Call | 65.200 | 1.162 | |||||
| 2026-02-10 | 13F | Hillsdale Investment Management Inc. | 540 | -21,74 | 10 | 12,50 | ||||
| 2026-02-17 | 13F | Wiley Bros.-aintree Capital, Llc | 45.189 | -2,13 | 805 | 37,61 | ||||
| 2026-02-17 | 13F | Point72 Asset Management, L.P. | 872.177 | -78,64 | 15.542 | -70,00 | ||||
| 2026-02-02 | 13F | Fifth Third Bancorp | 947 | 13,28 | 17 | 60,00 | ||||
| 2026-04-13 | 13F | Massmutual Trust Co Fsb/adv | 1.240 | -31,91 | 41 | 28,13 | ||||
| 2026-02-12 | 13F | Steward Partners Investment Advisory, Llc | 62 | -36,08 | 1 | 0,00 | ||||
| 2026-01-27 | 13F | Zurcher Kantonalbank (Zurich Cantonalbank) | 80.787 | 23,60 | 1.440 | 73,58 | ||||
| 2026-02-17 | 13F | Ardsley Advisory Partners Lp | 440.000 | 7.841 | ||||||
| 2026-02-09 | 13F | AIA Group Ltd | 36.138 | -68,19 | 644 | -55,38 | ||||
| 2026-02-06 | 13F | Handelsbanken Fonder AB | 88.810 | 25,60 | 2 | |||||
| 2026-01-07 | 13F | Harbour Capital Advisors, LLC | 31.720 | 576 | ||||||
| 2026-02-12 | 13F | EAM Investors, LLC | 333.414 | 5.941 | ||||||
| 2025-11-14 | 13F | Point72 Hong Kong Ltd | 4.378 | 56 | ||||||
| 2026-02-17 | 13F | Caption Management, LLC | 15.000 | 267 | ||||||
| 2026-02-04 | 13F | LRI Investments, LLC | 967 | 0,00 | 17 | 41,67 | ||||
| 2026-01-23 | 13F | Robeco Institutional Asset Management B.V. | 36.138 | -68,19 | 644 | -55,38 | ||||
| 2026-02-11 | 13F | Ameritas Investment Partners, Inc. | 17.980 | 320 | ||||||
| 2026-04-15 | 13F | Trust Point Inc. | 11.276 | 4,37 | 375 | 95,31 | ||||
| 2026-02-17 | 13F | Russell Investments Group, Ltd. | 56.382 | 31,78 | 1.005 | 85,24 | ||||
| 2026-02-13 | 13F | Alyeska Investment Group, L.P. | 712.483 | 12.696 | ||||||
| 2026-02-06 | 13F | Global Retirement Partners, LLC | 13.097 | 781,36 | 233 | 1.194,44 | ||||
| 2026-02-17 | 13F | Gotham Asset Management, LLC | 16.360 | 292 | ||||||
| 2026-01-26 | 13F | KBC Group NV | 6.717 | 0,00 | 0 | |||||
| 2026-02-13 | 13F | BNP Paribas Asset Management Holding S.A. | 3.140 | 40,68 | 0 | |||||
| 2026-02-12 | 13F | Integrated Quantitative Investments LLC | 81.097 | -10,87 | 1.445 | 25,22 | ||||
| 2026-02-13 | 13F | Stifel Financial Corp | 110.104 | 26,07 | 1.962 | 77,08 | ||||
| 2026-02-06 | 13F | HighTower Advisors, LLC | 11.068 | -0,66 | 197 | 39,72 | ||||
| 2026-04-20 | 13F | Assenagon Asset Management S.A. | 427.600 | -72,56 | 14.231 | -48,75 | ||||
| 2026-02-05 | 13F | Td Private Client Wealth Llc | 49 | 0,00 | 1 | |||||
| 2026-02-10 | 13F | Root Financial Partners, LLC | 501 | 6,82 | 9 | 60,00 | ||||
| 2026-01-27 | 13F | Tributary Capital Management, LLC | 1.027.164 | -6,94 | 18.304 | 30,68 | ||||
| 2026-01-26 | 13F | Cwm, Llc | 5.463 | -0,53 | 0 | |||||
| 2026-01-30 | 13F | Archer Investment Corp | 5 | 0 | ||||||
| 2026-04-06 | 13F | GAMMA Investing LLC | 4.863 | 17,95 | 162 | 120,55 | ||||
| 2026-02-17 | 13F | Two Sigma Investments, Lp | 635.711 | 446,49 | 11.328 | 667,48 | ||||
| 2026-02-17 | 13F | Petrus Trust Company, LTA | 0 | -100,00 | 0 | |||||
| 2026-01-23 | 13F | Keener Financial Planning LLC | 0 | -100,00 | 0 | |||||
| 2026-01-23 | 13F | Oak Ridge Investments Llc | 297.052 | -2,21 | 5.293 | 37,34 | ||||
| 2026-02-09 | 13F | Jackson Creek Investment Advisors LLC | 105.905 | 2 | ||||||
| 2026-02-13 | 13F | Segall Bryant & Hamill, Llc | 1.508.232 | -8,40 | 26.877 | 28,62 | ||||
| 2026-02-10 | 13F | Godfrey Financial Associates, Inc. | 6 | 0 | ||||||
| 2026-02-12 | 13F | Swiss National Bank | 439.000 | 1,43 | 7.823 | 42,43 | ||||
| 2026-02-03 | 13F | International Assets Investment Management, Llc | 74 | 1 | ||||||
| 2026-01-27 | 13F | Evergreen Capital Management Llc | 12.819 | 0,49 | 228 | 41,61 | ||||
| 2026-02-13 | 13F | Fiduciary Trust Co | 36.045 | -4,12 | 642 | 34,59 | ||||
| 2026-02-05 | 13F | Amalgamated Bank | 64.808 | 0,10 | 1 | |||||
| 2026-02-13 | 13F | Prudential Financial Inc | 2.232.851 | 86,38 | 39.789 | 161,72 | ||||
| 2026-04-16 | 13F | Brookstone Capital Management | 0 | -100,00 | 0 | |||||
| 2026-02-09 | 13F | Annis Gardner Whiting Capital Advisors, LLC | 36 | 1 | ||||||
| 2026-02-11 | 13F | Barrow Hanley Mewhinney & Strauss Llc | 0 | -100,00 | 0 | |||||
| 2026-02-10 | 13F | Envestnet Asset Management Inc | 685.608 | -6,97 | 12.218 | 30,64 | ||||
| 2026-02-09 | 13F | Harbour Investments, Inc. | 1.303 | 1.165,05 | 23 | 2.200,00 | ||||
| 2026-02-17 | 13F | Schonfeld Strategic Advisors LLC | 14.001 | -93,73 | 249 | -91,21 | ||||
| 2026-01-30 | 13F | Caldwell Securities, Inc | 18 | 0,00 | 0 | |||||
| 2026-04-10 | 13F | Matrix Trust Co | 554 | 0 | ||||||
| 2026-01-30 | 13F | Rachor Investment Advisory Services, LLC | 50 | 1 | ||||||
| 2026-02-06 | 13F | Envestnet Portfolio Solutions, Inc. | 18.154 | -6,64 | 324 | 31,30 | ||||
| 2026-02-09 | 13F | Coldstream Capital Management Inc | 10.053 | -7,17 | 179 | 30,66 | ||||
| 2026-02-17 | 13F | Woodline Partners LP | 568.215 | -88,65 | 10.126 | -84,06 | ||||
| 2025-11-14 | 13F | Skopos Labs, Inc. | 0 | -100,00 | 0 | |||||
| 2026-02-12 | 13F | CIBC Private Wealth Group, LLC | 93 | 132,50 | 2 | |||||
| 2026-02-05 | 13F | Atria Investments Llc | 10.010 | -10,58 | 178 | 25,35 | ||||
| 2025-10-24 | 13F | Godsey & Gibb Associates | 0 | -100,00 | 0 | |||||
| 2025-11-13 | 13F | Bokf, Na | 0 | -100,00 | 0 | |||||
| 2026-02-03 | 13F | Farmers & Merchants Investments Inc | 155 | 0,00 | 3 | 100,00 | ||||
| 2026-02-12 | 13F | Jane Street Group, Llc | 0 | -100,00 | 0 | -100,00 | ||||
| 2025-10-23 | 13F | Park Avenue Securities Llc | 0 | -100,00 | 0 | |||||
| 2026-02-13 | 13F | State Street Corp | 8.570.145 | -3,61 | 152.720 | 35,35 | ||||
| 2026-02-11 | 13F | Deutsche Bank Ag\ | 205.321 | 3,78 | 3.659 | 45,74 | ||||
| 2026-02-03 | 13F | SBI Securities Co., Ltd. | 802 | 407,59 | 14 | 600,00 | ||||
| 2026-01-29 | 13F | UBS Group AG | 588.333 | -36,86 | 10.484 | -11,33 | ||||
| 2026-02-17 | 13F | VARCOV Co. | 21.304 | 380 | ||||||
| 2026-02-17 | 13F | PharVision Advisers, LLC | 10.510 | 187 | ||||||
| 2025-11-14 | 13F | Atom Investors LP | 0 | -100,00 | 0 | |||||
| 2026-02-12 | 13F | Triumph Capital Management | 18 | 0,00 | 0 | |||||
| 2026-04-07 | 13F | Signaturefd, Llc | 804 | 23,31 | 27 | 136,36 | ||||
| 2026-02-17 | 13F | Markin Volterra Fund LP | 10.493 | 187 | ||||||
| 2026-02-12 | 13F | Bank Of Montreal /can/ | 20.748 | -9,39 | 370 | 27,24 | ||||
| 2026-01-30 | 13F | Keybank National Association/oh | 19.356 | -21,47 | 345 | 10,26 | ||||
| 2026-02-13 | 13F | C M Bidwell & Associates Ltd | 72 | 0,00 | 1 | |||||
| 2026-02-17 | 13F | ISAM Funds (UK) Ltd | 0 | -100,00 | 0 | |||||
| 2026-02-17 | 13F | Summit Partners Public Asset Management, Llc | Call | 0 | -100,00 | 0 | ||||
| 2026-02-06 | 13F | Bare Financial Services, Inc | 524 | 11,25 | 9 | 80,00 | ||||
| 2026-02-09 | 13F | Keating Financial Advisory Services, Inc. | 95 | 2 | ||||||
| 2026-01-30 | 13F | Laurel Wealth Advisors LLC | 12 | 0 | ||||||
| 2026-02-17 | 13F | Wellington Management Group Llp | 10.999.595 | -23,69 | 196.013 | 7,15 | ||||
| 2026-02-11 | 13F | Empowered Funds, LLC | 7.059 | 126 | ||||||
| 2026-02-12 | 13F | Penserra Capital Management LLC | 822.781 | -2,05 | 15 | 40,00 | ||||
| 2026-02-03 | 13F | Robeco Schweiz AG | 595.000 | 32,22 | 10.603 | 85,67 | ||||
| 2026-01-14 | 13F | Spire Wealth Management | 34 | 1 | ||||||
| 2026-02-04 | 13F | Swiss Life Asset Management Ltd | 21.172 | 101,75 | 377 | 183,46 | ||||
| 2026-02-09 | 13F | Quest Partners LLC | 23.338 | -14,34 | 416 | 20,29 | ||||
| 2026-01-23 | 13F | Rsm Us Wealth Management Llc | 18.770 | 19,45 | 338 | 69,85 | ||||
| 2026-02-06 | 13F | ProShare Advisors LLC | 43.083 | 3,18 | 768 | 44,99 | ||||
| 2026-02-03 | 13F | Crossmark Global Holdings, Inc. | 19.950 | 0,00 | 356 | 40,32 | ||||
| 2026-02-17 | 13F | Jones Financial Companies Lllp | 292 | 50,52 | 5 | 150,00 | ||||
| 2026-01-29 | 13F | IMC-Chicago, LLC | 0 | -100,00 | 0 | -100,00 | ||||
| 2026-02-10 | 13F | Natixis Advisors, L.p. | 80.571 | 3,78 | 1 | |||||
| 2026-01-23 | 13F | Private Wealth Management Group, LLC | 164 | 0,00 | 3 | 0,00 | ||||
| 2026-02-12 | 13F | Federation des caisses Desjardins du Quebec | 7.992 | -16,35 | 142 | 17,36 | ||||
| 2026-02-11 | 13F | Illinois Municipal Retirement Fund | 113.032 | 2,23 | 2.014 | 43,55 | ||||
| 2026-02-12 | 13F | Johnson Financial Group, Inc. | 4.427 | 29,07 | 79 | 81,40 | ||||
| 2026-01-29 | 13F | Comerica Bank | 61.662 | -13,06 | 1.099 | 22,00 |
Other Listings
| DE:UNS1 | 36,40 € |