Grundlæggende statistik
| Institutionelle ejere | 72 total, 66 long only, 4 short only, 2 long/short - change of -10,00% MRQ |
| Gennemsnitlig porteføljeallokering | 0.0036 % - change of -92,34% MRQ |
| Institutionelle aktier (lange) | 3.899.201 (ex 13D/G) - change of -0,73MM shares -15,74% MRQ |
| Institutionel værdi (lang) | $ 26.438 USD ($1000) |
Institutionelt ejerskab og aktionærer
TriplePoint Venture Growth BDC Corp. (US:TPVG) har 72 institutionelle ejere og aktionærer, der har indsendt 13D/G- eller 13F-formularer til Securities Exchange Commission (SEC). Disse institutioner har i alt 4,292,418 aktier. Største aktionærer omfatter Two Sigma Advisers, Lp, Marshall Wace, Llp, Two Sigma Investments, Lp, Legal & General Group Plc, Virtus Investment Advisers, Inc., BlackRock, Inc., Ameriprise Financial Inc, VPC - Virtus Private Credit Strategy ETF, Susquehanna International Group, Llp, and Samalin Investment Counsel, LLC .
TriplePoint Venture Growth BDC Corp. (NYSE:TPVG) institutionel ejerskabsstruktur viser aktuelle positioner i virksomheden efter institutioner og fonde, samt seneste ændringer i positionsstørrelse. Større aktionærer kan omfatte individuelle investorer, investeringsforeninger, hedgefonde eller institutioner. Skema 13D angiver, at investoren besidder (eller besidder) mere end 5 % af virksomheden og har til hensigt (eller har til hensigt at) aktivt at forfølge en ændring i forretningsstrategi. Skema 13G indikerer en passiv investering på over 5%.
The share price as of September 9, 2025 is 6,76 / share. Previously, on September 10, 2024, the share price was 7,48 / share. This represents a decline of 9,63% over that period.

Fondens stemningsscore
Fund Sentiment Score (fka Ownership Accumulation Score) finder de aktier, der bliver mest købt af fonde. Det er resultatet af en sofistikeret, multi-faktor kvantitativ model, der identificerer virksomheder med de højeste niveauer af institutionel akkumulering. Scoringsmodellen bruger en kombination af den samlede stigning i oplyste ejere, ændringerne i porteføljeallokeringer i disse ejere og andre målinger. Tallet går fra 0 til 100, hvor højere tal indikerer et højere niveau af akkumulering for sine jævnaldrende, og 50 er gennemsnittet.
Opdateringsfrekvens: Dagligt
Se Ownership Explorer, som giver en liste over højest rangerende virksomheder.
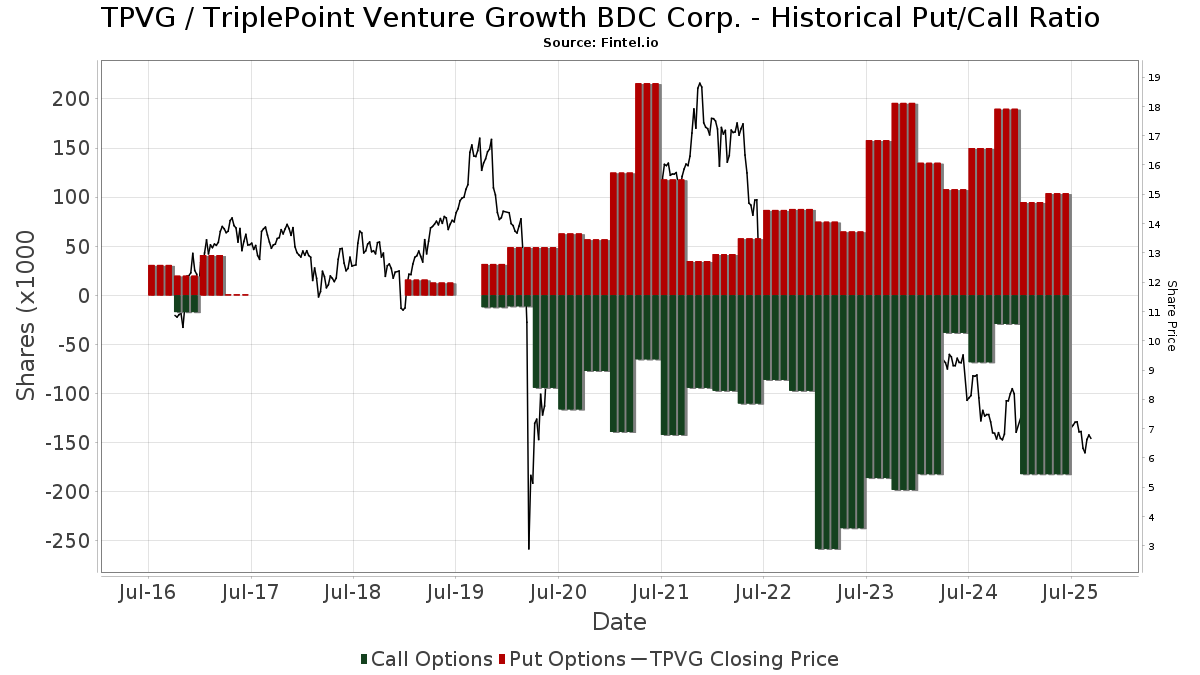
Institutionel Put/Call-forhold
Ud over at indberette standardaktie- og gældsudstedelser skal institutter med mere end 100 mill. aktiver under forvaltning også oplyse deres put- og call-optionsbeholdninger. Da salgsoptioner generelt indikerer negativ stemning, og købsoptioner indikerer positiv stemning, kan vi få en fornemmelse af den overordnede institutionelle stemning ved at plotte forholdet mellem put og kald. Diagrammet til højre viser det historiske put/call-forhold for dette instrument.
Brug af Put/Call Ratio som en indikator for investorernes stemning overvinder en af de vigtigste mangler ved at bruge totalt institutionelt ejerskab, som er, at en betydelig mængde af aktiver under forvaltning investeres passivt for at spore indekser. Passivt forvaltede fonde køber typisk ikke optioner, så indikatoren for put/call-forholdet følger mere nøje følelsen af aktivt forvaltede fonde.
13F og NPORT arkivering
Detaljer om 13F-arkivering er gratis. Detaljer om NP-ansøgninger kræver et premium-medlemskab. Grønne rækker angiver nye positioner. Røde rækker angiver lukkede positioner. Klik på linket ikon for at se den fulde transaktionshistorik.
Opgrader
for at låse premium-data op og eksportere til Excel ![]() .
.
| Fil dato | Kilde | Investor | Type | Gennemsnitlig pris (Øst) |
Aktier | Δ Aktier (%) |
Rapporteret Værdi ($1000) |
Δ Værdi (%) |
Port Alloc (%) |
|
|---|---|---|---|---|---|---|---|---|---|---|
| 2025-06-25 | NP | VPC - Virtus Private Credit Strategy ETF | 217.436 | -0,37 | 1.320 | -25,01 | ||||
| 2025-06-27 | NP | COAGX - Caldwell & Orkin - Gator Capital Long/Short Fund | Short | -8.500 | -52 | |||||
| 2025-07-15 | 13F | Norden Group Llc | 56.848 | 36,37 | 399 | 37,24 | ||||
| 2025-05-05 | 13F | Diversify Advisory Services, LLC | 0 | -100,00 | 0 | |||||
| 2025-08-13 | 13F | Virtus Investment Advisers, Inc. | 237.903 | -0,06 | 1.668 | 0,36 | ||||
| 2025-08-12 | 13F | O'shaughnessy Asset Management, Llc | 13.575 | 95 | ||||||
| 2025-08-13 | 13F | Northwestern Mutual Wealth Management Co | 5.000 | 35 | ||||||
| 2025-08-14 | 13F | Wells Fargo & Company/mn | 64.814 | -2,57 | 454 | -2,16 | ||||
| 2025-08-14 | 13F | Raymond James Financial Inc | 19.133 | -8,55 | 134 | -8,22 | ||||
| 2025-08-14 | 13F | Verition Fund Management LLC | 19.877 | 139 | ||||||
| 2025-08-15 | 13F | Morgan Stanley | 83.601 | -55,99 | 586 | -55,81 | ||||
| 2025-08-18 | 13F | Wolverine Trading, Llc | Put | 12.200 | 16,19 | 85 | 14,86 | |||
| 2025-08-14 | 13F | Quarry LP | 0 | -100,00 | 0 | |||||
| 2025-08-01 | 13F | Y-Intercept (Hong Kong) Ltd | 0 | -100,00 | 0 | |||||
| 2025-08-12 | 13F | Winnow Wealth Llc | 1.400 | 10 | ||||||
| 2025-05-15 | 13F | Point72 (DIFC) Ltd | 0 | -100,00 | 0 | |||||
| 2025-05-15 | 13F | Parvin Asset Management, LLC | 0 | -100,00 | 0 | |||||
| 2025-08-06 | 13F | Commonwealth Equity Services, Llc | 18.296 | -1,95 | 0 | |||||
| 2025-08-14 | 13F | Financial Network Wealth Advisors LLC | 847 | 0,00 | 6 | 0,00 | ||||
| 2025-08-12 | 13F | Clear Street Markets Llc | 0 | -100,00 | 0 | |||||
| 2025-08-12 | 13F | LPL Financial LLC | 50.420 | 3,43 | 353 | 3,82 | ||||
| 2025-08-07 | 13F | Connor, Clark & Lunn Investment Management Ltd. | 18.669 | 131 | ||||||
| 2025-08-14 | 13F | Ameriprise Financial Inc | 223.483 | -20,64 | 1.564 | -20,45 | ||||
| 2025-08-15 | 13F | Great West Life Assurance Co /can/ | 38.025 | 0,00 | 0 | |||||
| 2025-05-15 | 13F | Hrt Financial Lp | 0 | -100,00 | 0 | |||||
| 2025-07-22 | 13F | Red Tortoise LLC | 2.351 | 16 | ||||||
| 2025-08-08 | 13F | Flaharty Asset Management, LLC | 360 | 0,00 | 3 | 0,00 | ||||
| 2025-07-24 | 13F | Us Bancorp \de\ | 0 | -100,00 | 0 | |||||
| 2025-08-14 | 13F | Avenir Corp | 10.000 | 0,00 | 70 | 1,45 | ||||
| 2025-08-06 | 13F | Ethos Financial Group, LLC | 46.627 | 84,91 | 327 | 85,23 | ||||
| 2025-08-12 | 13F | CIBC Private Wealth Group, LLC | 4.430 | -0,02 | 31 | 24,00 | ||||
| 2025-08-13 | 13F | PharVision Advisers, LLC | 0 | -100,00 | 0 | |||||
| 2025-08-08 | 13F | Pnc Financial Services Group, Inc. | 2.404 | 0,00 | 17 | 0,00 | ||||
| 2025-08-11 | 13F | Delta Asset Management Llc/tn | 13 | 0,00 | 0 | |||||
| 2025-08-05 | 13F | GPS Wealth Strategies Group, LLC | 2.327 | 0,00 | 16 | 0,00 | ||||
| 2025-07-28 | 13F | Harbour Investments, Inc. | 0 | -100,00 | 0 | |||||
| 2025-08-13 | 13F | Marshall Wace, Llp | 529.201 | 44,87 | 3.710 | 45,51 | ||||
| 2025-07-31 | 13F | Caitong International Asset Management Co., Ltd | 906 | 466,25 | 6 | 500,00 | ||||
| 2025-05-15 | 13F | Cubist Systematic Strategies, LLC | 0 | -100,00 | 0 | |||||
| 2025-05-01 | 13F | Diversify Wealth Management, Llc | 0 | -100,00 | 0 | |||||
| 2025-08-13 | 13F | EverSource Wealth Advisors, LLC | 10.000 | 0,00 | 70 | 1,45 | ||||
| 2025-08-14 | 13F | Susquehanna International Group, Llp | 19.416 | 136 | ||||||
| 2025-08-14 | 13F | Susquehanna International Group, Llp | Call | 113.900 | -4,12 | 798 | -3,74 | |||
| 2025-08-14 | 13F | Susquehanna International Group, Llp | Put | 59.400 | 198,49 | 416 | 201,45 | |||
| 2025-08-14 | 13F | Aquatic Capital Management LLC | 11.710 | -49,91 | 82 | -49,69 | ||||
| 2025-05-06 | 13F | Assetmark, Inc | 0 | -100,00 | 0 | |||||
| 2025-08-13 | 13F | Townsquare Capital Llc | 0 | -100,00 | 0 | |||||
| 2025-07-30 | 13F | Atlantic Edge Private Wealth Management, LLC | 200 | -50,00 | 1 | -50,00 | ||||
| 2025-05-13 | 13F | Bokf, Na | 0 | -100,00 | 0 | |||||
| 2025-08-12 | 13F | Trexquant Investment LP | 88.155 | -37,06 | 618 | -36,85 | ||||
| 2025-08-14 | 13F | Brevan Howard Capital Management LP | 0 | -100,00 | 0 | |||||
| 2025-06-27 | NP | LBO - WHITEWOLF Publicly Listed Private Equity ETF | 1.373 | 14,23 | 8 | -11,11 | ||||
| 2025-08-14 | 13F | Jane Street Group, Llc | 72.663 | 7,34 | 509 | 7,84 | ||||
| 2025-08-14 | 13F | Bank Of America Corp /de/ | 12.737 | -11,16 | 89 | -11,00 | ||||
| 2025-05-13 | 13F | Quantbot Technologies LP | 0 | -100,00 | 0 | -100,00 | ||||
| 2025-07-31 | 13F | Cambridge Investment Research Advisors, Inc. | 12.252 | -6,70 | 0 | |||||
| 2025-08-14 | 13F | Bnp Paribas Arbitrage, Sa | 2.704 | -87,73 | 19 | -88,24 | ||||
| 2025-07-18 | 13F | SOA Wealth Advisors, LLC. | 3.000 | 0,00 | 21 | 5,00 | ||||
| 2025-05-12 | 13F | Fmr Llc | 0 | -100,00 | 0 | |||||
| 2025-08-14 | 13F | Comerica Bank | 8.700 | -6,86 | 61 | -7,69 | ||||
| 2025-08-14 | 13F | UBS Group AG | 9.752 | -57,92 | 68 | -57,76 | ||||
| 2025-08-14 | 13F | McIlrath & Eck, LLC | 7.274 | 0,00 | 51 | 0,00 | ||||
| 2025-09-04 | 13F/A | Advisor Group Holdings, Inc. | 35.945 | 75,62 | 252 | 77,46 | ||||
| 2025-07-25 | 13F | Cwm, Llc | 979 | 10,75 | 0 | |||||
| 2025-08-12 | 13F | BlackRock, Inc. | 225.216 | 34,13 | 1.579 | 34,64 | ||||
| 2025-08-11 | 13F | Hexagon Capital Partners LLC | 0 | -100,00 | 0 | |||||
| 2025-07-17 | 13F | Sound Income Strategies, LLC | 1.279 | -5,47 | 9 | -11,11 | ||||
| 2025-08-08 | 13F | Cetera Investment Advisers | 43.121 | -4,02 | 302 | -3,51 | ||||
| 2025-08-13 | 13F | Lido Advisors, LLC | 83.570 | -1,68 | 586 | -1,35 | ||||
| 2025-05-08 | 13F | XTX Topco Ltd | 0 | -100,00 | 0 | |||||
| 2025-08-12 | 13F | MAI Capital Management | 1.347 | 54,47 | 9 | 50,00 | ||||
| 2025-08-05 | 13F | Simplex Trading, Llc | 24.032 | 0 | ||||||
| 2025-08-12 | 13F | Jpmorgan Chase & Co | 0 | -100,00 | 0 | |||||
| 2025-08-13 | 13F | Neuberger Berman Group LLC | 0 | -100,00 | 0 | |||||
| 2025-07-16 | 13F | St Germain D J Co Inc | 500 | 0,00 | 4 | 0,00 | ||||
| 2025-07-14 | 13F | U.S. Capital Wealth Advisors, LLC | 40.380 | 23,18 | 283 | 24,12 | ||||
| 2025-08-14 | 13F | Bluefin Capital Management, Llc | 15.000 | 105 | ||||||
| 2025-05-14 | 13F | Campbell & CO Investment Adviser LLC | 0 | -100,00 | 0 | |||||
| 2025-07-14 | 13F | Farmers & Merchants Investments Inc | 5.700 | 21,28 | 40 | 21,88 | ||||
| 2025-08-19 | 13F | Newbridge Financial Services Group, Inc. | 1.000 | 7 | ||||||
| 2025-08-12 | 13F | Accordant Advisory Group Inc | 1.400 | 0,00 | 10 | 0,00 | ||||
| 2025-08-14 | 13F | Citadel Advisors Llc | 30.558 | -77,21 | 214 | -77,11 | ||||
| 2025-08-14 | 13F | Citadel Advisors Llc | Put | 33.200 | -48,69 | 233 | -48,56 | |||
| 2025-08-12 | 13F | Legal & General Group Plc | 276.451 | 4,52 | 1.935 | 4,76 | ||||
| 2025-08-04 | 13F | Kovack Advisors, Inc. | 50.319 | 10,55 | 353 | 11,04 | ||||
| 2025-08-11 | 13F | Private Advisor Group, LLC | 0 | -100,00 | 0 | |||||
| 2025-08-14 | 13F | Citadel Advisors Llc | Call | 68.600 | 7,02 | 481 | 7,38 | |||
| 2025-08-14 | 13F | D. E. Shaw & Co., Inc. | 0 | -100,00 | 0 | |||||
| 2025-08-14 | 13F | Qube Research & Technologies Ltd | 0 | -100,00 | 0 | |||||
| 2025-08-07 | 13F | Samalin Investment Counsel, LLC | 92.636 | 13,10 | 649 | 13,66 | ||||
| 2025-08-04 | 13F | Spire Wealth Management | 0 | -100,00 | 0 | |||||
| 2025-08-11 | 13F | Nomura Asset Management Co Ltd | 3.720 | 26 | ||||||
| 2025-08-14 | 13F | Millennium Management Llc | 0 | -100,00 | 0 | |||||
| 2025-08-14 | 13F | Group One Trading, L.p. | 2.430 | -16,24 | 17 | -15,00 | ||||
| 2025-08-13 | 13F | Jones Financial Companies Lllp | 1.000 | 7 | ||||||
| 2025-08-08 | 13F | CFO4Life Group, LLC | 13.610 | 0,00 | 95 | 1,06 | ||||
| 2025-07-30 | NP | ORR - Militia Long/Short Equity ETF | Short | -350.952 | 313,01 | -2.443 | 255,46 | |||
| 2025-05-15 | 13F | Schonfeld Strategic Advisors LLC | 0 | -100,00 | 0 | |||||
| 2025-07-29 | 13F | International Assets Investment Management, Llc | 15.245 | 0,00 | 107 | 0,00 | ||||
| 2025-08-12 | 13F | Proequities, Inc. | 0 | 0 | ||||||
| 2025-05-14 | 13F | ExodusPoint Capital Management, LP | 0 | -100,00 | 0 | |||||
| 2025-05-15 | 13F | Balyasny Asset Management Llc | 0 | -100,00 | 0 | |||||
| 2025-08-14 | 13F | Two Sigma Investments, Lp | 386.248 | -28,88 | 2.708 | -28,58 | ||||
| 2025-08-15 | 13F | Tower Research Capital LLC (TRC) | 0 | -100,00 | 0 | |||||
| 2025-08-11 | 13F | Brown Brothers Harriman & Co | 100 | 1 | ||||||
| 2025-08-14 | 13F | Royal Bank Of Canada | 22.627 | 48,09 | 159 | 48,60 | ||||
| 2025-08-13 | 13F | Northern Trust Corp | 29.032 | 92,04 | 204 | 93,33 | ||||
| 2025-04-25 | NP | KBWD - Invesco KBW High Dividend Yield Financial ETF This fund is a listed as child fund of Invesco Ltd. and if that institution has disclosed ownership in this security, then these positions will not be double counted when calculating total shares and total value | 0 | -100,00 | 0 | -100,00 | ||||
| 2025-08-19 | 13F | National Asset Management, Inc. | 0 | -100,00 | 0 | |||||
| 2025-08-28 | NP | SMSAX - SIMT Multi-Strategy Alternative Fund Class F | Short | -33.765 | 59,35 | -237 | 60,54 | |||
| 2025-05-15 | 13F | Alpine Global Management, LLC | 0 | -100,00 | 0 | -100,00 | ||||
| 2025-05-14 | 13F | Virtus ETF Advisers LLC | 0 | -100,00 | 0 | |||||
| 2025-08-14 | 13F | Two Sigma Advisers, Lp | 567.874 | -24,24 | 3.981 | -23,93 | ||||
| 2025-08-11 | 13F | HighTower Advisors, LLC | 0 | -100,00 | 0 |