Grundlæggende statistik
| Institutionelle ejere | 173 total, 173 long only, 0 short only, 0 long/short - change of -1,70% MRQ |
| Gennemsnitlig porteføljeallokering | 0.5292 % - change of 6,25% MRQ |
| Institutionelle aktier (lange) | 34.506.497 (ex 13D/G) - change of 0,70MM shares 2,08% MRQ |
| Institutionel værdi (lang) | $ 769.254 USD ($1000) |
Institutionelt ejerskab og aktionærer
SPDR Series Trust - SPDR Portfolio Long Term Corporate Bond ETF (US:SPLB) har 173 institutionelle ejere og aktionærer, der har indsendt 13D/G- eller 13F-formularer til Securities Exchange Commission (SEC). Disse institutioner har i alt 34,506,497 aktier. Største aktionærer omfatter State Street Corp, LPL Financial LLC, RMG Wealth Management LLC, FISR - SPDR SSGA Fixed Income Sector Rotation ETF, Rockland Trust Co, SSTIX - State Street Total Return V.I.S. Fund Class 1 Shares, Nyl Investors Llc, Envestnet Asset Management Inc, Morgan Stanley, and Envestnet Portfolio Solutions, Inc. .
SPDR Series Trust - SPDR Portfolio Long Term Corporate Bond ETF (ARCA:SPLB) institutionel ejerskabsstruktur viser aktuelle positioner i virksomheden efter institutioner og fonde, samt seneste ændringer i positionsstørrelse. Større aktionærer kan omfatte individuelle investorer, investeringsforeninger, hedgefonde eller institutioner. Skema 13D angiver, at investoren besidder (eller besidder) mere end 5 % af virksomheden og har til hensigt (eller har til hensigt at) aktivt at forfølge en ændring i forretningsstrategi. Skema 13G indikerer en passiv investering på over 5%.
The share price as of September 15, 2025 is 23,38 / share. Previously, on September 16, 2024, the share price was 24,44 / share. This represents a decline of 4,34% over that period.

Fondens stemningsscore
Fund Sentiment Score (fka Ownership Accumulation Score) finder de aktier, der bliver mest købt af fonde. Det er resultatet af en sofistikeret, multi-faktor kvantitativ model, der identificerer virksomheder med de højeste niveauer af institutionel akkumulering. Scoringsmodellen bruger en kombination af den samlede stigning i oplyste ejere, ændringerne i porteføljeallokeringer i disse ejere og andre målinger. Tallet går fra 0 til 100, hvor højere tal indikerer et højere niveau af akkumulering for sine jævnaldrende, og 50 er gennemsnittet.
Opdateringsfrekvens: Dagligt
Se Ownership Explorer, som giver en liste over højest rangerende virksomheder.
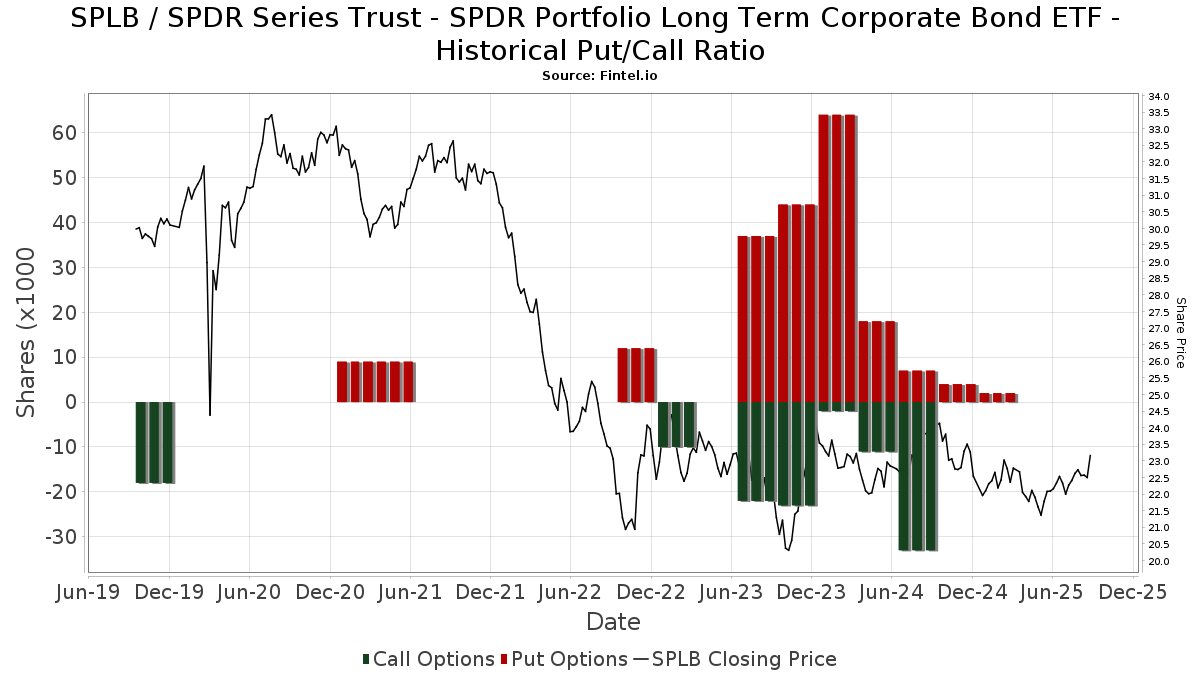
Institutionel Put/Call-forhold
Ud over at indberette standardaktie- og gældsudstedelser skal institutter med mere end 100 mill. aktiver under forvaltning også oplyse deres put- og call-optionsbeholdninger. Da salgsoptioner generelt indikerer negativ stemning, og købsoptioner indikerer positiv stemning, kan vi få en fornemmelse af den overordnede institutionelle stemning ved at plotte forholdet mellem put og kald. Diagrammet til højre viser det historiske put/call-forhold for dette instrument.
Brug af Put/Call Ratio som en indikator for investorernes stemning overvinder en af de vigtigste mangler ved at bruge totalt institutionelt ejerskab, som er, at en betydelig mængde af aktiver under forvaltning investeres passivt for at spore indekser. Passivt forvaltede fonde køber typisk ikke optioner, så indikatoren for put/call-forholdet følger mere nøje følelsen af aktivt forvaltede fonde.
13F og NPORT arkivering
Detaljer om 13F-arkivering er gratis. Detaljer om NP-ansøgninger kræver et premium-medlemskab. Grønne rækker angiver nye positioner. Røde rækker angiver lukkede positioner. Klik på linket ikon for at se den fulde transaktionshistorik.
Opgrader
for at låse premium-data op og eksportere til Excel ![]() .
.
| Fil dato | Kilde | Investor | Type | Gennemsnitlig pris (Øst) |
Aktier | Δ Aktier (%) |
Rapporteret Værdi ($1000) |
Δ Værdi (%) |
Port Alloc (%) |
|
|---|---|---|---|---|---|---|---|---|---|---|
| 2025-08-08 | 13F | Advyzon Investment Management, LLC | 52.428 | 2,38 | 1.183 | 2,42 | ||||
| 2025-08-06 | 13F | Prospera Financial Services Inc | 58.191 | -7,80 | 1.314 | -7,79 | ||||
| 2025-08-14 | 13F | Qube Research & Technologies Ltd | 224 | 0,00 | 5 | 0,00 | ||||
| 2025-05-14 | 13F | Joseph P. Lucia & Associates, LLC | 0 | -100,00 | 0 | |||||
| 2025-08-14 | 13F | Hrt Financial Lp | 0 | -100,00 | 0 | |||||
| 2025-08-28 | NP | SSTIX - State Street Total Return V.I.S. Fund Class 1 Shares | 1.671.861 | 2,26 | 37.734 | 2,25 | ||||
| 2025-07-28 | 13F | RFG Advisory, LLC | 44.063 | 7,35 | 995 | 7,34 | ||||
| 2025-08-14 | 13F | Integrated Wealth Concepts LLC | 0 | -100,00 | 0 | |||||
| 2025-08-14 | 13F | Jane Street Group, Llc | 23.224 | -97,85 | 524 | -97,85 | ||||
| 2025-07-17 | 13F | Raleigh Capital Management Inc. | 95.032 | 12,03 | 2.145 | 12,02 | ||||
| 2025-08-13 | 13F | Nyl Investors Llc | 1.450.074 | 0,22 | 32.728 | 0,22 | ||||
| 2025-08-01 | 13F | Austin Private Wealth, LLC | 205.918 | 82,69 | 4.648 | 82,74 | ||||
| 2025-04-10 | 13F | Matrix Trust Co | 0 | -100,00 | 0 | |||||
| 2025-07-22 | 13F | Iron Horse Wealth Management, LLC | 565 | 1,07 | 13 | 0,00 | ||||
| 2025-08-05 | 13F | Strategic Financial Concepts, LLC | 13.383 | -5,66 | 302 | -5,62 | ||||
| 2025-05-13 | 13F | Franklin Resources Inc | 0 | -100,00 | 0 | -100,00 | ||||
| 2025-07-11 | 13F | International Private Wealth Advisors LLC | 24.098 | 26,36 | 544 | 26,28 | ||||
| 2025-07-22 | 13F | White & Co Financial Planning Inc | 321.114 | 1,17 | 7.180 | 0,67 | ||||
| 2025-08-14 | 13F | Stifel Financial Corp | 12.299 | 278 | ||||||
| 2025-07-25 | 13F | Envestnet Portfolio Solutions, Inc. | 928.868 | 11,21 | 20.965 | 11,21 | ||||
| 2025-07-18 | 13F | Truist Financial Corp | 25.575 | -80,64 | 577 | -80,64 | ||||
| 2025-08-12 | 13F | Absolute Capital Management, LLC | 12.499 | -2,41 | 282 | -2,42 | ||||
| 2025-08-26 | 13F/A | Thrivent Financial For Lutherans | 0 | -100,00 | 0 | -100,00 | ||||
| 2025-07-08 | 13F | Boltwood Capital Management | 45.800 | -6,44 | 1.034 | -6,43 | ||||
| 2025-07-24 | 13F | IFP Advisors, Inc | 247.071 | 1,19 | 5.576 | 1,20 | ||||
| 2025-07-30 | 13F | Brookstone Capital Management | 0 | -100,00 | 0 | |||||
| 2025-07-16 | 13F | Twelve Points Wealth Management LLC | 17.428 | -12,00 | 393 | -12,08 | ||||
| 2025-08-12 | 13F | Jpmorgan Chase & Co | 150.974 | 2,45 | 3.407 | 2,44 | ||||
| 2025-08-14 | 13F | New England Asset Management Inc | 3.000 | 0,00 | 68 | 0,00 | ||||
| 2025-08-14 | 13F | Comerica Bank | 1.478 | 1,86 | 33 | 3,13 | ||||
| 2025-08-14 | 13F | Goldman Sachs Group Inc | 169.829 | 623,11 | 3.833 | 623,21 | ||||
| 2025-08-06 | 13F | Aspetuck Financial Management LLC | 121.648 | 5,64 | 2.746 | 5,66 | ||||
| 2025-08-12 | 13F | Ameritas Investment Partners, Inc. | 34.905 | 1,57 | 788 | 1,55 | ||||
| 2025-07-25 | 13F | Atria Wealth Solutions, Inc. | 19.080 | -11,92 | 431 | -11,89 | ||||
| 2025-08-28 | NP | INKM - SPDR SSGA Income Allocation ETF This fund is a listed as child fund of State Street Corp and if that institution has disclosed ownership in this security, then these positions will not be double counted when calculating total shares and total value | 57.166 | -10,58 | 1.290 | -10,54 | ||||
| 2025-08-14 | 13F | Transamerica Financial Advisors, Inc. | 81 | 0,00 | 2 | |||||
| 2025-08-14 | 13F | Smartleaf Asset Management LLC | 2.372 | 91,60 | 53 | 96,30 | ||||
| 2025-08-01 | 13F | Banco Santander, S.A. | 17.822 | 0,00 | 402 | 0,00 | ||||
| 2025-07-21 | 13F | Ameritas Advisory Services, LLC | 1 | 0 | ||||||
| 2025-07-28 | 13F | Harbour Investments, Inc. | 64.527 | 22,65 | 1.456 | 22,66 | ||||
| 2025-08-14 | 13F | Tudor Investment Corp Et Al | 0 | -100,00 | 0 | |||||
| 2025-08-08 | 13F | Collaborative Wealth Managment Inc. | 191.128 | -11,58 | 4.314 | -11,58 | ||||
| 2025-08-15 | 13F | Equitable Holdings, Inc. | 0 | -100,00 | 0 | |||||
| 2025-08-13 | 13F | Flow Traders U.s. Llc | 75.587 | 2 | ||||||
| 2025-08-13 | 13F | Rsm Us Wealth Management Llc | 10.788 | 243 | ||||||
| 2025-08-05 | 13F | Landmark Wealth Management, Inc. | 148.474 | 14,51 | 3.351 | 14,52 | ||||
| 2025-07-23 | 13F | RMG Wealth Management LLC | 2.097.447 | 46.400 | ||||||
| 2025-08-04 | 13F | Flagship Harbor Advisors, Llc | 171.121 | 3.862 | ||||||
| 2025-07-02 | 13F | HBW Advisory Services LLC | 0 | -100,00 | 0 | |||||
| 2025-08-14 | 13F | Fmr Llc | 0 | -100,00 | 0 | |||||
| 2025-07-10 | 13F | Global Financial Private Client, LLC | 29.802 | 20,67 | 673 | 20,65 | ||||
| 2025-07-14 | 13F | Caitlin John, LLC | 75.728 | -62,68 | 1.709 | -62,69 | ||||
| 2025-08-14 | 13F | Harwood Advisory Group, LLC | 10 | -44,44 | 0 | |||||
| 2025-08-14 | 13F | Bnp Paribas Arbitrage, Sa | 0 | -100,00 | 0 | |||||
| 2025-07-23 | 13F | Capstone Wealth Management Group, Llc | 53.273 | -80,87 | 1.202 | -80,87 | ||||
| 2025-08-14 | 13F | EP Wealth Advisors, Inc. | 5.000 | 1,34 | 113 | 0,90 | ||||
| 2025-08-14 | 13F | Heritage Wealth Management, Inc. | 9.250 | 0,00 | 209 | 0,00 | ||||
| 2025-07-10 | 13F | Rockland Trust Co | 1.681.304 | 3,46 | 37.947 | 3,47 | ||||
| 2025-09-04 | 13F/A | Advisor Group Holdings, Inc. | 409.259 | 32,29 | 9.237 | 32,28 | ||||
| 2025-07-21 | 13F | Mirae Asset Global Investments Co., Ltd. | 305.000 | 15,53 | 6.884 | 16,03 | ||||
| 2025-08-14 | 13F | GWM Advisors LLC | 137.711 | 3,52 | 3.108 | 3,53 | ||||
| 2025-08-12 | 13F | RiverFront Investment Group, LLC | 19.696 | -88,27 | 445 | -88,28 | ||||
| 2025-08-12 | 13F | J.w. Cole Advisors, Inc. | 90.285 | 2.038 | ||||||
| 2025-08-28 | NP | GPMIX - GuidePath(R) Multi-Asset Income Allocation Fund Service Shares | 61.824 | 33,38 | 1.395 | 33,37 | ||||
| 2025-07-25 | 13F | Northwest Capital Management Inc | 121 | -91,43 | 3 | -93,55 | ||||
| 2025-07-25 | 13F | Van Strum & Towne Inc. | 169.403 | -11,07 | 3.823 | -11,07 | ||||
| 2025-08-13 | 13F | Townsquare Capital Llc | 0 | -100,00 | 0 | |||||
| 2025-08-14 | 13F/A | Barclays Plc | 1 | 0,00 | 0 | |||||
| 2025-08-14 | 13F | Ameriprise Financial Inc | 48.857 | -17,89 | 1.103 | -17,88 | ||||
| 2025-07-11 | 13F | Farther Finance Advisors, LLC | 7.621 | 10,58 | 172 | 10,97 | ||||
| 2025-07-03 | 13F | City Center Advisors, LLC | 15.541 | 10,62 | 351 | 10,41 | ||||
| 2025-08-18 | 13F | Geneos Wealth Management Inc. | 30.128 | 2,76 | 680 | 2,72 | ||||
| 2025-08-01 | 13F | Gwn Securities Inc. | 59.854 | 105,04 | 1.353 | 105,31 | ||||
| 2025-07-09 | 13F | VisionPoint Advisory Group, LLC | 17.639 | 398 | ||||||
| 2025-04-10 | 13F | Legacy Financial Group LLC | 0 | -100,00 | 0 | |||||
| 2025-08-13 | 13F | Level Four Advisory Services, Llc | 19.007 | -3,48 | 429 | -3,60 | ||||
| 2025-08-13 | 13F | Cary Street Partners Financial Llc | 88.481 | -7,10 | 1.997 | -7,07 | ||||
| 2025-08-06 | NP | LINCOLN VARIABLE INSURANCE PRODUCTS TRUST - LVIP SSGA Global Tactical Allocation Managed Volatility Fund Standard Class | 908.039 | 73,18 | 20.494 | 73,18 | ||||
| 2025-08-15 | 13F | Truefg, Llc | 52.076 | 5,72 | 1.175 | 5,76 | ||||
| 2025-08-12 | 13F | Richard W. Paul & Associates, LLC | 6.266 | 5,63 | 141 | 6,02 | ||||
| 2025-05-09 | 13F | Frazier Financial Advisors, LLC | 0 | -100,00 | 0 | |||||
| 2025-08-14 | 13F | Two Sigma Securities, Llc | 44.693 | 119,48 | 1.009 | 119,61 | ||||
| 2025-08-11 | 13F | Outlook Wealth Advisors, LLC | 21.572 | 6,91 | 487 | 6,81 | ||||
| 2025-08-14 | 13F | Capitolis Liquid Global Markets LLC | 0 | -100,00 | 0 | |||||
| 2025-08-06 | 13F | Csenge Advisory Group | 10.365 | 0,88 | 228 | 1,79 | ||||
| 2025-08-01 | 13F | Envestnet Asset Management Inc | 1.366.362 | 6,33 | 30.839 | 6,33 | ||||
| 2025-08-07 | 13F | Guidance Capital, Inc | 17.799 | -35,34 | 401 | -33,39 | ||||
| 2025-08-08 | 13F | Capital Investment Advisory Services, LLC | 10 | 11,11 | 0 | |||||
| 2025-08-11 | 13F | Pineridge Advisors LLC | 15 | 0,00 | 0 | |||||
| 2025-07-24 | 13F | Blair William & Co/il | 994 | 22 | ||||||
| 2025-08-13 | 13F | Global Endowment Management, LP | 13.903 | 6,30 | 314 | 6,10 | ||||
| 2025-08-13 | 13F | Jones Financial Companies Lllp | 19.160 | -16,01 | 428 | -16,41 | ||||
| 2025-08-14 | 13F | Citadel Advisors Llc | Put | 0 | -100,00 | 0 | ||||
| 2025-08-11 | 13F | Private Advisor Group, LLC | 230.197 | -5,82 | 5.196 | -5,82 | ||||
| 2025-07-17 | 13F | LifeGoal Wealth Advisors | 11.669 | -20,01 | 263 | -20,06 | ||||
| 2025-05-15 | 13F | Tower Research Capital LLC (TRC) | 0 | -100,00 | 0 | |||||
| 2025-08-15 | 13F | Morgan Stanley | 1.055.906 | -3,45 | 23.832 | -3,45 | ||||
| 2025-08-14 | 13F | Citadel Advisors Llc | 0 | -100,00 | 0 | |||||
| 2025-08-05 | 13F | Westside Investment Management, Inc. | 48.599 | 95,46 | 1.097 | 95,37 | ||||
| 2025-08-14 | 13F | Citadel Advisors Llc | Call | 0 | -100,00 | 0 | ||||
| 2025-04-23 | 13F | IMG Wealth Management, Inc. | 0 | -100,00 | 0 | |||||
| 2025-08-13 | 13F | VestGen Advisors, LLC | 10.238 | 231 | ||||||
| 2025-07-21 | 13F | Ascent Group, LLC | 22.717 | 16,66 | 513 | 16,63 | ||||
| 2025-08-14 | 13F | Wiley Bros.-aintree Capital, Llc | 29.658 | -10,08 | 669 | -9,72 | ||||
| 2025-07-30 | 13F | Insight Advisors, LLC/ PA | 31.496 | -7,11 | 711 | -7,19 | ||||
| 2025-07-22 | 13F | Merit Financial Group, LLC | 27.372 | 618 | ||||||
| 2025-08-08 | 13F | Emerald Investment Partners, Llc | 10.330 | -48,03 | 233 | -47,99 | ||||
| 2025-08-14 | 13F | Susquehanna International Group, Llp | 16.692 | -85,67 | 377 | -85,70 | ||||
| 2025-08-14 | 13F | Talon Private Wealth, LLC | 1.908 | 43 | ||||||
| 2025-07-24 | 13F | Conning Inc. | 124.080 | 0,00 | 2.800 | 0,00 | ||||
| 2025-08-28 | NP | FISR - SPDR SSGA Fixed Income Sector Rotation ETF This fund is a listed as child fund of State Street Corp and if that institution has disclosed ownership in this security, then these positions will not be double counted when calculating total shares and total value | 2.039.540 | -2,28 | 46.032 | -2,28 | ||||
| 2025-08-08 | 13F | SBI Securities Co., Ltd. | 6.343 | 8,54 | 143 | 9,16 | ||||
| 2025-08-14 | 13F | Novus Advisors, Llc | 35.561 | 4,99 | 803 | 4,97 | ||||
| 2025-07-29 | 13F | Balboa Wealth Partners | 21.264 | 5,49 | 480 | 5,51 | ||||
| 2025-07-23 | 13F | Valmark Advisers, Inc. | 11.565 | -3,77 | 261 | -3,69 | ||||
| 2025-08-06 | 13F | Commonwealth Equity Services, Llc | 22.080 | 6,41 | 0 | |||||
| 2025-08-13 | 13F | GeoWealth Management, LLC | 16.424 | 11,55 | 371 | 11,45 | ||||
| 2025-05-01 | 13F | Quest 10 Wealth Builders, Inc. | 6 | 0 | ||||||
| 2025-08-14 | 13F | Wells Fargo & Company/mn | 373.193 | -27,34 | 8.423 | -27,35 | ||||
| 2025-07-10 | 13F | Sterling Financial Group, Inc. | 837.120 | 1,46 | 18.894 | 1,46 | ||||
| 2025-07-16 | 13F | Novem Group | 50.538 | 9,22 | 1.141 | 9,20 | ||||
| 2025-08-19 | 13F | Newbridge Financial Services Group, Inc. | 3.171 | 1,34 | 72 | 1,43 | ||||
| 2025-07-17 | 13F | Sound Income Strategies, LLC | 1.705 | -2,07 | 38 | -2,56 | ||||
| 2025-08-01 | 13F | Advisory Alpha, LLC | 13.251 | 5,91 | 299 | 6,03 | ||||
| 2025-08-05 | 13F | NewSquare Capital LLC | 420 | 0,00 | 9 | 0,00 | ||||
| 2025-08-13 | 13F | Northwestern Mutual Wealth Management Co | 690.540 | -22,25 | 15.585 | -22,25 | ||||
| 2025-08-06 | 13F | Decker Retirement Planning Inc. | 9.009 | 3,30 | 203 | 3,57 | ||||
| 2025-04-11 | 13F/A | Private Advisory Group LLC | 0 | -100,00 | 0 | -100,00 | ||||
| 2025-08-14 | 13F | IHT Wealth Management, LLC | 18.110 | -15,29 | 409 | -15,35 | ||||
| 2025-07-25 | 13F | Richardson Financial Services Inc. | 21.695 | 8,11 | 489 | 8,19 | ||||
| 2025-05-30 | NP | BRMSX - Bramshill Income Performance Fund Institutional Class | 106.266 | 2.398 | ||||||
| 2025-08-14 | 13F | Synovus Financial Corp | 111.543 | 6,29 | 2.518 | 6,29 | ||||
| 2025-08-13 | 13F | Vermillion & White Wealth Management Group, LLC | 44 | 0,00 | 1 | |||||
| 2025-07-14 | 13F | Iams Wealth Management, Llc | 18.024 | 27,90 | 407 | 27,67 | ||||
| 2025-07-08 | 13F | Goldstone Financial Group, LLC | 508.205 | -4,56 | 11.409 | -5,06 | ||||
| 2025-07-10 | 13F | Sharkey, Howes & Javer | 135.123 | 3.050 | ||||||
| 2025-08-28 | NP | GAL - SPDR SSGA Global Allocation ETF This fund is a listed as child fund of State Street Corp and if that institution has disclosed ownership in this security, then these positions will not be double counted when calculating total shares and total value | 405.905 | 7,84 | 9.161 | 7,84 | ||||
| 2025-08-11 | 13F | HighTower Advisors, LLC | 76.368 | 10,47 | 1.724 | 10,45 | ||||
| 2025-08-11 | 13F | Principal Securities, Inc. | 141.937 | 42,53 | 3.204 | 44,74 | ||||
| 2025-08-05 | 13F | Bank of New York Mellon Corp | 310.914 | 10,65 | 7.017 | 10,64 | ||||
| 2025-08-12 | 13F | Wayfinding Financial, LLC | 0 | -100,00 | 0 | |||||
| 2025-07-24 | 13F | Eastern Bank | 0 | -100,00 | 0 | |||||
| 2025-08-11 | 13F | Covestor Ltd | 253 | 328,81 | 0 | |||||
| 2025-08-04 | 13F | Creative Financial Designs Inc /adv | 2.617 | 36,73 | 59 | 37,21 | ||||
| 2025-07-24 | 13F | Ronald Blue Trust, Inc. | 792 | -66,89 | 18 | -67,92 | ||||
| 2025-07-28 | 13F | Axxcess Wealth Management, Llc | 49.915 | 7,00 | 1.127 | 7,03 | ||||
| 2025-08-14 | 13F | UBS Group AG | 77.937 | -77,93 | 1.759 | -77,93 | ||||
| 2025-08-12 | 13F | Proequities, Inc. | 0 | 0 | ||||||
| 2025-08-08 | 13F | Hedeker Wealth, LLC | 296.068 | -0,60 | 6.682 | -0,60 | ||||
| 2025-05-06 | 13F | Boyd Watterson Asset Management Llc/oh | 0 | -100,00 | 0 | |||||
| 2025-07-31 | 13F | Arrien Investments, Inc. | 169.298 | 3.821 | ||||||
| 2025-08-12 | 13F | BlackRock, Inc. | 173.382 | 0,90 | 3.913 | 0,90 | ||||
| 2025-08-14 | 13F | Graney & King, LLC | 172.636 | 8,73 | 3.896 | 8,74 | ||||
| 2025-08-08 | 13F | Pnc Financial Services Group, Inc. | 7.144 | -10,05 | 161 | -10,06 | ||||
| 2025-04-21 | 13F | Nelson, Van Denburg & Campbell Wealth Management Group, LLC | 0 | -100,00 | 0 | |||||
| 2025-08-14 | 13F | CoreCap Advisors, LLC | 9.111 | -9,70 | 206 | -9,69 | ||||
| 2025-04-28 | 13F | Horizon Financial Services, Llc | 0 | 0 | ||||||
| 2025-08-18 | 13F/A | National Bank Of Canada /fi/ | 2.571 | 0,00 | 58 | 0,00 | ||||
| 2025-08-08 | 13F | Cetera Investment Advisers | 128.289 | 18,69 | 2.895 | 18,70 | ||||
| 2025-08-12 | 13F | LPL Financial LLC | 3.441.026 | 6,08 | 77.664 | 6,08 | ||||
| 2025-07-18 | 13F | Lockerman Financial Group, Inc. | 23.267 | 14,14 | 525 | 14,13 | ||||
| 2025-07-10 | 13F | HF Advisory Group, LLC | 10.534 | 2,57 | 238 | 2,60 | ||||
| 2025-08-06 | 13F | AE Wealth Management LLC | 42.512 | 31,73 | 959 | 31,73 | ||||
| 2025-07-10 | 13F | Signal Advisors Wealth, LLC | 95.176 | 2.148 | ||||||
| 2025-07-10 | 13F | Wealth Enhancement Advisory Services, Llc | 27.629 | -5,01 | 620 | -5,49 | ||||
| 2025-08-08 | 13F | Gts Securities Llc | 0 | -100,00 | 0 | |||||
| 2025-08-13 | 13F | Ally Invest Advisors Inc. | 33.496 | 6,22 | 756 | 6,19 | ||||
| 2025-08-14 | 13F | Mariner, LLC | 0 | -100,00 | 0 | |||||
| 2025-08-07 | 13F | PFG Advisors | 348.930 | 8,43 | 7.875 | 8,43 | ||||
| 2025-08-11 | 13F | Advisor Resource Council | 0 | -100,00 | 0 | |||||
| 2025-08-14 | 13F | Gotham Asset Management, LLC | 347.329 | -0,27 | 7.839 | -0,27 | ||||
| 2025-08-12 | 13F | Spectrum Wealth Advisory Group, LLC | 250.218 | 5.647 | ||||||
| 2025-08-04 | 13F | Atria Investments Llc | 14.556 | -5,76 | 329 | -5,75 | ||||
| 2025-07-31 | 13F | Buckingham Strategic Partners | 9.282 | 209 | ||||||
| 2025-08-04 | 13F | Assetmark, Inc | 803.797 | 19,86 | 18.142 | 19,85 | ||||
| 2025-07-08 | 13F | Strategic Advocates LLC | 845.820 | 1,97 | 19.090 | 1,97 | ||||
| 2025-08-14 | 13F/A | Rockefeller Capital Management L.P. | 45.304 | 13,03 | 1.023 | 13,05 | ||||
| 2025-07-31 | 13F | Glass Jacobson Investment Advisors llc | 0 | -100,00 | 0 | |||||
| 2025-08-18 | 13F | N.E.W. Advisory Services LLC | 87 | 1,16 | 2 | 0,00 | ||||
| 2025-08-15 | 13F | Kestra Advisory Services, LLC | 14.089 | 318 | ||||||
| 2025-07-28 | 13F | RMR Capital Management, LLC | 23.971 | 0,00 | 541 | 0,00 | ||||
| 2025-08-14 | 13F | Sunbelt Securities, Inc. | 1.059 | 0,00 | 24 | 0,00 | ||||
| 2025-05-16 | 13F | Coppell Advisory Solutions LLC | 0 | -100,00 | 0 | -100,00 | ||||
| 2025-08-12 | 13F | O'shaughnessy Asset Management, Llc | 38 | -54,76 | 1 | -100,00 | ||||
| 2025-08-14 | 13F | Bank Of America Corp /de/ | 368.767 | -19,17 | 8.323 | -19,17 | ||||
| 2025-07-14 | 13F | Park Avenue Securities Llc | 149.248 | 0,77 | 3 | 0,00 | ||||
| 2025-08-14 | 13F | State Street Corp | 7.315.006 | 6,20 | 165.100 | 6,20 | ||||
| 2025-08-13 | 13F | Quadrature Capital Ltd | 0 | -100,00 | 0 | |||||
| 2025-08-14 | 13F | Royal Bank Of Canada | 379.880 | 9,25 | 8.574 | 9,25 | ||||
| 2025-07-29 | 13F | Koshinski Asset Management, Inc. | 48.111 | -10,31 | 1.086 | -10,33 | ||||
| 2025-07-17 | 13F | Fifth Third Securities, Inc. | 103.699 | 8,22 | 2.340 | 8,23 | ||||
| 2025-08-14 | 13F | KKM Financial LLC | 37.273 | 2,35 | 842 | 6,05 | ||||
| 2025-04-22 | 13F | Nilsine Partners, LLC | 0 | -100,00 | 0 | |||||
| 2025-08-14 | 13F | Hilltop Holdings Inc. | 10.307 | 233 | ||||||
| 2025-08-14 | 13F | Raymond James Financial Inc | 328.441 | -6,64 | 7.413 | -6,65 | ||||
| 2025-08-14 | 13F | State Of Wisconsin Investment Board | 42.920 | 0,00 | 969 | 0,00 | ||||
| 2025-07-22 | 13F | Aspire Private Capital, LLC | 178.086 | 6,84 | 4.019 | 6,86 | ||||
| 2025-08-13 | 13F | Transce3nd, LLC | 1.214 | 68,61 | 27 | 68,75 | ||||
| 2025-08-27 | NP | FFSAX - Touchstone Flexible Income Fund Class A | 0 | -100,00 | 0 | -100,00 | ||||
| 2025-08-12 | 13F | Change Path, LLC | 55.498 | 36,97 | 1.253 | 36,98 | ||||
| 2025-07-25 | 13F | Cwm, Llc | 10.373 | -7,70 | 0 | |||||
| 2025-05-02 | 13F | Transcendent Capital Group LLC | 0 | -100,00 | 0 | |||||
| 2025-08-14 | 13F | Harvest Investment Services, LLC | 10.085 | 8,98 | 228 | 9,13 | ||||
| 2025-05-02 | 13F | Capital A Wealth Management, LLC | 19 | 0 | ||||||
| 2025-08-12 | 13F | Archer Investment Corp | 2.843 | -24,63 | 64 | -24,71 | ||||
| 2025-04-09 | 13F | Milestone Asset Management, Llc | 0 | -100,00 | 0 | |||||
| 2025-07-29 | 13F | Private Trust Co Na | 8.092 | -60,91 | 183 | -61,03 | ||||
| 2025-08-14 | 13F | Mml Investors Services, Llc | 56.239 | -22,25 | 1 | 0,00 | ||||
| 2025-07-31 | 13F | Cambridge Investment Research Advisors, Inc. | 58.714 | 9,17 | 1 | 0,00 | ||||
| 2025-08-05 | 13F | Fourth Dimension Wealth, LLC | 56.170 | 13,27 | 1.268 | 13,23 | ||||
| 2025-08-12 | 13F | Global Retirement Partners, LLC | 1.933 | 28,52 | 44 | 30,30 |
Other Listings
| MX:SPLB |