Grundlæggende statistik
| Institutionelle ejere | 42 total, 37 long only, 1 short only, 4 long/short - change of 2,44% MRQ |
| Gennemsnitlig porteføljeallokering | 0.0429 % - change of -8,56% MRQ |
| Institutionelle aktier (lange) | 1.135.851 (ex 13D/G) - change of -0,71MM shares -38,54% MRQ |
| Institutionel værdi (lang) | $ 14.771 USD ($1000) |
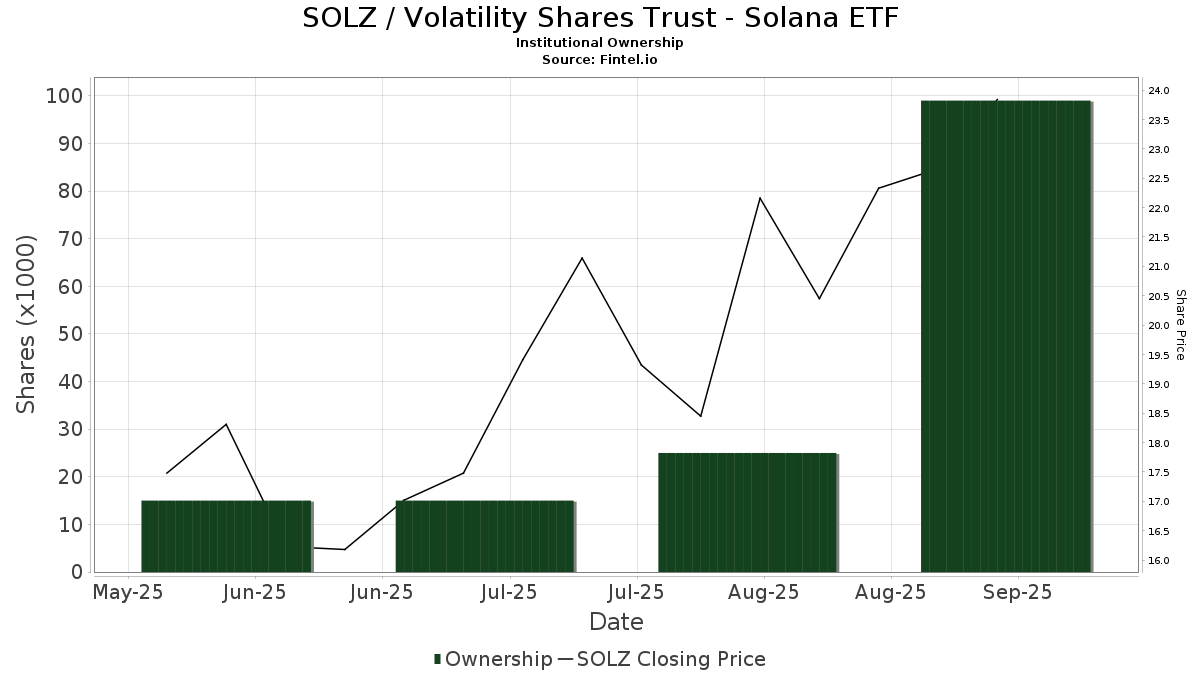
Institutionelt ejerskab og aktionærer
Volatility Shares Trust - Solana ETF (US:SOLZ) har 42 institutionelle ejere og aktionærer, der har indsendt 13D/G- eller 13F-formularer til Securities Exchange Commission (SEC). Disse institutioner har i alt 1,135,851 aktier. Største aktionærer omfatter Citadel Advisors Llc, Susquehanna International Group, Llp, DRW Securities, LLC, Hbk Investments L P, Susquehanna International Group, Llp, Galaxy Digital Capital Management GP LLC, Galaxy Group Investments LLC, Citadel Advisors Llc, Tactive Advisors, LLC, and IMC-Chicago, LLC .
Volatility Shares Trust - Solana ETF (NasdaqGM:SOLZ) institutionel ejerskabsstruktur viser aktuelle positioner i virksomheden efter institutioner og fonde, samt seneste ændringer i positionsstørrelse. Større aktionærer kan omfatte individuelle investorer, investeringsforeninger, hedgefonde eller institutioner. Skema 13D angiver, at investoren besidder (eller besidder) mere end 5 % af virksomheden og har til hensigt (eller har til hensigt at) aktivt at forfølge en ændring i forretningsstrategi. Skema 13G indikerer en passiv investering på over 5%.
The share price as of March 27, 2026 is 8,35 / share. Previously, on March 28, 2025, the share price was 14,81 / share. This represents a decline of 43,64% over that period.
Fondens stemningsscore
Fund Sentiment Score (fka Ownership Accumulation Score) finder de aktier, der bliver mest købt af fonde. Det er resultatet af en sofistikeret, multi-faktor kvantitativ model, der identificerer virksomheder med de højeste niveauer af institutionel akkumulering. Scoringsmodellen bruger en kombination af den samlede stigning i oplyste ejere, ændringerne i porteføljeallokeringer i disse ejere og andre målinger. Tallet går fra 0 til 100, hvor højere tal indikerer et højere niveau af akkumulering for sine jævnaldrende, og 50 er gennemsnittet.
Opdateringsfrekvens: Dagligt
Se Ownership Explorer, som giver en liste over højest rangerende virksomheder.
AI+ Ask Fintel’s AI assistant about Volatility Shares Trust - Solana ETF.
Select a question to share a public post with an AI-crafted answer.
Thinking of good questions…
Institutionel Put/Call-forhold
Ud over at indberette standardaktie- og gældsudstedelser skal institutter med mere end 100 mill. aktiver under forvaltning også oplyse deres put- og call-optionsbeholdninger. Da salgsoptioner generelt indikerer negativ stemning, og købsoptioner indikerer positiv stemning, kan vi få en fornemmelse af den overordnede institutionelle stemning ved at plotte forholdet mellem put og kald. Diagrammet til højre viser det historiske put/call-forhold for dette instrument.
Brug af Put/Call Ratio som en indikator for investorernes stemning overvinder en af de vigtigste mangler ved at bruge totalt institutionelt ejerskab, som er, at en betydelig mængde af aktiver under forvaltning investeres passivt for at spore indekser. Passivt forvaltede fonde køber typisk ikke optioner, så indikatoren for put/call-forholdet følger mere nøje følelsen af aktivt forvaltede fonde.

13F og NPORT arkivering
Detaljer om 13F-arkivering er gratis. Detaljer om NP-ansøgninger kræver et premium-medlemskab. Grønne rækker angiver nye positioner. Røde rækker angiver lukkede positioner. Klik på linket ikon for at se den fulde transaktionshistorik.
Opgrader
for at låse premium-data op og eksportere til Excel ![]() .
.
| Fil dato | Kilde | Investor | Type | Gennemsnitlig pris (Øst) |
Aktier | Δ Aktier (%) |
Rapporteret Værdi ($1000) |
Δ Værdi (%) |
Port Alloc (%) |
|
|---|---|---|---|---|---|---|---|---|---|---|
| 2026-02-06 | 13F | Pnc Financial Services Group, Inc. | 0 | -100,00 | 0 | |||||
| 2026-02-10 | 13F | Rothschild Investment Llc | 6.000 | 0,00 | 76 | -42,42 | ||||
| 2026-01-22 | 13F | Glass Jacobson Investment Advisors llc | 1.526 | 19 | ||||||
| 2026-01-20 | 13F | Toth Financial Advisory Corp | 100 | 1 | ||||||
| 2026-02-02 | 13F | Montag A & Associates Inc | 2.751 | 0,00 | 35 | -41,67 | ||||
| 2026-02-11 | 13F | Parallel Advisors, LLC | 3.388 | 0,00 | 43 | -41,89 | ||||
| 2026-01-16 | 13F | Heck Capital Advisors, LLC | 0 | -100,00 | 0 | |||||
| 2026-02-17 | 13F | Susquehanna International Group, Llp | 261.978 | -58,29 | 3.338 | -75,98 | ||||
| 2026-02-17 | 13F | Susquehanna International Group, Llp | Put | 61.900 | -83,38 | 789 | -90,44 | |||
| 2026-03-23 | 13F | Galaxy Digital Capital Management GP LLC | 94.211 | 1.200 | ||||||
| 2026-02-13 | 13F | MAI Capital Management | 1.300 | 44,44 | 17 | -15,79 | ||||
| 2026-02-13 | 13F | MAI Capital Management | Call | 9 | 300,00 | |||||
| 2026-02-13 | 13F | Vienna Asset Management LLC | 10.454 | -87,06 | 133 | -92,56 | ||||
| 2026-02-17 | 13F | Susquehanna International Group, Llp | Call | 107.800 | -32,12 | 1.373 | -60,91 | |||
| 2026-02-17 | 13F | Bank Of America Corp /de/ | 10.296 | 27,17 | 131 | -26,82 | ||||
| 2026-02-12 | 13F | Marex Group plc | 0 | -100,00 | 0 | |||||
| 2026-01-29 | 13F | UBS Group AG | 11.533 | 154,20 | 147 | 46,00 | ||||
| 2026-02-12 | 13F | DRW Securities, LLC | 203.824 | 1.623,96 | 2.597 | 894,64 | ||||
| 2026-02-12 | 13F | Jane Street Group, Llc | 0 | -100,00 | 0 | -100,00 | ||||
| 2026-02-12 | 13F | Jane Street Group, Llc | Call | 51.700 | -28,98 | 659 | -59,13 | |||
| 2026-02-17 | 13F | Captrust Financial Advisors | 11.012 | 140 | ||||||
| 2026-02-12 | 13F | Jane Street Group, Llc | Put | 55.200 | 72,50 | 703 | -0,57 | |||
| 2026-01-15 | 13F | Westend Capital Management LLC | 74 | 722,22 | 1 | |||||
| 2026-02-13 | 13F | Kestra Advisory Services, LLC | 1.930 | 25 | ||||||
| 2026-02-13 | 13F | Visionary Wealth Advisors | 13.210 | 15,37 | 168 | -33,60 | ||||
| 2026-02-12 | 13F | Front Row Advisors LLC | 0 | -100,00 | 0 | |||||
| 2026-02-18 | 13F | Caitlin John, LLC | 142 | -44,53 | 2 | -80,00 | ||||
| 2026-02-13 | 13F | Resources Investment Advisors, LLC. | 16.045 | 204 | ||||||
| 2026-02-17 | 13F | Cresset Asset Management, LLC | 0 | -100,00 | 0 | -100,00 | ||||
| 2025-10-30 | 13F | Twin Peaks Wealth Advisors, LLC | 0 | -100,00 | 0 | |||||
| 2026-02-13 | 13F | Flow Traders U.s. Llc | 10.782 | 0 | ||||||
| 2026-01-21 | 13F | Sound Income Strategies, LLC | 354 | 0,00 | 5 | -37,50 | ||||
| 2026-01-29 | 13F | IMC-Chicago, LLC | 70.582 | 899 | ||||||
| 2026-02-17 | 13F | Advisory Services Network, LLC | 0 | -100,00 | 0 | |||||
| 2026-02-13 | 13F | Mariner, LLC | 11.133 | 142 | ||||||
| 2026-02-17 | 13F | Advisor Group Holdings, Inc. | 0 | -100,00 | 0 | |||||
| 2026-02-05 | 13F | High Note Wealth, LLC | 10 | -99,10 | 0 | -100,00 | ||||
| 2026-02-17 | 13F | VR Advisory Services Ltd | 58.000 | 0,00 | 739 | -42,43 | ||||
| 2026-02-13 | 13F | Colony Group, LLC | 14.248 | -1,51 | 182 | -43,44 | ||||
| 2026-02-17 | 13F | J. Goldman & Co LP | 0 | -100,00 | 0 | |||||
| 2026-02-13 | 13F | Centaurus Financial, Inc. | 13.000 | -2,26 | 0 | |||||
| 2026-02-06 | 13F | IFP Advisors, Inc | 800 | 300,00 | 10 | 150,00 | ||||
| 2026-01-26 | 13F | Reyes Financial Architecture, Inc. | 0 | -100,00 | 0 | |||||
| 2026-02-11 | 13F | Group One Trading, L.p. | 0 | -100,00 | 0 | |||||
| 2026-02-10 | 13F | Belvedere Trading LLC | 0 | -100,00 | 0 | |||||
| 2026-02-17 | 13F | Tower Research Capital LLC (TRC) | 109 | 81,67 | 1 | 0,00 | ||||
| 2026-02-17 | 13F | Strive Financial Group ,LLC | 8 | 0 | ||||||
| 2026-02-17 | 13F | Hbk Investments L P | Put | 150.000 | -52,17 | 1.911 | -72,45 | |||
| 2026-01-27 | 13F | Brighton Jones Llc | 0 | -100,00 | 0 | |||||
| 2026-01-30 | 13F | Verity Asset Management, Inc. | 0 | -100,00 | 0 | |||||
| 2026-01-08 | 13F | Chesapeake Asset Management Llc | 300 | 4 | ||||||
| 2026-01-15 | 13F | Highline Wealth Partners Llc | 550 | 7 | ||||||
| 2026-01-28 | 13F | Quaker Wealth Management, LLC | 511 | -36,91 | 7 | -64,71 | ||||
| 2026-02-12 | 13F | Renaissance Technologies Llc | 0 | -100,00 | 0 | |||||
| 2026-02-13 | 13F | Neuberger Berman Group LLC | 60.100 | 766 | ||||||
| 2026-02-12 | 13F | DRW Securities, LLC | Call | 0 | -100,00 | 0 | -100,00 | |||
| 2026-02-12 | 13F | DRW Securities, LLC | Put | 0 | -100,00 | 0 | -100,00 | |||
| 2026-02-12 | 13F | Ankerstar Wealth, LLC | 140 | 2 | ||||||
| 2025-11-14 | 13F | Militia Capital Partners, LP | 0 | -100,00 | 0 | |||||
| 2026-01-30 | 13F | Us Bancorp \de\ | 2.487 | 32 | ||||||
| 2026-02-06 | 13F | Copia Wealth Management | 0 | -100,00 | 0 | |||||
| 2026-02-06 | 13F | EverSource Wealth Advisors, LLC | 25 | 150,00 | 0 | |||||
| 2026-02-17 | 13F | Cantor Fitzgerald, L. P. | 0 | -100,00 | 0 | -100,00 | ||||
| 2026-02-18 | 13F | Galaxy Group Investments LLC | 94.211 | 1.200 | ||||||
| 2026-01-09 | 13F | Tactive Advisors, LLC | 72.991 | -0,78 | 930 | -42,90 | ||||
| 2026-02-17 | 13F | Citadel Advisors Llc | Call | 336.900 | 129,81 | 4.292 | 32,39 | |||
| 2026-02-17 | 13F | Citadel Advisors Llc | Put | 86.100 | -34,92 | 1.097 | -62,54 | |||
| 2026-02-17 | 13F | Citadel Advisors Llc | 13.492 | 172 | ||||||
| 2025-11-14 | 13F | Wolverine Trading, Llc | 62.244 | 1.414 | ||||||
| 2025-11-14 | 13F | Wolverine Trading, Llc | Call | 28.700 | 652 | |||||
| 2026-02-10 | 13F | Belvedere Trading LLC | Put | 0 | -100,00 | 0 | ||||
| 2026-02-11 | 13F | Simplex Trading, Llc | 0 | -100,00 | 0 | |||||
| 2026-02-23 | 13F | Virtu Financial LLC | 0 | -100,00 | 0 | |||||
| 2025-11-14 | 13F | Wolverine Trading, Llc | Put | 60.700 | 1.378 | |||||
| 2026-02-10 | 13F | Belvedere Trading LLC | Call | 0 | -100,00 | 0 |