Grundlæggende statistik
| Institutionelle ejere | 199 total, 199 long only, 0 short only, 0 long/short - change of 3,09% MRQ |
| Gennemsnitlig porteføljeallokering | 0.2475 % - change of -1,52% MRQ |
| Institutionelle aktier (lange) | 19.540.733 (ex 13D/G) - change of 3,01MM shares 18,21% MRQ |
| Institutionel værdi (lang) | $ 1.272.440 USD ($1000) |
Institutionelt ejerskab og aktionærer
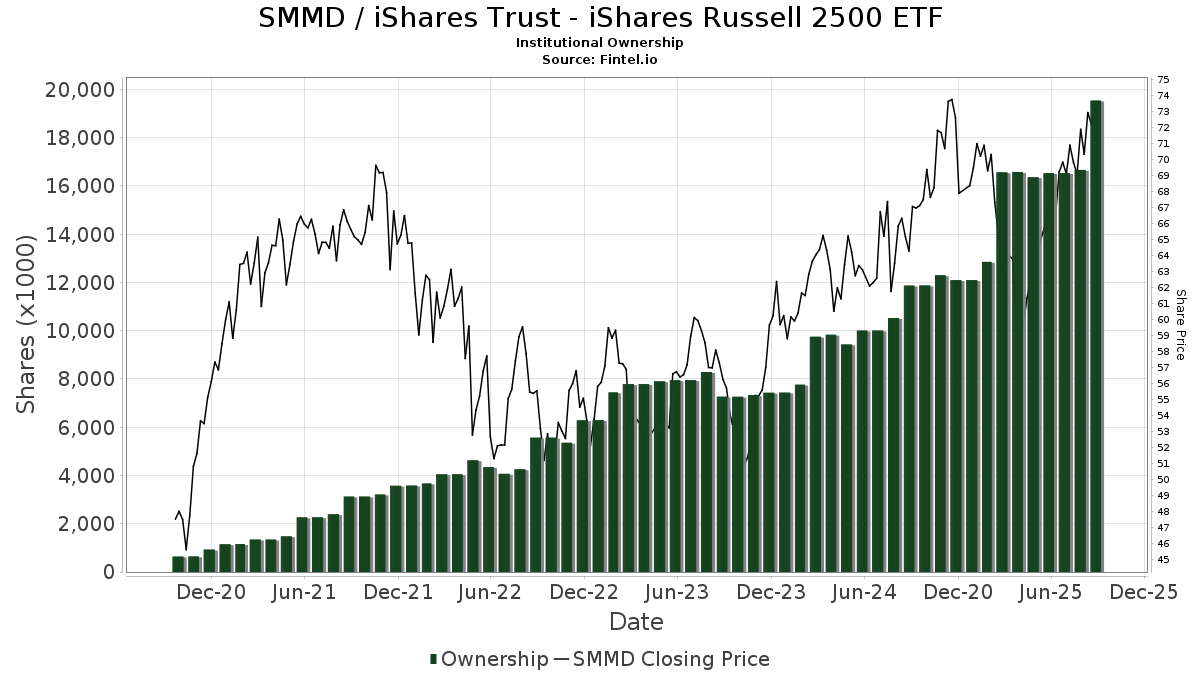
iShares Trust - iShares Russell 2500 ETF (US:SMMD) har 199 institutionelle ejere og aktionærer, der har indsendt 13D/G- eller 13F-formularer til Securities Exchange Commission (SEC). Disse institutioner har i alt 19,540,733 aktier. Største aktionærer omfatter Glenmede Investment Management, LP, Glenmede Trust Co Na, Fort Washington Investment Advisors Inc /oh/, Coldstream Capital Management Inc, Bank Of America Corp /de/, CENTRAL TRUST Co, Fmr Llc, Cresset Asset Management, LLC, Fifth Third Bancorp, and Wealthspire Advisors, LLC .
iShares Trust - iShares Russell 2500 ETF (BATS:SMMD) institutionel ejerskabsstruktur viser aktuelle positioner i virksomheden efter institutioner og fonde, samt seneste ændringer i positionsstørrelse. Større aktionærer kan omfatte individuelle investorer, investeringsforeninger, hedgefonde eller institutioner. Skema 13D angiver, at investoren besidder (eller besidder) mere end 5 % af virksomheden og har til hensigt (eller har til hensigt at) aktivt at forfølge en ændring i forretningsstrategi. Skema 13G indikerer en passiv investering på over 5%.
The share price as of September 12, 2025 is 73,70 / share. Previously, on September 16, 2024, the share price was 66,57 / share. This represents an increase of 10,71% over that period.
Fondens stemningsscore
Fund Sentiment Score (fka Ownership Accumulation Score) finder de aktier, der bliver mest købt af fonde. Det er resultatet af en sofistikeret, multi-faktor kvantitativ model, der identificerer virksomheder med de højeste niveauer af institutionel akkumulering. Scoringsmodellen bruger en kombination af den samlede stigning i oplyste ejere, ændringerne i porteføljeallokeringer i disse ejere og andre målinger. Tallet går fra 0 til 100, hvor højere tal indikerer et højere niveau af akkumulering for sine jævnaldrende, og 50 er gennemsnittet.
Opdateringsfrekvens: Dagligt
Se Ownership Explorer, som giver en liste over højest rangerende virksomheder.
Institutionel Put/Call-forhold
Ud over at indberette standardaktie- og gældsudstedelser skal institutter med mere end 100 mill. aktiver under forvaltning også oplyse deres put- og call-optionsbeholdninger. Da salgsoptioner generelt indikerer negativ stemning, og købsoptioner indikerer positiv stemning, kan vi få en fornemmelse af den overordnede institutionelle stemning ved at plotte forholdet mellem put og kald. Diagrammet til højre viser det historiske put/call-forhold for dette instrument.
Brug af Put/Call Ratio som en indikator for investorernes stemning overvinder en af de vigtigste mangler ved at bruge totalt institutionelt ejerskab, som er, at en betydelig mængde af aktiver under forvaltning investeres passivt for at spore indekser. Passivt forvaltede fonde køber typisk ikke optioner, så indikatoren for put/call-forholdet følger mere nøje følelsen af aktivt forvaltede fonde.
13F og NPORT arkivering
Detaljer om 13F-arkivering er gratis. Detaljer om NP-ansøgninger kræver et premium-medlemskab. Grønne rækker angiver nye positioner. Røde rækker angiver lukkede positioner. Klik på linket ikon for at se den fulde transaktionshistorik.
Opgrader
for at låse premium-data op og eksportere til Excel ![]() .
.
| Fil dato | Kilde | Investor | Type | Gennemsnitlig pris (Øst) |
Aktier | Δ Aktier (%) |
Rapporteret Værdi ($1000) |
Δ Værdi (%) |
Port Alloc (%) |
|
|---|---|---|---|---|---|---|---|---|---|---|
| 2025-08-14 | 13F | Susquehanna International Group, Llp | 72.722 | -35,85 | 4.929 | -30,47 | ||||
| 2025-07-30 | 13F | D.a. Davidson & Co. | 4.560 | 9,75 | 309 | 19,31 | ||||
| 2025-05-02 | 13F | Transcendent Capital Group LLC | 0 | -100,00 | 0 | |||||
| 2025-07-18 | 13F | Wetzel Investment Advisors, Inc. | 0 | -100,00 | 0 | |||||
| 2025-07-24 | 13F | Strong Tower Advisory Services | 10.749 | -1,87 | 729 | 18,76 | ||||
| 2025-08-14 | 13F | Mariner, LLC | 70.830 | 17,69 | 4.801 | 27,56 | ||||
| 2025-04-25 | 13F | Essex Financial Services, Inc. | 0 | -100,00 | 0 | |||||
| 2025-07-15 | 13F | Fifth Third Bancorp | 520.073 | -5,18 | 35.251 | 2,77 | ||||
| 2025-07-18 | 13F | SigFig Wealth Management, LLC | 95.048 | 36,77 | 6.423 | 47,52 | ||||
| 2025-07-22 | 13F | Simplicity Wealth,LLC | 171.088 | 21,90 | 11.596 | 32,12 | ||||
| 2025-07-22 | 13F | Legacy Trust | 0 | -100,00 | 0 | |||||
| 2025-08-08 | 13F | Citizens Financial Group Inc/ri | 3.527 | -6,02 | 239 | 2,14 | ||||
| 2025-07-28 | 13F | Ritholtz Wealth Management | 3.286 | 0,34 | 223 | 8,82 | ||||
| 2025-07-25 | 13F | Fifth Third Wealth Advisors LLC | 12.498 | -16,09 | 847 | -9,02 | ||||
| 2025-08-15 | 13F | Kestra Advisory Services, LLC | 14.377 | -0,21 | 974 | 8,10 | ||||
| 2025-08-14 | 13F | D. E. Shaw & Co., Inc. | 11.853 | 0,00 | 803 | 8,09 | ||||
| 2025-08-07 | 13F | Brio Consultants, LLC | 169.041 | -11,84 | 11.458 | -4,45 | ||||
| 2025-07-25 | 13F | Cwm, Llc | 12.979 | -1,09 | 1 | |||||
| 2025-08-14 | 13F | Atomi Financial Group, Inc. | 3.668 | -32,82 | 249 | -27,27 | ||||
| 2025-08-26 | 13F/A | Thrivent Financial For Lutherans | 0 | -100,00 | 0 | |||||
| 2025-08-11 | 13F | TRUE Private Wealth Advisors | 4.307 | -0,14 | 292 | 8,18 | ||||
| 2025-08-06 | 13F | OneAscent Wealth Management LLC | 7.897 | 14,87 | 1 | |||||
| 2025-08-14 | 13F | Hurley Capital, LLC | 0 | -100,00 | 0 | |||||
| 2025-08-01 | 13F | Centerpoint Advisors, LLC | 30.637 | 2 | ||||||
| 2025-08-05 | 13F | Bank of New York Mellon Corp | 3.834 | 1,00 | 260 | 9,28 | ||||
| 2025-08-08 | 13F | Creative Planning | 12.183 | -19,75 | 826 | -13,07 | ||||
| 2025-07-15 | 13F | Td Private Client Wealth Llc | 2.933 | 2,84 | 199 | 11,24 | ||||
| 2025-05-21 | 13F/A | Geneos Wealth Management Inc. | 295 | 851,61 | 18 | 800,00 | ||||
| 2025-08-14 | 13F | Fuller & Thaler Asset Management, Inc. | 9.058 | 91,62 | 614 | 107,80 | ||||
| 2025-08-12 | 13F | SRS Capital Advisors, Inc. | 677 | 46 | ||||||
| 2025-04-15 | 13F | Integrated Advisors Network LLC | 0 | -100,00 | 0 | |||||
| 2025-08-04 | 13F | Assetmark, Inc | 61 | -12,86 | 4 | 0,00 | ||||
| 2025-07-30 | 13F | Klingenstein Fields & Co Lp | 22.700 | 0,00 | 1.539 | 8,39 | ||||
| 2025-08-15 | 13F | Morgan Stanley | 72.199 | -39,46 | 4.894 | -34,38 | ||||
| 2025-09-04 | 13F/A | Advisor Group Holdings, Inc. | 280.032 | 199,87 | 18.974 | 224,82 | ||||
| 2025-07-08 | 13F | Parallel Advisors, LLC | 1.701 | -14,99 | 115 | -8,00 | ||||
| 2025-08-11 | 13F | Annis Gardner Whiting Capital Advisors, LLC | 1.942 | 0,00 | 132 | 8,26 | ||||
| 2025-05-16 | 13F/A | Kestra Investment Management, LLC | 0 | -100,00 | 0 | |||||
| 2025-08-14 | 13F | Qube Research & Technologies Ltd | 37 | 3 | ||||||
| 2025-08-14 | 13F | Mml Investors Services, Llc | 41.474 | 22,67 | 3 | 0,00 | ||||
| 2025-05-15 | 13F | Guardian Wealth Advisors, Llc / Nc | 0 | -100,00 | 0 | |||||
| 2025-07-31 | 13F | AlTi Global, Inc. | 32.787 | 461,13 | 2.255 | 517,81 | ||||
| 2025-08-14 | 13F | Hrt Financial Lp | 6.224 | -59,38 | 0 | |||||
| 2025-08-14 | 13F | Jane Street Group, Llc | 22.002 | -71,43 | 1.491 | -69,03 | ||||
| 2025-08-04 | 13F | Mayflower Financial Advisors, LLC | 5.020 | 0,50 | 340 | 8,97 | ||||
| 2025-08-14 | 13F | GWM Advisors LLC | 6.304 | 299,75 | 427 | 335,71 | ||||
| 2025-08-14 | 13F | Bbr Partners, Llc | 11.206 | 760 | ||||||
| 2025-07-10 | 13F | Financial Management Network Inc | 5.363 | -2,12 | 373 | 21,90 | ||||
| 2025-08-01 | 13F | First Command Advisory Services, Inc. | 648 | 44 | ||||||
| 2025-08-05 | 13F | GPS Wealth Strategies Group, LLC | 166 | 0,00 | 11 | 10,00 | ||||
| 2025-07-10 | 13F | Exchange Traded Concepts, Llc | 3.306 | 224 | ||||||
| 2025-08-14 | 13F | Goldman Sachs Group Inc | 9.259 | -23,11 | 628 | -16,73 | ||||
| 2025-07-22 | 13F | DT Investment Partners, LLC | 20 | 0,00 | 1 | 0,00 | ||||
| 2025-08-13 | 13F | Russell Investments Group, Ltd. | 1.210 | 82 | ||||||
| 2025-04-10 | 13F | Bremer Bank National Association | 8.977 | 0,00 | 561 | -8,03 | ||||
| 2025-08-06 | 13F | Van Cleef Asset Management,Inc | 3.885 | 0,00 | 263 | 8,68 | ||||
| 2025-08-14 | 13F | Royal Bank Of Canada | 82.855 | 42,18 | 5.617 | 54,14 | ||||
| 2025-08-12 | 13F | Franklin Resources Inc | 4.853 | 329 | ||||||
| 2025-08-05 | 13F | Huntington National Bank | 1.160 | 1,84 | ||||||
| 2025-08-13 | 13F | BCJ Capital Management, LLC | 35.916 | 24,01 | 2.434 | 34,40 | ||||
| 2025-08-13 | 13F | Congress Wealth Management LLC / DE / | 0 | -100,00 | 0 | |||||
| 2025-07-31 | 13F | Cambridge Investment Research Advisors, Inc. | 10.045 | -15,78 | 1 | |||||
| 2025-08-06 | 13F | AE Wealth Management LLC | 3 | 0,00 | 0 | |||||
| 2025-08-15 | 13F | CI Private Wealth, LLC | 12.156 | -24,11 | 824 | -17,78 | ||||
| 2025-05-13 | 13F | Measured Risk Portfolios, Inc. | 0 | -100,00 | 0 | |||||
| 2025-07-17 | 13F | Fort Washington Investment Advisors Inc /oh/ | 1.504.650 | 0,00 | 101.985 | 8,38 | ||||
| 2025-07-09 | 13F | Harbor Capital Advisors, Inc. | 144.956 | -28,59 | 10 | -25,00 | ||||
| 2025-07-16 | 13F/A | CX Institutional | 62.130 | 26,26 | 4 | 33,33 | ||||
| 2025-07-21 | 13F | Ntv Asset Management Llc | 2.975 | 202 | ||||||
| 2025-08-14 | 13F | Camden Capital, LLC | 10.676 | -3,31 | 724 | 4,78 | ||||
| 2025-05-05 | 13F | Lindbrook Capital, Llc | 0 | -100,00 | 0 | |||||
| 2025-05-15 | 13F/A | Orion Portfolio Solutions, LLC | 120.498 | -20,11 | 7.536 | -26,54 | ||||
| 2025-07-23 | 13F | Canopy Partners, LLC | 3.523 | -76,99 | 239 | -75,13 | ||||
| 2025-07-28 | 13F | Fairman Group, LLC | 1.637 | 634,08 | 111 | |||||
| 2025-08-05 | 13F | Bank Of Montreal /can/ | 1.225 | 0,00 | 83 | 9,21 | ||||
| 2025-08-13 | 13F | Quadrant Capital Group Llc | 23.172 | -0,64 | 1.571 | 7,68 | ||||
| 2025-08-14 | 13F | Fmr Llc | 609.648 | -19,03 | 41.322 | -12,25 | ||||
| 2025-08-06 | 13F | Commonwealth Equity Services, Llc | 126.877 | -4,00 | 9 | 0,00 | ||||
| 2025-08-11 | 13F | Wealthspire Advisors, LLC | 503.388 | 4,44 | 34.120 | 13,19 | ||||
| 2025-08-11 | 13F | Empowered Funds, LLC | 5.696 | 386 | ||||||
| 2025-04-30 | 13F | Bridges Investment Management Inc | 0 | -100,00 | 0 | |||||
| 2025-07-22 | 13F | Wealthcare Advisory Partners LLC | 180.047 | 181,80 | 12.204 | 205,46 | ||||
| 2025-07-21 | 13F | Ameritas Advisory Services, LLC | 6 | 0 | ||||||
| 2025-07-21 | 13F | Andina Capital Management, LLC | 38.942 | 20,92 | 2.639 | 31,03 | ||||
| 2025-07-23 | 13F | L.K. Benson & Company, P.C. | 11.730 | 0,80 | 795 | 9,35 | ||||
| 2025-08-14 | 13F | Ameriprise Financial Inc | 41.345 | -0,36 | 2.802 | 7,98 | ||||
| 2025-08-01 | 13F | Envestnet Asset Management Inc | 256.516 | 1,88 | 17.387 | 10,41 | ||||
| 2025-07-17 | 13F | Janney Montgomery Scott LLC | 53.054 | -4,00 | 4 | 0,00 | ||||
| 2025-07-07 | 13F | Global Wealth Strategies & Associates | 207 | 0,00 | 14 | 16,67 | ||||
| 2025-08-08 | 13F | Advyzon Investment Management, LLC | 7.210 | 0,00 | 489 | 8,44 | ||||
| 2025-08-01 | 13F | GoalVest Advisory LLC | 2.039 | -53,01 | 138 | -49,08 | ||||
| 2025-08-13 | 13F | Flow Traders U.s. Llc | 0 | -100,00 | 0 | |||||
| 2025-07-17 | 13F | CWA Asset Management Group, LLC | 152.710 | 6,85 | 10.351 | 15,80 | ||||
| 2025-07-24 | 13F | Us Bancorp \de\ | 326.022 | -4,20 | 22.098 | 3,82 | ||||
| 2025-08-14 | 13F | Legacy Advisory Services, LLC | 6.846 | -7,62 | 464 | 0,22 | ||||
| 2025-08-14 | 13F | Wells Fargo & Company/mn | 12.585 | 236,23 | 853 | 264,10 | ||||
| 2025-08-06 | 13F | Vantage Financial Partners, LLC | 3.887 | 0,00 | 263 | 8,23 | ||||
| 2025-08-14 | 13F | UBS Group AG | 323.310 | 16,97 | 21.914 | 26,77 | ||||
| 2025-08-13 | 13F | EverSource Wealth Advisors, LLC | 0 | -100,00 | 0 | |||||
| 2025-08-15 | 13F | Captrust Financial Advisors | 14.248 | 26,12 | 966 | 36,69 | ||||
| 2025-08-12 | 13F | MAI Capital Management | 59.098 | 2.596,08 | 4.006 | 2.823,36 | ||||
| 2025-07-28 | 13F | Evernest Financial Advisors, LLC | 8.598 | 583 | ||||||
| 2025-08-07 | 13F | Lakeridge Wealth Management LLC | 7.195 | -8,55 | 488 | -1,02 | ||||
| 2025-05-05 | 13F | Eagle Bay Advisors LLC | 0 | -100,00 | 0 | -100,00 | ||||
| 2025-08-12 | 13F | O'shaughnessy Asset Management, Llc | 10.288 | 17,78 | 697 | 27,66 | ||||
| 2025-07-08 | 13F | Little House Capital Llc | 6.108 | -19,05 | 414 | -12,10 | ||||
| 2025-07-10 | 13F | Charter Oak Capital Management, LLC | 15.278 | -5,43 | 1.036 | 2,48 | ||||
| 2025-07-25 | 13F | Apollon Wealth Management, LLC | 12.530 | 0,00 | 849 | 8,43 | ||||
| 2025-08-13 | 13F | Northern Trust Corp | 21.004 | 19,76 | 1.424 | 29,84 | ||||
| 2025-04-22 | 13F/A | NorthRock Partners, LLC | 0 | -100,00 | 0 | -100,00 | ||||
| 2025-08-14 | 13F | Catalyst Financial Partners Llc | 88.183 | 37,19 | 5.977 | 48,72 | ||||
| 2025-07-24 | 13F/A | TFR Capital, LLC. | 13.959 | -13,63 | 946 | -6,34 | ||||
| 2025-07-07 | 13F | O'Connor Financial Group LLC | 4.957 | 26,16 | 345 | 40,82 | ||||
| 2025-07-21 | 13F | Ameriflex Group, Inc. | 89 | 0,00 | 6 | 20,00 | ||||
| 2025-07-24 | 13F | Ronald Blue Trust, Inc. | 53 | 0,00 | 4 | 0,00 | ||||
| 2025-08-13 | 13F | Cerity Partners LLC | 7.709 | -0,77 | 523 | 7,63 | ||||
| 2025-08-14 | 13F | EP Wealth Advisors, Inc. | 6.364 | -4,79 | 431 | 3,11 | ||||
| 2025-08-05 | 13F | Plante Moran Financial Advisors, LLC | 477 | 187,35 | 32 | 220,00 | ||||
| 2025-08-13 | 13F | IAG Wealth Partners, LLC | 815 | -48,90 | 55 | -44,44 | ||||
| 2025-08-14 | 13F | Colony Group, LLC | 491.438 | 21,47 | 33.313 | 31,66 | ||||
| 2025-07-28 | 13F | RFG Advisory, LLC | 11.366 | -15,00 | 770 | -7,89 | ||||
| 2025-08-11 | 13F | HighTower Advisors, LLC | 113.403 | -8,73 | 7.686 | -1,08 | ||||
| 2025-08-14 | 13F | Raymond James Financial Inc | 158.394 | -13,91 | 10.736 | -6,70 | ||||
| 2025-07-15 | 13F | Mather Group, Llc. | 4.067 | 0,00 | 276 | 8,27 | ||||
| 2025-08-14 | 13F | Smartleaf Asset Management LLC | 39.282 | 2,29 | 2.655 | 10,31 | ||||
| 2025-09-04 | 13F | SevenBridge Financial Group, LLC | 3.906 | -44,92 | 275 | -40,99 | ||||
| 2025-08-12 | 13F | Proequities, Inc. | 0 | 0 | ||||||
| 2025-07-24 | 13F | Blair William & Co/il | 212.306 | -2,52 | 14.390 | 5,65 | ||||
| 2025-07-24 | 13F | Ulland Investment Advisors, LLC | 18.505 | -8,21 | 1 | 0,00 | ||||
| 2025-07-28 | 13F | Harbour Investments, Inc. | 386 | -30,20 | 26 | -23,53 | ||||
| 2025-07-21 | 13F | Single Point Partners, LLC | 12.443 | 0,00 | 0 | |||||
| 2025-08-14 | 13F | Two Sigma Securities, Llc | 0 | -100,00 | 0 | |||||
| 2025-08-01 | 13F | Rossby Financial, LCC | 92.198 | 10,28 | 6.249 | 22,53 | ||||
| 2025-08-14 | 13F | Dimension Capital Management Llc | 3.665 | 0,00 | 248 | 8,30 | ||||
| 2025-08-01 | 13F | Bessemer Group Inc | 2.630 | 0 | ||||||
| 2025-04-17 | 13F | Chicago Capital, LLC | 0 | -100,00 | 0 | |||||
| 2025-08-14 | 13F | Comerica Bank | 6.874 | 303,64 | 466 | 338,68 | ||||
| 2025-07-09 | 13F | Heritage Family Offices, LLP | 219.991 | -0,00 | 13.785 | 0,19 | ||||
| 2025-07-25 | 13F | Johnson Investment Counsel Inc | 22.217 | 18,33 | 1.506 | 28,19 | ||||
| 2025-07-16 | 13F | Perigon Wealth Management, LLC | 7.028 | 56,84 | 476 | 70,00 | ||||
| 2025-08-11 | 13F | Aptus Capital Advisors, LLC | 5.157 | -44,24 | 350 | -39,62 | ||||
| 2025-08-27 | 13F/A | Brinker Capital Investments, LLC | 121.015 | 0,43 | 8.202 | 8,85 | ||||
| 2025-05-14 | 13F | One Capital Management, LLC | 0 | -100,00 | 0 | |||||
| 2025-08-13 | 13F | SageView Advisory Group, LLC | 5.081 | -8,25 | 357 | 3,18 | ||||
| 2025-08-14 | 13F | Old Mission Capital Llc | 4.995 | 339 | ||||||
| 2025-08-13 | 13F | Sepio Capital, LP | 0 | -100,00 | 0 | |||||
| 2025-07-18 | 13F | Pure Financial Advisors, Inc. | 14.772 | 30,40 | 1.001 | 41,38 | ||||
| 2025-08-12 | 13F | CIBC Private Wealth Group, LLC | 950 | -45,81 | 64 | -33,33 | ||||
| 2025-08-14 | 13F | Citadel Advisors Llc | 30.139 | 37,41 | 2.043 | 48,94 | ||||
| 2025-08-04 | 13F | Spire Wealth Management | 2.264 | 374,63 | 153 | 427,59 | ||||
| 2025-08-12 | 13F | Putnam Fl Investment Management Co | 6.614 | -46,35 | 448 | -41,89 | ||||
| 2025-05-12 | 13F | National Bank Of Canada /fi/ | 0 | -100,00 | 0 | -100,00 | ||||
| 2025-07-10 | 13F | HF Advisory Group, LLC | 18.803 | -1,82 | 1.274 | 6,43 | ||||
| 2025-07-15 | 13F | James J. Burns & Company, LLC | 77.867 | 12,17 | 5.278 | 21,56 | ||||
| 2025-08-06 | 13F | Savant Capital, LLC | 9.820 | -2,92 | 666 | 5,22 | ||||
| 2025-08-05 | 13F | Benchmark Financial Wealth Advisors, LLC | 71.026 | 18,90 | 4.814 | 28,89 | ||||
| 2025-08-14 | 13F | Diversify Wealth Management, Llc | 3.428 | 0,12 | 242 | 14,76 | ||||
| 2025-07-14 | 13F | Armstrong Advisory Group, Inc | 0 | -100,00 | 0 | |||||
| 2025-07-22 | 13F | Berger Financial Group, Inc | 138.848 | 4,84 | 9.411 | 13,63 | ||||
| 2025-08-12 | 13F | LPL Financial LLC | 158.245 | 19,88 | 10.726 | 29,92 | ||||
| 2025-07-16 | 13F | Congress Asset Management Co /ma | 57.687 | -67,42 | 3.910 | -64,69 | ||||
| 2025-08-13 | 13F | Baird Financial Group, Inc. | 46.169 | 2,47 | 3.129 | 11,08 | ||||
| 2025-08-13 | 13F | Northwestern Mutual Wealth Management Co | 21.576 | 60,45 | 1.462 | 73,84 | ||||
| 2025-07-21 | 13F | Greenwood Capital Associates Llc | 2.977 | 202 | ||||||
| 2025-08-07 | 13F | Altman Advisors, Inc. | 22.279 | 5,29 | 322 | 5,57 | ||||
| 2025-08-08 | 13F | Cetera Investment Advisers | 8.827 | -56,13 | 598 | -52,46 | ||||
| 2025-08-01 | 13F | Twin Lakes Capital Management, LLC | 334 | 0,00 | 23 | 10,00 | ||||
| 2025-08-13 | 13F | Capital Analysts, Inc. | 3.966 | 0,00 | 0 | |||||
| 2025-07-17 | 13F | SC&H Financial Advisors, Inc. | 0 | -100,00 | 0 | |||||
| 2025-08-13 | 13F | Mayfair Advisory Group, LLC | 7.203 | 7,68 | 496 | 18,42 | ||||
| 2025-08-11 | 13F | Cornerstone Planning Group LLC | 1.210 | -1,63 | 84 | 13,70 | ||||
| 2025-07-30 | 13F | Retirement Planning Group | 43.462 | 219,90 | 2.946 | 246,88 | ||||
| 2025-08-11 | 13F | Great Lakes Advisors, Llc | 25.637 | 1.738 | ||||||
| 2025-07-11 | 13F | Farther Finance Advisors, LLC | 822 | 0,00 | 56 | 7,84 | ||||
| 2025-07-16 | 13F | Kendall Capital Management | 310.495 | 2,46 | 21.045 | 11,05 | ||||
| 2025-08-14 | 13F | Gerber Kawasaki Wealth & Investment Management | 115.875 | 7.854 | ||||||
| 2025-08-14 | 13F | Quantinno Capital Management LP | 3.429 | 232 | ||||||
| 2025-07-24 | 13F | IFP Advisors, Inc | 157 | 0,00 | 11 | 11,11 | ||||
| 2025-07-25 | 13F | Atria Wealth Solutions, Inc. | 0 | -100,00 | 0 | -100,00 | ||||
| 2025-07-17 | 13F | Catalytic Wealth RIA, LLC | 17.114 | -3,92 | 1.160 | 4,13 | ||||
| 2025-07-25 | 13F | Means Investment Co., Inc. | 0 | -100,00 | 0 | -100,00 | ||||
| 2025-07-16 | 13F | ORG Partners LLC | 754 | -19,79 | 52 | -12,07 | ||||
| 2025-08-14 | 13F | City National Bank Of Florida /msd | 171.088 | 20,59 | 11.596 | 30,70 | ||||
| 2025-08-12 | 13F | Insigneo Advisory Services, Llc | 0 | -100,00 | 0 | |||||
| 2025-08-14 | 13F/A | Rockefeller Capital Management L.P. | 64.973 | -12,20 | 4.404 | -4,86 | ||||
| 2025-08-11 | 13F | Principal Securities, Inc. | 25 | 0,00 | 2 | 0,00 | ||||
| 2025-08-14 | 13F | Kovitz Investment Group Partners, LLC | 236.044 | 8,93 | 15.999 | 18,07 | ||||
| 2025-08-14 | 13F | MidWestOne Financial Group, Inc. | 0 | -100,00 | 0 | |||||
| 2025-05-06 | 13F | Atria Investments Llc | 0 | -100,00 | 0 | |||||
| 2025-08-15 | 13F | Cornerstone Financial Group, LLC /NE/ | 16.173 | 0,30 | 1.096 | 3,40 | ||||
| 2025-08-15 | 13F | Tower Research Capital LLC (TRC) | 19.522 | 2,06 | 1.323 | 10,62 | ||||
| 2025-05-05 | 13F | Kestra Private Wealth Services, Llc | 0 | -100,00 | 0 | |||||
| 2025-08-08 | 13F | Avantax Advisory Services, Inc. | 16.259 | -40,87 | 1.102 | -35,89 | ||||
| 2025-07-25 | 13F | Allspring Global Investments Holdings, LLC | 1.269 | 27,79 | 87 | 38,71 | ||||
| 2025-07-22 | 13F/A | Red Mountain Financial, LLC | 4.154 | -1,70 | 282 | 6,44 | ||||
| 2025-08-08 | 13F | Advisory Resource Group | 0 | -100,00 | 0 | |||||
| 2025-07-09 | 13F | Heritage Wealth Architects, Inc. | 13.192 | 298,19 | 894 | 331,88 | ||||
| 2025-08-07 | 13F | 1620 Investment Advisors, Inc. | 4.361 | 8,73 | 296 | 18,00 | ||||
| 2025-05-15 | 13F | Ancora Advisors, LLC | 0 | -100,00 | 0 | -100,00 | ||||
| 2025-05-15 | 13F | Glenmede Trust Co Na | 2.262.153 | 29,37 | 141.475 | 18,98 | ||||
| 2025-07-22 | 13F | Old National Bancorp /in/ | 8.977 | 608 | ||||||
| 2025-07-22 | 13F | USAdvisors Wealth Management, LLC | 11.442 | 0,31 | 1 | |||||
| 2025-08-12 | 13F | Sfmg, Llc | 3.997 | 12,50 | 271 | 21,62 | ||||
| 2025-08-13 | 13F | Cary Street Partners Financial Llc | 9.219 | -23,40 | 625 | -17,02 | ||||
| 2025-08-15 | 13F | First Heartland Consultants, Inc. | 2.983 | 202 | ||||||
| 2025-08-07 | 13F | CENTRAL TRUST Co | 621.081 | 13,99 | 42.097 | 23,54 | ||||
| 2025-08-11 | 13F | Citigroup Inc | 25.527 | -60,26 | 1.730 | -56,92 | ||||
| 2025-08-14 | 13F | Glenmede Investment Management, LP | 2.930.717 | 198.644 | ||||||
| 2025-07-14 | 13F | Park Avenue Securities Llc | 3.391 | 0 | ||||||
| 2025-07-29 | 13F | Private Trust Co Na | 330 | 8,55 | 22 | 15,79 | ||||
| 2025-08-04 | 13F | Integrity Alliance, Llc. | 3.284 | -27,92 | 223 | -21,83 | ||||
| 2025-08-04 | 13F | Pensionmark Financial Group, Llc | 339.153 | -1,40 | 22.988 | 6,86 | ||||
| 2025-08-07 | 13F | Resources Investment Advisors, LLC. | 78.834 | 0,56 | 5.343 | 9,00 | ||||
| 2025-08-12 | 13F | AlphaCore Capital LLC | 1.174 | 0,00 | 80 | 8,22 | ||||
| 2025-08-11 | 13F | Private Advisor Group, LLC | 10.772 | 48,83 | 730 | 61,50 | ||||
| 2025-07-30 | 13F | Whittier Trust Co | 11.811 | 17,45 | 800 | 27,39 | ||||
| 2025-07-30 | 13F | Whittier Trust Co Of Nevada Inc | 574 | 0,00 | 39 | 8,57 | ||||
| 2025-08-08 | 13F | Firestone Capital Management | 4.000 | 0,00 | 271 | 8,40 | ||||
| 2025-08-14 | 13F | RMB Capital Management, LLC | 51.384 | 92,46 | 3.483 | 108,63 | ||||
| 2025-08-12 | 13F | Sierra Summit Advisors Llc | 8.520 | 2,18 | 577 | 10,75 | ||||
| 2025-07-11 | 13F | CMH Wealth Management LLC | 127.187 | -50,78 | 8.621 | -46,66 | ||||
| 2025-08-12 | 13F | Global Retirement Partners, LLC | 73 | 1,39 | 5 | 0,00 | ||||
| 2025-08-14 | 13F | Bank Of America Corp /de/ | 816.499 | 1,34 | 55.342 | 9,83 | ||||
| 2025-07-24 | 13F | KC Investment Advisors, LLC | 0 | -100,00 | 0 | |||||
| 2025-08-13 | 13F | Cresset Asset Management, LLC | 603.824 | -12,95 | 40.927 | -5,65 | ||||
| 2025-08-15 | 13F | Equitable Holdings, Inc. | 3.571 | 0,68 | 242 | 9,50 | ||||
| 2025-08-13 | 13F | Jones Financial Companies Lllp | 897 | 128,24 | 61 | 150,00 | ||||
| 2025-07-29 | 13F | Regions Financial Corp | 2.981 | 202 | ||||||
| 2025-08-11 | 13F | Brown Brothers Harriman & Co | 7.491 | 0,00 | 508 | 8,33 | ||||
| 2025-04-29 | 13F | Palisade Capital Management Llc/nj | 0 | -100,00 | 0 | |||||
| 2025-08-13 | 13F | First National Advisers, LLC | 3.043 | 206 | ||||||
| 2025-08-12 | 13F | Jpmorgan Chase & Co | 19.926 | -54,11 | 1.351 | -50,28 | ||||
| 2025-07-18 | 13F | Truist Financial Corp | 185.494 | -42,20 | 12.573 | -37,36 | ||||
| 2025-08-06 | 13F | Vestmark Advisory Solutions, Inc. | 338.643 | -4,56 | 22.953 | 3,44 | ||||
| 2025-08-12 | 13F | Coldstream Capital Management Inc | 970.694 | -19,70 | 65.794 | -12,97 |