Grundlæggende statistik
| Institutionelle ejere | 101 total, 101 long only, 0 short only, 0 long/short - change of 8,60% MRQ |
| Gennemsnitlig porteføljeallokering | 1.0283 % - change of 5,69% MRQ |
| Institutionelle aktier (lange) | 53.095.812 (ex 13D/G) - change of 23,93MM shares 82,03% MRQ |
| Institutionel værdi (lang) | $ 2.925.306 USD ($1000) |
Institutionelt ejerskab og aktionærer
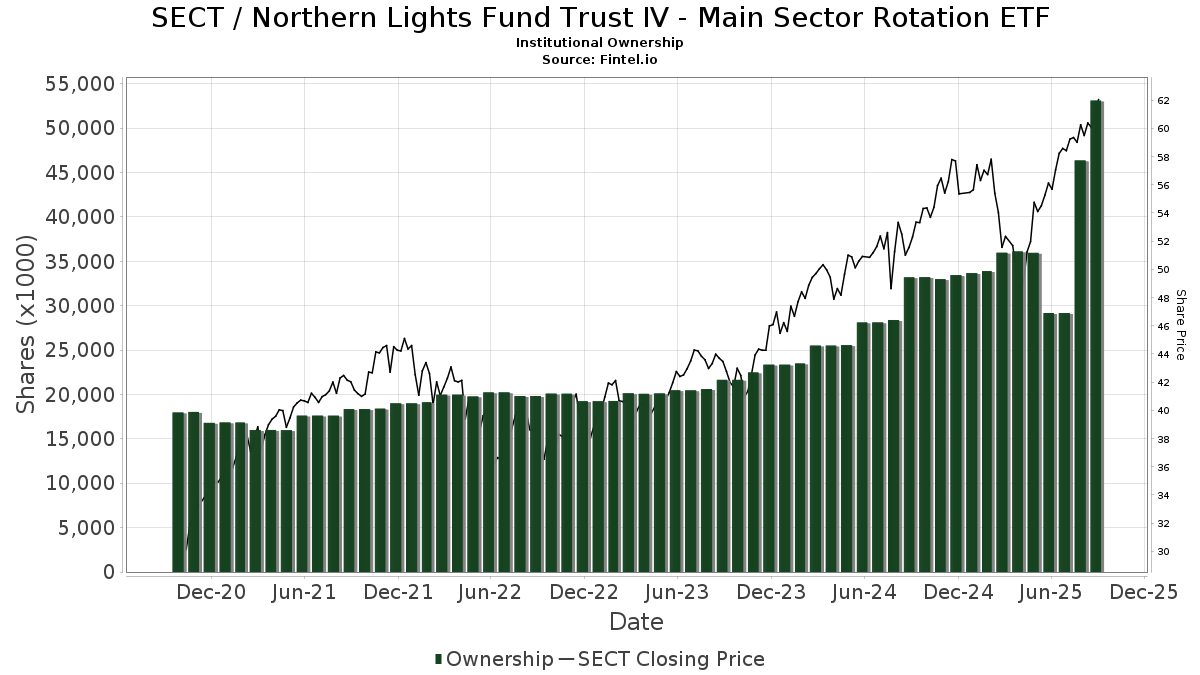
Northern Lights Fund Trust IV - Main Sector Rotation ETF (US:SECT) har 101 institutionelle ejere og aktionærer, der har indsendt 13D/G- eller 13F-formularer til Securities Exchange Commission (SEC). Disse institutioner har i alt 53,095,812 aktier. Største aktionærer omfatter Orion Portfolio Solutions, LLC, Brinker Capital Investments, LLC, Advisor Group Holdings, Inc., LPL Financial LLC, Envestnet Asset Management Inc, Potomac Fund Management Inc /adv, Integrated Wealth Concepts LLC, Change Path, LLC, GeoWealth Management, LLC, and Madrona Financial Services, LLC .
Northern Lights Fund Trust IV - Main Sector Rotation ETF (BATS:SECT) institutionel ejerskabsstruktur viser aktuelle positioner i virksomheden efter institutioner og fonde, samt seneste ændringer i positionsstørrelse. Større aktionærer kan omfatte individuelle investorer, investeringsforeninger, hedgefonde eller institutioner. Skema 13D angiver, at investoren besidder (eller besidder) mere end 5 % af virksomheden og har til hensigt (eller har til hensigt at) aktivt at forfølge en ændring i forretningsstrategi. Skema 13G indikerer en passiv investering på over 5%.
The share price as of September 12, 2025 is 61,75 / share. Previously, on September 13, 2024, the share price was 52,47 / share. This represents an increase of 17,69% over that period.
Fondens stemningsscore
Fund Sentiment Score (fka Ownership Accumulation Score) finder de aktier, der bliver mest købt af fonde. Det er resultatet af en sofistikeret, multi-faktor kvantitativ model, der identificerer virksomheder med de højeste niveauer af institutionel akkumulering. Scoringsmodellen bruger en kombination af den samlede stigning i oplyste ejere, ændringerne i porteføljeallokeringer i disse ejere og andre målinger. Tallet går fra 0 til 100, hvor højere tal indikerer et højere niveau af akkumulering for sine jævnaldrende, og 50 er gennemsnittet.
Opdateringsfrekvens: Dagligt
Se Ownership Explorer, som giver en liste over højest rangerende virksomheder.
Institutionel Put/Call-forhold
Ud over at indberette standardaktie- og gældsudstedelser skal institutter med mere end 100 mill. aktiver under forvaltning også oplyse deres put- og call-optionsbeholdninger. Da salgsoptioner generelt indikerer negativ stemning, og købsoptioner indikerer positiv stemning, kan vi få en fornemmelse af den overordnede institutionelle stemning ved at plotte forholdet mellem put og kald. Diagrammet til højre viser det historiske put/call-forhold for dette instrument.
Brug af Put/Call Ratio som en indikator for investorernes stemning overvinder en af de vigtigste mangler ved at bruge totalt institutionelt ejerskab, som er, at en betydelig mængde af aktiver under forvaltning investeres passivt for at spore indekser. Passivt forvaltede fonde køber typisk ikke optioner, så indikatoren for put/call-forholdet følger mere nøje følelsen af aktivt forvaltede fonde.
13F og NPORT arkivering
Detaljer om 13F-arkivering er gratis. Detaljer om NP-ansøgninger kræver et premium-medlemskab. Grønne rækker angiver nye positioner. Røde rækker angiver lukkede positioner. Klik på linket ikon for at se den fulde transaktionshistorik.
Opgrader
for at låse premium-data op og eksportere til Excel ![]() .
.
| Fil dato | Kilde | Investor | Type | Gennemsnitlig pris (Øst) |
Aktier | Δ Aktier (%) |
Rapporteret Værdi ($1000) |
Δ Værdi (%) |
Port Alloc (%) |
|
|---|---|---|---|---|---|---|---|---|---|---|
| 2025-08-12 | 13F | Coldstream Capital Management Inc | 3.840 | 44,47 | 223 | 64,44 | ||||
| 2025-08-13 | 13F | Copley Financial Group, Inc. | 301.629 | -12,14 | 17.516 | -0,08 | ||||
| 2025-08-07 | 13F | Encompass More Asset Management | 223.230 | -5,42 | 12.963 | 7,56 | ||||
| 2025-07-21 | 13F | Triad Wealth Partners, LLC | 26.460 | 1.537 | ||||||
| 2025-08-18 | 13F | Geneos Wealth Management Inc. | 88.809 | 60,37 | 5.157 | 82,42 | ||||
| 2025-07-25 | 13F | Cwm, Llc | 102.998 | -3,29 | 6 | 0,00 | ||||
| 2025-08-20 | 13F/A | Coppell Advisory Solutions LLC | 10.523 | 607 | ||||||
| 2025-08-11 | 13F | Private Advisor Group, LLC | 11.472 | 21,01 | 666 | 37,60 | ||||
| 2025-08-14 | 13F | Aqr Capital Management Llc | 5.844 | 339 | ||||||
| 2025-08-12 | 13F | Global Retirement Partners, LLC | 980 | 5,15 | 57 | 9,80 | ||||
| 2025-07-28 | 13F | WealthPLAN Partners, LLC | 320.140 | 2,27 | 18.591 | 16,31 | ||||
| 2025-08-14 | 13F | Integrated Wealth Concepts LLC | 655.583 | -29,44 | 38.070 | -19,75 | ||||
| 2025-08-01 | 13F | Envestnet Asset Management Inc | 1.094.863 | 16,90 | 63.579 | 32,94 | ||||
| 2025-05-28 | 13F | GK Wealth Management LLC | 0 | -100,00 | 0 | |||||
| 2025-08-13 | 13F | Gibbs Wealth Management | 28.471 | 1.653 | ||||||
| 2025-07-15 | 13F | World Equity Group, Inc. | 38.325 | -11,48 | 2.226 | 0,68 | ||||
| 2025-08-08 | 13F | Cetera Investment Advisers | 157.823 | 21,00 | 9.165 | 37,60 | ||||
| 2025-04-14 | 13F | Toth Financial Advisory Corp | 0 | -100,00 | 0 | |||||
| 2025-08-01 | 13F | Brookwood Investment Group LLC | 10.103 | -2,67 | 587 | 10,78 | ||||
| 2025-07-09 | 13F | Fiduciary Alliance LLC | 36.519 | -28,62 | 2.121 | -18,84 | ||||
| 2025-07-31 | 13F | Cambridge Investment Research Advisors, Inc. | 64.475 | -5,33 | 4 | 0,00 | ||||
| 2025-07-25 | 13F | Envestnet Portfolio Solutions, Inc. | 192.624 | -60,73 | 11.186 | -55,34 | ||||
| 2025-08-12 | 13F | Change Path, LLC | 569.987 | 1,77 | 33.099 | 15,75 | ||||
| 2025-07-18 | 13F | PFG Investments, LLC | 13.462 | 0,00 | 782 | 13,68 | ||||
| 2025-08-12 | 13F | LPL Financial LLC | 2.958.356 | 50,16 | 171.792 | 70,77 | ||||
| 2025-08-12 | 13F | CIBC Private Wealth Group, LLC | 10.427 | -2,84 | 605 | 24,74 | ||||
| 2025-08-14 | 13F | Wells Fargo & Company/mn | 7.835 | -5,77 | 455 | 7,08 | ||||
| 2025-08-11 | 13F | Synergy Investment Management, LLC | 44.138 | 1,23 | 2.563 | 6,97 | ||||
| 2025-08-15 | 13F/A | Florida Financial Advisors, Llc | 31.227 | -14,09 | 1.813 | -2,26 | ||||
| 2025-08-07 | 13F | Allworth Financial LP | 8.092 | 0,00 | 470 | 15,23 | ||||
| 2025-08-07 | 13F | Meeder Advisory Services, Inc. | 6.920 | -25,97 | 402 | -15,93 | ||||
| 2025-05-15 | 13F | Creative Planning | 0 | -100,00 | 0 | |||||
| 2025-04-23 | 13F | Crewe Advisors LLC | 0 | -100,00 | 0 | |||||
| 2025-07-23 | 13F | Defined Financial Planning LLC | 116.273 | 7,55 | 6.773 | 22,35 | ||||
| 2025-08-13 | 13F | Townsquare Capital Llc | 4.125 | -99,13 | 240 | -99,01 | ||||
| 2025-07-28 | 13F | Mutual Advisors, LLC | 230.000 | 0,89 | 13.664 | 18,13 | ||||
| 2025-07-29 | 13F | Koshinski Asset Management, Inc. | 20.094 | 19,72 | 1.167 | 36,21 | ||||
| 2025-08-12 | 13F | Main Management LLC | 387.494 | -0,83 | 23 | 15,79 | ||||
| 2025-07-10 | 13F | Signal Advisors Wealth, LLC | 3.877 | 225 | ||||||
| 2025-07-10 | 13F | Sovran Advisors, LLC | 6.139 | -6,66 | 357 | 13,33 | ||||
| 2025-07-16 | 13F | Independent Wealth Network Inc. | 20.313 | -2,12 | 1.180 | 11,33 | ||||
| 2025-08-18 | 13F | Tactive Advisors, LLC | 48.566 | 2.820 | ||||||
| 2025-07-07 | 13F | Discipline Wealth Solutions, LLC | 32.845 | -1,95 | 1.907 | 11,52 | ||||
| 2025-08-04 | 13F | Buck Wealth Strategies, LLC | 5.437 | 316 | ||||||
| 2025-07-09 | 13F | VisionPoint Advisory Group, LLC | 20.809 | 65,97 | 1.208 | 88,75 | ||||
| 2025-08-06 | 13F | Commonwealth Equity Services, Llc | 25.852 | -16,35 | 2 | 0,00 | ||||
| 2025-08-19 | 13F | Advisory Services Network, LLC | 10.924 | -4,50 | 643 | 9,93 | ||||
| 2025-04-23 | 13F | Mascagni Wealth Management, Inc. | 0 | -100,00 | 0 | -100,00 | ||||
| 2025-08-19 | 13F | Anchor Investment Management, LLC | 4.257 | 0,00 | 247 | 13,82 | ||||
| 2025-03-18 | 13F/A | Bank Of America Corp /de/ | 0 | -100,00 | 0 | |||||
| 2025-05-15 | 13F | GWM Advisors LLC | 0 | -100,00 | 0 | -100,00 | ||||
| 2025-08-07 | 13F | Nwam Llc | 0 | -100,00 | 0 | |||||
| 2025-08-04 | 13F | Barnes Dennig Private Wealth Management LLC | 4.041 | 0,00 | 235 | 13,59 | ||||
| 2025-08-12 | 13F | Nemes Rush Group LLC | 2.633 | 0,00 | 153 | 13,43 | ||||
| 2025-08-14 | 13F | Royal Bank Of Canada | 985 | 0,00 | 57 | 14,00 | ||||
| 2025-08-14 | 13F | Citadel Advisors Llc | 31.964 | 299,05 | 1.856 | 354,90 | ||||
| 2025-08-12 | 13F | Steward Partners Investment Advisory, Llc | 2.827 | 0,00 | 164 | 13,89 | ||||
| 2025-08-13 | 13F | Cerity Partners LLC | 3.949 | 0,00 | 229 | 13,93 | ||||
| 2025-08-01 | 13F | Gwn Securities Inc. | 82.106 | 16,23 | 4.770 | 27,65 | ||||
| 2025-08-15 | 13F | Morgan Stanley | 1.802 | 24,10 | 105 | 40,54 | ||||
| 2025-08-14 | 13F | Potomac Fund Management Inc /adv | 804.635 | 6,70 | 46.999 | 33,06 | ||||
| 2025-05-14 | 13F | Atomi Financial Group, Inc. | 0 | -100,00 | 0 | |||||
| 2025-07-15 | 13F | Armis Advisers, LLC | 10.658 | 621 | ||||||
| 2025-08-13 | 13F | EverSource Wealth Advisors, LLC | 3.202 | -0,34 | 186 | 12,80 | ||||
| 2025-08-14 | 13F | Diversify Advisory Services, LLC | 6.456 | 0,59 | 387 | 17,68 | ||||
| 2025-08-06 | 13F | Ethos Financial Group, LLC | 6.016 | 0,00 | 349 | 5,76 | ||||
| 2025-08-08 | 13F | Foundations Investment Advisors, LLC | 10.961 | -20,16 | 637 | -9,27 | ||||
| 2025-08-11 | 13F | Aptus Capital Advisors, LLC | 3.301 | -28,46 | 192 | -18,72 | ||||
| 2025-08-14 | 13F | Susquehanna International Group, Llp | 4.263 | -62,21 | 248 | -57,04 | ||||
| 2025-07-28 | 13F | Lunt Capital Management, Inc. | 41.995 | 0,68 | 2.439 | 14,51 | ||||
| 2025-08-12 | 13F | J.w. Cole Advisors, Inc. | 8.596 | 499 | ||||||
| 2025-07-18 | 13F | Cooper Financial Group | 0 | -100,00 | 0 | |||||
| 2025-08-12 | 13F | Bravias Capital Group, LLC | 28.731 | -12,04 | 1.668 | 0,06 | ||||
| 2025-07-18 | 13F | Madrona Financial Services, LLC | 425.082 | 1,48 | 24.684 | 15,41 | ||||
| 2025-07-31 | 13F | Richards, Merrill & Peterson, Inc. | 0 | -100,00 | 0 | |||||
| 2025-07-28 | 13F | Harbour Investments, Inc. | 4.855 | 0,00 | 282 | 13,77 | ||||
| 2025-08-04 | 13F | Spire Wealth Management | 127.851 | -34,56 | 7.190 | -27,93 | ||||
| 2025-08-14 | 13F | Jane Street Group, Llc | 4.467 | -62,74 | 259 | -57,68 | ||||
| 2025-08-12 | 13F | TCP Asset Management, LLC | 12.266 | 0,00 | 712 | 13,74 | ||||
| 2025-08-14 | 13F | Raymond James Financial Inc | 517 | 30 | ||||||
| 2025-04-22 | 13F | FSC Wealth Advisors, LLC | 0 | -100,00 | 0 | |||||
| 2025-08-12 | 13F | Jpmorgan Chase & Co | 181 | -52,12 | 11 | -47,37 | ||||
| 2025-05-15 | 13F/A | Orion Portfolio Solutions, LLC | 17.670.190 | -1,36 | 902.240 | -8,36 | ||||
| 2025-08-12 | 13F | Proequities, Inc. | 0 | 0 | ||||||
| 2025-07-30 | 13F | Advantage Trust Co | 39.586 | 2,38 | 2.299 | 16,41 | ||||
| 2025-08-11 | 13F | Brass Tax Wealth Management, Inc | 42.406 | 9,42 | 2.463 | 24,47 | ||||
| 2025-07-28 | 13F | RFG Advisory, LLC | 10.435 | -5,56 | 606 | 7,27 | ||||
| 2025-08-05 | 13F | Westside Investment Management, Inc. | 834 | 0,00 | 48 | 14,29 | ||||
| 2025-08-04 | 13F | Assetmark, Inc | 1.707 | -14,78 | 99 | -2,94 | ||||
| 2025-07-16 | 13F | Perigon Wealth Management, LLC | 4.218 | 245 | ||||||
| 2025-08-05 | 13F | Sigma Planning Corp | 111.266 | -0,32 | 6.461 | 13,37 | ||||
| 2025-08-15 | 13F | Kestra Advisory Services, LLC | 14.365 | 7,17 | 834 | 21,93 | ||||
| 2025-07-28 | 13F | Rosenberg Matthew Hamilton | 1.379 | -0,65 | 80 | 14,29 | ||||
| 2025-07-30 | 13F | Eqis Capital Management, Inc. | 48.478 | 3,47 | 2.815 | 17,68 | ||||
| 2025-08-14 | 13F | Old Mission Capital Llc | 17.575 | 97,74 | 1.021 | 125,17 | ||||
| 2025-08-04 | 13F | Arkadios Wealth Advisors | 3.777 | 219 | ||||||
| 2025-07-25 | 13F | Atria Wealth Solutions, Inc. | 108.779 | -75,66 | 6.326 | -72,28 | ||||
| 2025-07-11 | 13F | Farther Finance Advisors, LLC | 8.461 | -3,07 | 491 | 10,09 | ||||
| 2025-07-22 | 13F | Simplicity Wealth,LLC | 7.598 | 0,00 | 441 | 13,95 | ||||
| 2025-08-13 | 13F | Continuum Advisory, LLC | 0 | -100,00 | 0 | |||||
| 2025-08-13 | 13F | GeoWealth Management, LLC | 512.662 | 27,87 | 29.770 | 45,43 | ||||
| 2025-07-02 | 13F | McAlister, Sweet & Associates, Inc. | 0 | -100,00 | 0 | |||||
| 2025-08-12 | 13F | CFC Planning Co LLC | 39.489 | -1,85 | 2.293 | 11,64 | ||||
| 2025-08-13 | 13F | Natixis Advisors, L.p. | 13.380 | -5,15 | 1 | |||||
| 2025-08-06 | 13F | AE Wealth Management LLC | 5.552 | -17,26 | 322 | -5,85 | ||||
| 2025-08-13 | 13F | Echo45 Advisors LLC | 69.990 | -0,37 | 4.064 | 13,30 | ||||
| 2025-08-12 | 13F | Financial Advocates Investment Management | 8.557 | -13,83 | 497 | -2,17 | ||||
| 2025-07-16 | 13F | Signaturefd, Llc | 8.511 | 494 | ||||||
| 2025-08-14 | 13F | Tripletail Wealth Management, LLC | 18.510 | 1.098 | ||||||
| 2025-08-13 | 13F | Northwestern Mutual Wealth Management Co | 0 | -100,00 | 0 | |||||
| 2025-09-04 | 13F/A | Advisor Group Holdings, Inc. | 6.666.366 | 3.879,94 | 387.116 | 4.426,61 | ||||
| 2025-08-04 | 13F | Integrity Alliance, Llc. | 184.016 | -36,13 | 10.686 | -27,36 | ||||
| 2025-08-08 | 13F | Avantax Advisory Services, Inc. | 155.435 | 5,72 | 9.026 | 20,23 | ||||
| 2025-08-27 | 13F/A | Brinker Capital Investments, LLC | 17.533.925 | -0,77 | 1.018.195 | 12,85 | ||||
| 2025-07-14 | 13F | Painted Porch Advisors LLC | 0 | -100,00 | 0 | -100,00 | ||||
| 2025-08-04 | 13F | Atria Investments Llc | 165.743 | -0,23 | 9.625 | 13,46 | ||||
| 2025-07-24 | 13F | IFP Advisors, Inc | 991 | -69,45 | 58 | -65,45 | ||||
| 2025-07-11 | 13F | SILVER OAK SECURITIES, Inc | 25.131 | 14,92 | 1.459 | 30,85 |