Grundlæggende statistik
| Institutionelle ejere | 167 total, 167 long only, 0 short only, 0 long/short - change of 12,08% MRQ |
| Gennemsnitlig porteføljeallokering | 0.2541 % - change of -59,68% MRQ |
| Institutionelle aktier (lange) | 13.459.476 (ex 13D/G) - change of 3,78MM shares 39,02% MRQ |
| Institutionel værdi (lang) | $ 398.298 USD ($1000) |
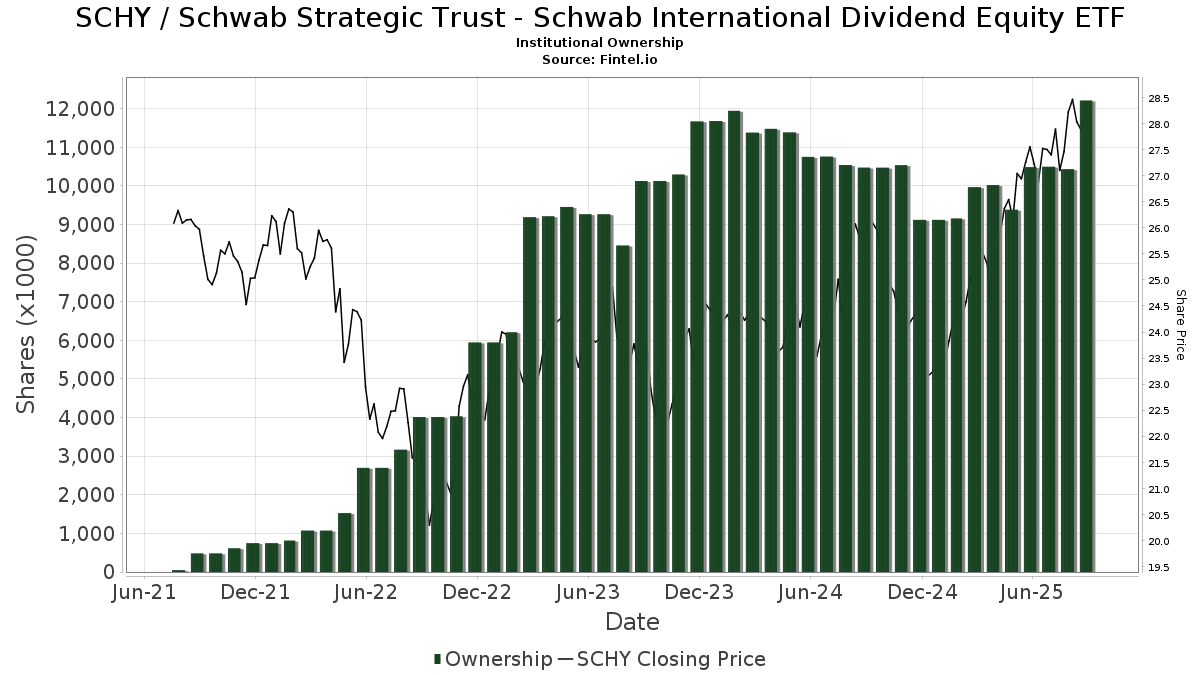
Institutionelt ejerskab og aktionærer
Schwab Strategic Trust - Schwab International Dividend Equity ETF (US:SCHY) har 167 institutionelle ejere og aktionærer, der har indsendt 13D/G- eller 13F-formularer til Securities Exchange Commission (SEC). Disse institutioner har i alt 13,459,476 aktier. Største aktionærer omfatter Cresset Asset Management, LLC, Hamel Associates, Inc., Summit Asset Management, LLC, Jane Street Group, Llc, Advisor Group Holdings, Inc., Bank Of America Corp /de/, HighTower Advisors, LLC, LPL Financial LLC, Modern Wealth Management, LLC, and Charles Schwab Trust Co .
Schwab Strategic Trust - Schwab International Dividend Equity ETF (ARCA:SCHY) institutionel ejerskabsstruktur viser aktuelle positioner i virksomheden efter institutioner og fonde, samt seneste ændringer i positionsstørrelse. Større aktionærer kan omfatte individuelle investorer, investeringsforeninger, hedgefonde eller institutioner. Skema 13D angiver, at investoren besidder (eller besidder) mere end 5 % af virksomheden og har til hensigt (eller har til hensigt at) aktivt at forfølge en ændring i forretningsstrategi. Skema 13G indikerer en passiv investering på over 5%.
The share price as of March 13, 2026 is 31,38 / share. Previously, on March 14, 2025, the share price was 25,42 / share. This represents an increase of 23,45% over that period.
Fondens stemningsscore
Fund Sentiment Score (fka Ownership Accumulation Score) finder de aktier, der bliver mest købt af fonde. Det er resultatet af en sofistikeret, multi-faktor kvantitativ model, der identificerer virksomheder med de højeste niveauer af institutionel akkumulering. Scoringsmodellen bruger en kombination af den samlede stigning i oplyste ejere, ændringerne i porteføljeallokeringer i disse ejere og andre målinger. Tallet går fra 0 til 100, hvor højere tal indikerer et højere niveau af akkumulering for sine jævnaldrende, og 50 er gennemsnittet.
Opdateringsfrekvens: Dagligt
Se Ownership Explorer, som giver en liste over højest rangerende virksomheder.
AI+ Ask Fintel’s AI assistant about Schwab Strategic Trust - Schwab International Dividend Equity ETF.
Select a question to share a public post with an AI-crafted answer.
Thinking of good questions…
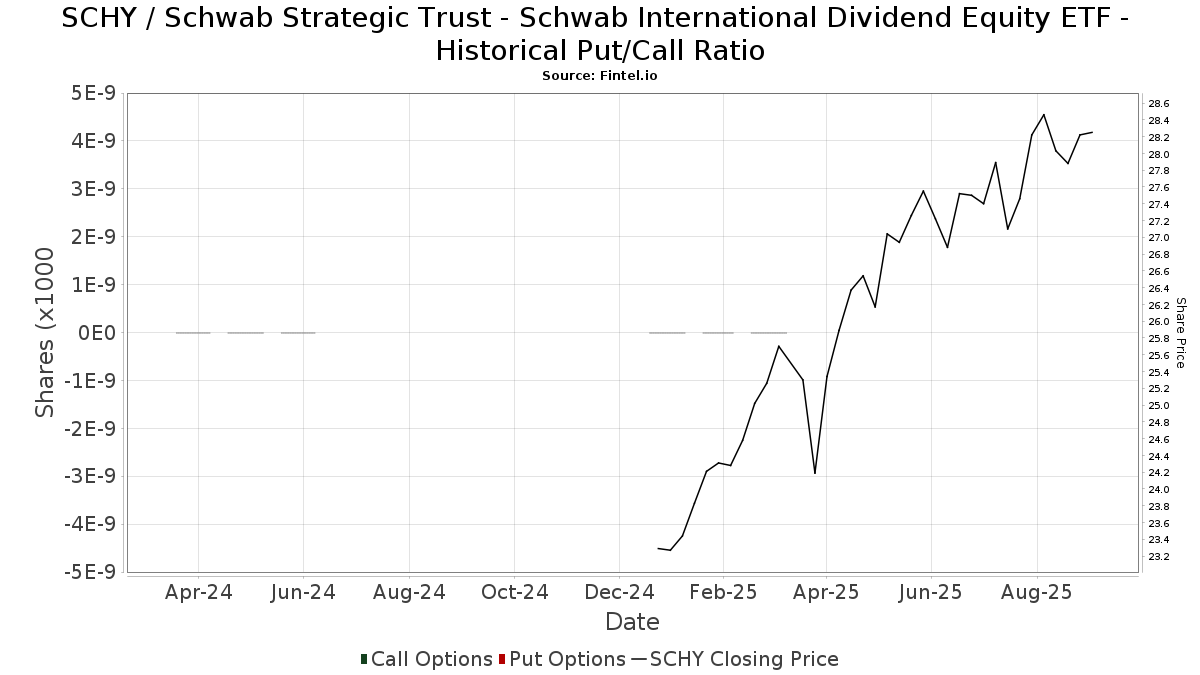
Institutionel Put/Call-forhold
Ud over at indberette standardaktie- og gældsudstedelser skal institutter med mere end 100 mill. aktiver under forvaltning også oplyse deres put- og call-optionsbeholdninger. Da salgsoptioner generelt indikerer negativ stemning, og købsoptioner indikerer positiv stemning, kan vi få en fornemmelse af den overordnede institutionelle stemning ved at plotte forholdet mellem put og kald. Diagrammet til højre viser det historiske put/call-forhold for dette instrument.
Brug af Put/Call Ratio som en indikator for investorernes stemning overvinder en af de vigtigste mangler ved at bruge totalt institutionelt ejerskab, som er, at en betydelig mængde af aktiver under forvaltning investeres passivt for at spore indekser. Passivt forvaltede fonde køber typisk ikke optioner, så indikatoren for put/call-forholdet følger mere nøje følelsen af aktivt forvaltede fonde.
13F og NPORT arkivering
Detaljer om 13F-arkivering er gratis. Detaljer om NP-ansøgninger kræver et premium-medlemskab. Grønne rækker angiver nye positioner. Røde rækker angiver lukkede positioner. Klik på linket ikon for at se den fulde transaktionshistorik.
Opgrader
for at låse premium-data op og eksportere til Excel ![]() .
.
| Fil dato | Kilde | Investor | Type | Gennemsnitlig pris (Øst) |
Aktier | Δ Aktier (%) |
Rapporteret Værdi ($1000) |
Δ Værdi (%) |
Port Alloc (%) |
|
|---|---|---|---|---|---|---|---|---|---|---|
| 2026-01-26 | 13F | Asset Dedication, LLC | 3 | 0,00 | 0 | |||||
| 2026-02-17 | 13F | Raymond James Financial Inc | 23.365 | 2,14 | 697 | 8,92 | ||||
| 2026-01-20 | 13F | Joule Financial, LLC | 10.032 | 2,09 | 299 | 9,12 | ||||
| 2026-02-06 | 13F | Global Retirement Partners, LLC | 415 | 0,97 | 12 | 9,09 | ||||
| 2026-02-13 | 13F | Smartleaf Asset Management LLC | 4.953 | -0,84 | 148 | 6,47 | ||||
| 2026-02-12 | 13F | Wealthspire Advisors, LLC | 0 | -100,00 | 0 | -100,00 | ||||
| 2026-02-18 | 13F | GWM Advisors LLC | 30.521 | 3,75 | 910 | 10,84 | ||||
| 2026-01-21 | 13F | Carolina Wealth Advisors, LLC | 93.128 | 1,86 | 2.777 | 8,73 | ||||
| 2026-02-26 | 13F | Anchor Investment Management, LLC | 2.854 | 12,36 | 85 | 21,43 | ||||
| 2026-01-14 | 13F | Embree Financial Group | 46.405 | -2,17 | 1.384 | 4,38 | ||||
| 2026-01-29 | 13F | Comerica Bank | 5.957 | 873,37 | 178 | 941,18 | ||||
| 2026-03-05 | 13F | Mengis Capital Management, Inc. | 18.130 | 17,35 | 541 | 25,29 | ||||
| 2025-11-12 | 13F | Ameriflex Group, Inc. | 0 | -100,00 | 0 | |||||
| 2026-01-22 | 13F | Red Tortoise LLC | 5.779 | 1,08 | 172 | 8,18 | ||||
| 2026-02-12 | 13F | Resurgent Financial Advisors LLC | 15.952 | 39,81 | 476 | 49,37 | ||||
| 2026-01-30 | 13F | Exencial Wealth Advisors, Llc | 73.789 | -5,69 | 2.200 | 0,64 | ||||
| 2026-02-10 | 13F | Envestnet Asset Management Inc | 20.420 | 23,03 | 609 | 31,32 | ||||
| 2026-02-12 | 13F | Hohimer Wealth Management, Llc | 9.739 | 290 | ||||||
| 2026-02-05 | 13F | AlphaCore Capital LLC | 102 | -48,74 | 3 | -40,00 | ||||
| 2026-01-22 | 13F | FSC Wealth Advisors, LLC | 0 | -100,00 | 0 | |||||
| 2026-01-15 | 13F | Hara Capital LLC | 4.040 | 0,00 | 120 | 7,14 | ||||
| 2025-11-12 | 13F | Accredited Wealth Management, LLC | 9.139 | 95,61 | 129 | 0,79 | ||||
| 2026-02-10 | 13F | Bruce G. Allen Investments, LLC | 11.126 | -10,36 | 332 | -4,34 | ||||
| 2026-01-20 | 13F | AdvisorNet Financial, Inc | 2.279 | 19,38 | 68 | 26,42 | ||||
| 2026-01-21 | 13F | Capital Investment Advisory Services, LLC | 200 | 0,00 | 6 | 0,00 | ||||
| 2025-10-14 | 13F | Cranbrook Wealth Management, LLC | 0 | -100,00 | 0 | -100,00 | ||||
| 2026-02-02 | 13F | Vawter Financial, Ltd. | 20.374 | 0,00 | 608 | 6,68 | ||||
| 2026-02-02 | 13F | CX Institutional | 0 | -100,00 | 0 | |||||
| 2026-02-05 | 13F | Cambridge Investment Research Advisors, Inc. | 74.195 | 0,80 | 2 | 0,00 | ||||
| 2026-02-13 | 13F | LGT Financial Advisors LLC | 6.323 | -0,16 | 189 | 6,82 | ||||
| 2026-02-17 | 13F | Cetera Investment Advisers | 32.821 | 8,30 | 979 | 15,60 | ||||
| 2026-02-13 | 13F | Stifel Financial Corp | 127.498 | -6,84 | 3.802 | -0,58 | ||||
| 2026-02-13 | 13F | Morgan Stanley | 35.490 | 40,68 | 1.058 | 50,28 | ||||
| 2026-02-04 | 13F | Pensionmark Financial Group, Llc | 43.132 | 1.246 | ||||||
| 2026-01-12 | 13F | First Merchants Corp | 77.310 | -6,75 | 2.305 | -0,47 | ||||
| 2026-02-17 | 13F | Royal Bank Of Canada | 78.889 | 6,21 | 2.353 | 13,34 | ||||
| 2026-02-13 | 13F | Mml Investors Services, Llc | 40.749 | 0,43 | 1.215 | 7,24 | ||||
| 2026-02-13 | 13F | Integrated Wealth Concepts LLC | 108.937 | -3,68 | 3.249 | 2,78 | ||||
| 2026-02-17 | 13F | Warren Averett Asset Management, LLC | 123.675 | 12,72 | 3.688 | 20,29 | ||||
| 2026-02-04 | 13F | CAP Partners, LLC | 0 | -100,00 | 0 | -100,00 | ||||
| 2026-01-30 | 13F | North Star Investment Management Corp. | 4.916 | 1,09 | 147 | 8,15 | ||||
| 2026-02-12 | 13F | Cowa, Llc | 18.269 | 3,18 | 545 | 10,12 | ||||
| 2025-10-03 | 13F | West Oak Capital, LLC | 0 | -100,00 | 0 | |||||
| 2026-02-11 | 13F | Cerity Partners LLC | 11.023 | 11,77 | 329 | 19,27 | ||||
| 2026-02-19 | 13F | Atomi Financial Group, Inc. | 7.308 | 1,08 | 218 | 7,43 | ||||
| 2026-01-20 | 13F | Signaturefd, Llc | 197 | 6 | ||||||
| 2026-02-02 | 13F | Hidden Cove Wealth Management, LLC | 30.913 | 48,34 | 922 | 58,25 | ||||
| 2026-02-17 | 13F | SageView Advisory Group, LLC | 605 | 18 | ||||||
| 2026-01-23 | 13F | Farther Finance Advisors, LLC | 61.167 | 19,09 | 1.824 | 27,04 | ||||
| 2026-02-17 | 13F | Cahill Financial Advisors Inc | 115.031 | 28,19 | 3.430 | 36,82 | ||||
| 2026-01-27 | 13F | Farrow Financial Inc. | 80.833 | 2.410 | ||||||
| 2026-02-13 | 13F | Kestra Advisory Services, LLC | 0 | -100,00 | 0 | |||||
| 2026-01-23 | 13F | Meridian Financial, LLC | 0 | -100,00 | 0 | |||||
| 2026-01-15 | 13F | Jaffetilchin Investment Partners, LLC | 12.595 | 1,08 | 376 | 7,76 | ||||
| 2026-01-22 | 13F | Fiduciary Alliance LLC | 149.509 | 62,24 | 4.458 | 73,19 | ||||
| 2026-02-17 | 13F | Fmr Llc | 5.287 | 24,72 | 158 | 33,05 | ||||
| 2026-01-22 | 13F | Financial Consulate, Inc | 250 | 0,00 | 7 | 16,67 | ||||
| 2026-02-13 | 13F | Aptus Capital Advisors, LLC | 11.497 | 1,08 | 343 | 7,89 | ||||
| 2026-02-23 | 13F | Wealth Preservation Advisors, LLC | 158 | 0,00 | 5 | 0,00 | ||||
| 2026-02-24 | 13F | Astoria Portfolio Advisors LLC. | 49.118 | 54,12 | 1.650 | 84,98 | ||||
| 2026-02-11 | 13F | LPL Financial LLC | 344.939 | 23,73 | 10.286 | 32,06 | ||||
| 2026-02-17 | 13F | Two Sigma Securities, Llc | 8.641 | -35,60 | 258 | -31,28 | ||||
| 2026-02-17 | 13F | Creative Planning | 45.348 | -0,92 | 1.352 | 5,79 | ||||
| 2026-02-05 | 13F | Allworth Financial LP | 1.751 | 8,49 | 52 | 15,56 | ||||
| 2026-02-12 | 13F | Bank Of Montreal /can/ | 7.246 | 0,00 | 216 | 6,93 | ||||
| 2026-02-13 | 13F | Pathstone Holdings, LLC | 103.110 | 0,00 | 3.075 | 6,74 | ||||
| 2026-02-11 | 13F | MCF Advisors LLC | 4.607 | 137 | ||||||
| 2026-02-17 | 13F | Cape Investment Advisory, Inc. | 49.022 | 1.462 | ||||||
| 2026-02-12 | 13F | Steward Partners Investment Advisory, Llc | 6.674 | 1,08 | 199 | 8,15 | ||||
| 2026-01-14 | 13F | Bell Bank | 9.903 | -0,36 | 295 | 6,50 | ||||
| 2026-01-26 | 13F | Berkeley, Inc | 34.166 | 0,22 | 1.019 | 6,93 | ||||
| 2026-02-13 | 13F | Magnolia Capital Advisors Llc | 190.278 | 62,84 | 5.674 | 73,84 | ||||
| 2026-02-02 | 13F | Souders Financial Advisors | 13.637 | -4,23 | 407 | 2,27 | ||||
| 2026-02-09 | 13F | Summit Asset Management, LLC | 603.929 | -4,91 | 18.009 | 1,49 | ||||
| 2026-01-26 | 13F | Red Mountain Financial, LLC | 134.387 | 1,83 | 4.007 | 8,68 | ||||
| 2026-02-17 | 13F | Advisor Group Holdings, Inc. | 584.471 | 7,10 | 17.429 | 14,06 | ||||
| 2026-01-30 | 13F | Kohmann Bosshard Financial Services, LLC | 64.448 | -5,08 | 1.922 | 1,27 | ||||
| 2026-01-27 | 13F | Lodestar Private Asset Management Llc | 28.170 | 0,36 | 840 | 7,14 | ||||
| 2026-02-13 | 13F | Planwiser Financial, Llc | 45.469 | 1.356 | ||||||
| 2026-02-17 | 13F | Redwood Park Advisors LLC | 5.773 | 0,00 | 172 | 6,83 | ||||
| 2026-02-17 | 13F | Asset Management Group, Inc. | 38.906 | 46,10 | 1.160 | 55,91 | ||||
| 2026-01-15 | 13F | LeConte Wealth Management, LLC | 206.996 | -11,65 | 6.173 | -5,70 | ||||
| 2026-01-30 | 13F | Caldwell Securities, Inc | 3.733 | 9,06 | 111 | 16,84 | ||||
| 2026-02-13 | 13F | Sei Investments Co | 10.890 | 325 | ||||||
| 2026-02-04 | 13F | Biltmore Family Office, LLC | 1.700 | 51 | ||||||
| 2026-02-17 | 13F | Qube Research & Technologies Ltd | 16.842 | 502 | ||||||
| 2026-01-29 | 13F | UBS Group AG | 7.000 | -20,45 | 209 | -15,10 | ||||
| 2026-02-02 | 13F | Oppenheimer Asset Management Inc. | 12.346 | 2,17 | 368 | 9,20 | ||||
| 2026-02-13 | 13F | SRS Capital Advisors, Inc. | 10 | 0 | ||||||
| 2026-02-05 | 13F | Tennessee Valley Asset Management Partners | 0 | -100,00 | 0 | |||||
| 2026-02-17 | 13F | Strive Financial Group ,LLC | 3 | 0 | ||||||
| 2026-02-11 | 13F | Tradition Wealth Management, LLC | 15.391 | -3,87 | 459 | 2,46 | ||||
| 2026-02-03 | 13F | Sequoia Financial Advisors, LLC | 141.890 | -22,86 | 4.231 | -17,65 | ||||
| 2026-02-13 | 13F | Parkside Financial Bank & Trust | 1.000 | 0,00 | 30 | 7,41 | ||||
| 2026-01-22 | 13F | Iron Financial, LLC | 285.376 | 1,49 | 8.510 | 8,31 | ||||
| 2026-02-12 | 13F | Jane Street Group, Llc | 600.000 | 956,62 | 17.892 | 1.028,12 | ||||
| 2026-01-22 | 13F | Westbourne Investments, Inc. | 10.550 | 331 | ||||||
| 2025-11-14 | 13F | Financial Network Wealth Management LLC | 0 | -100,00 | 0 | |||||
| 2026-02-03 | 13F | D.B. Root & Company, LLC | 19.035 | 18,99 | 568 | 27,13 | ||||
| 2026-02-27 | 13F | Strategic Investment Solutions, Inc. /IL | 2.373 | 95,63 | 71 | 112,12 | ||||
| 2026-01-14 | 13F | Wolfstich Capital, LLC | 71.217 | 0,00 | 2.124 | 6,74 | ||||
| 2026-01-21 | 13F | Landaas & Co /wi /adv | 22.981 | 158,85 | 685 | 176,21 | ||||
| 2026-02-09 | 13F | Collaborative Wealth Managment Inc. | 14.620 | 0,00 | 436 | 6,62 | ||||
| 2026-01-09 | 13F | Charles Schwab Trust Co | 291.994 | -0,77 | 8.707 | 5,91 | ||||
| 2026-02-11 | 13F | Janney Montgomery Scott LLC | 12.430 | 0,00 | 0 | |||||
| 2026-02-17 | 13F | Per Stirling Capital Management, LLC. | 22.436 | 0,50 | 669 | 7,38 | ||||
| 2026-02-02 | 13F | Fifth Third Bancorp | 629 | 0,00 | 19 | 5,88 | ||||
| 2026-02-18 | 13F | Crusonia Wealth Advisors LLC | 9.230 | 275 | ||||||
| 2026-02-13 | 13F | MAI Capital Management | 126.446 | -1,09 | 3.771 | 5,57 | ||||
| 2026-02-17 | 13F | Old Mission Capital Llc | 0 | -100,00 | 0 | |||||
| 2026-02-13 | 13F | Mariner, LLC | 55.370 | 8,26 | 1.651 | 15,54 | ||||
| 2026-02-11 | 13F | Jpmorgan Chase & Co | 5.429 | 54,10 | 162 | 64,29 | ||||
| 2026-01-23 | 13F | Asset Advisors Investment Management, LLC | 0 | -100,00 | 0 | |||||
| 2026-01-12 | 13F | DAVENPORT & Co LLC | 27.793 | 829 | ||||||
| 2026-02-17 | 13F | Wiley Bros.-aintree Capital, Llc | 7.150 | 213 | ||||||
| 2026-02-04 | 13F | D'Orazio & Associates, Inc. | 9.039 | 0,00 | 270 | 6,75 | ||||
| 2026-02-11 | 13F | Franklin Resources Inc | 1.635 | 49 | ||||||
| 2026-02-17 | 13F | Cresset Asset Management, LLC | 3.563.464 | 9,48 | 106.263 | 16,84 | ||||
| 2026-01-29 | 13F | Concord Wealth Partners | 0 | -100,00 | 0 | |||||
| 2026-02-10 | 13F | Acorn Wealth Advisors, LLC | 22.755 | 4,16 | 679 | 11,15 | ||||
| 2026-02-17 | 13F | Quadrature Capital Ltd | 7.866 | 235 | ||||||
| 2026-01-23 | 13F | Optima Capital Llc | 1.020 | 30 | ||||||
| 2026-02-19 | 13F | CI Private Wealth, LLC | 8.252 | 246 | ||||||
| 2026-01-07 | 13F | Orgel Wealth Management, LLC | 8.806 | 15,55 | 263 | 23,58 | ||||
| 2026-02-10 | 13F | Peapack Gladstone Financial Corp | 15.800 | 0,00 | 0 | |||||
| 2026-02-11 | 13F | Scholtz & Company, Llc | 12.157 | 363 | ||||||
| 2026-02-13 | 13F | Perspective Wealth Advisors Llc | 45.469 | 1.356 | ||||||
| 2026-02-17 | 13F | Modern Wealth Management, LLC | 323.633 | 38,40 | 9.651 | 47,71 | ||||
| 2026-02-11 | 13F | Parallel Advisors, LLC | 15.435 | 0,03 | 460 | 6,73 | ||||
| 2026-01-12 | 13F | CVA Family Office, LLC | 8.508 | 0,15 | 254 | 6,75 | ||||
| 2026-01-26 | 13F | AE Wealth Management LLC | 4.995 | 0,00 | 149 | 6,47 | ||||
| 2026-02-12 | 13F | Commonwealth Equity Services, Llc | 133.392 | 5,65 | 3.978 | 132.466,67 | ||||
| 2026-02-17 | 13F | Susquehanna International Group, Llp | 67.299 | 2.007 | ||||||
| 2026-01-08 | 13F | Wealth Enhancement Advisory Services, Llc | 90.320 | -1,30 | 2.714 | 6,06 | ||||
| 2026-01-12 | 13F | Myecfo, Llc | 25.646 | -0,73 | 765 | 5,96 | ||||
| 2026-02-02 | 13F | Robertson Stephens Wealth Management, LLC | 192.597 | 10,93 | 5.743 | 18,41 | ||||
| 2026-02-09 | 13F | Harbour Investments, Inc. | 343 | -9,02 | 10 | 0,00 | ||||
| 2026-02-17 | 13F | Advisory Services Network, LLC | 8.204 | 0,00 | 245 | 6,55 | ||||
| 2026-01-13 | 13F | CoreCap Advisors, LLC | 2.553 | 0,00 | 76 | 7,04 | ||||
| 2026-01-22 | 13F | Pinnacle Bancorp, Inc. | 3.875 | 115 | ||||||
| 2026-02-12 | 13F | Principal Securities, Inc. | 0 | -100,00 | 0 | |||||
| 2026-01-26 | 13F | Heritage Wealth Management, Inc. | 17.000 | 507 | ||||||
| 2026-02-02 | 13F | Avidian Wealth Solutions, LLC | 38.089 | 0,00 | 1.136 | 6,67 | ||||
| 2026-02-06 | 13F | HighTower Advisors, LLC | 409.414 | -4,60 | 12.209 | 1,82 | ||||
| 2025-11-12 | 13F | NewSquare Capital LLC | 0 | -100,00 | 0 | |||||
| 2026-02-06 | 13F | Cullen/frost Bankers, Inc. | 0 | -100,00 | 0 | |||||
| 2026-01-13 | 13F | Sharkey, Howes & Javer | 6.725 | 201 | ||||||
| 2025-11-14 | 13F | Gts Securities Llc | 0 | -100,00 | 0 | -100,00 | ||||
| 2026-01-13 | 13F | LongView Wealth Management | 180.761 | -3,16 | 5.459 | 4,66 | ||||
| 2026-02-02 | 13F | Breakwater Investment Management | 1.463 | 0,00 | 44 | 7,50 | ||||
| 2026-02-11 | 13F | Simplex Trading, Llc | 0 | -100,00 | 0 | |||||
| 2026-02-13 | 13F | C M Bidwell & Associates Ltd | 960 | 0,00 | 29 | 7,69 | ||||
| 2026-02-13 | 13F | Inspire Advisors, LLC | 28.610 | 12,56 | 853 | 20,14 | ||||
| 2026-02-03 | 13F | International Assets Investment Management, Llc | 1.802 | 54 | ||||||
| 2026-01-08 | 13F | Wedmont Private Capital | 24.967 | 0,05 | 749 | 7,32 | ||||
| 2026-02-17 | 13F | Opus Financial Solutions LLC | 135.488 | 4.040 | ||||||
| 2026-02-10 | 13F | Clarity Capital Advisors, LLC | 14.577 | -6,26 | 435 | 0,00 | ||||
| 2026-02-11 | 13F | Hamel Associates, Inc. | 707.159 | 21.087 | ||||||
| 2026-01-23 | 13F | Sage Investment Counsel LLC | 7.435 | 0,32 | 222 | 6,76 | ||||
| 2026-01-29 | 13F | ProVise Management Group, LLC | 31.401 | 0,00 | 936 | 6,73 | ||||
| 2026-02-06 | 13F | IFP Advisors, Inc | 100 | 0,00 | 3 | 0,00 | ||||
| 2026-02-09 | 13F | Texas Capital Bank Wealth Management Services Inc | 13.792 | 411 | ||||||
| 2026-02-04 | 13F | Wsfs Capital Management, Llc | 31.634 | 0,00 | 943 | 6,80 | ||||
| 2026-02-10 | 13F | Godfrey Financial Associates, Inc. | 204 | 6 | ||||||
| 2026-01-23 | 13F | DHJJ Financial Advisors, Ltd. | 55 | 0,00 | 2 | 0,00 | ||||
| 2026-01-07 | 13F | Noble Family Wealth, LLC | 100.625 | 2,73 | 3.001 | 9,65 | ||||
| 2026-01-12 | 13F | Spinnaker Investment Group, LLC | 40.389 | 0,00 | 1.204 | 6,74 | ||||
| 2026-02-13 | 13F | Wells Fargo & Company/mn | 4 | -99,92 | 0 | -100,00 | ||||
| 2026-01-20 | 13F | BXM Wealth LLC | 11.630 | 57,48 | 347 | 67,96 | ||||
| 2026-01-30 | 13F | Seek First Inc. | 45.874 | 0,95 | 1.368 | 7,72 | ||||
| 2026-02-10 | 13F | NewCorp Financial Services, Inc. | 8.267 | 247 | ||||||
| 2026-01-20 | 13F | C2P Capital Advisory Group, LLC d.b.a. Prosperity Capital Advisors | 15.693 | 468 | ||||||
| 2026-01-23 | 13F | Assetmark, Inc | 2.071 | 175,77 | 62 | 205,00 | ||||
| 2026-01-26 | 13F | Cwm, Llc | 964 | 0,00 | 0 | |||||
| 2026-01-27 | 13F | GHP Investment Advisors, Inc. | 1 | 0,00 | 0 | |||||
| 2026-02-23 | 13F | Monetary Solutions, Ltd | 5.072 | 151 | ||||||
| 2026-01-29 | 13F | Vanguard Group Inc | 43.724 | 0,04 | 1.304 | 6,72 | ||||
| 2025-11-14 | 13F | Guardian Wealth Advisors, Llc / Nc | 0 | -100,00 | 0 | |||||
| 2026-01-06 | 13F | OMC Financial Services LTD | 158.978 | 0,34 | 4.741 | 7,09 | ||||
| 2026-02-02 | 13F | Mutual Advisors, LLC | 149.335 | -5,83 | 4.453 | -1,57 | ||||
| 2026-02-02 | 13F | Farmers & Merchants Trust Co of Chambersburg PA | 822 | 0,00 | 0 | |||||
| 2026-02-10 | 13F/A | Northwestern Mutual Wealth Management Co | 117.108 | 16,88 | 3.492 | 24,76 | ||||
| 2026-01-28 | 13F | Chicago Partners Investment Group LLC | 13.265 | 409 | ||||||
| 2026-02-18 | 13F | Beacon Pointe Advisors, LLC | 9.354 | 23,81 | 279 | 31,75 | ||||
| 2026-02-04 | 13F | Clark Wealth Partners | 0 | -100,00 | 0 | |||||
| 2026-01-16 | 13F | Keystone Financial Group, Inc. | 20.981 | 0,38 | 626 | 7,20 | ||||
| 2026-02-17 | 13F | Bank Of America Corp /de/ | 410.651 | 11,93 | 12.246 | 19,46 | ||||
| 2026-02-10 | 13F | Goldman Sachs Group Inc | 35.837 | 0,03 | 1.069 | 6,69 |