Grundlæggende statistik
| Institutionelle aktier (lange) | 2.043.400 - 14,02% (ex 13D/G) - change of -0,03MM shares -1,29% MRQ |
| Institutionel værdi (lang) | $ 129.259 USD ($1000) |
Institutionelt ejerskab og aktionærer
Sabine Royalty Trust (US:SBR) har 142 institutionelle ejere og aktionærer, der har indsendt 13D/G- eller 13F-formularer til Securities Exchange Commission (SEC). Disse institutioner har i alt 2,043,400 aktier. Største aktionærer omfatter Beacon Pointe Advisors, LLC, King Luther Capital Management Corp, Fayez Sarofim & Co, Horizon Kinetics Asset Management Llc, Morgan Stanley, INFL - Horizon Kinetics Inflation Beneficiaries ETF, Howard Financial Services, Ltd., Two Sigma Investments, Lp, Americana Partners, LLC, and Chilton Capital Management Llc .
Sabine Royalty Trust (NYSE:SBR) institutionel ejerskabsstruktur viser aktuelle positioner i virksomheden efter institutioner og fonde, samt seneste ændringer i positionsstørrelse. Større aktionærer kan omfatte individuelle investorer, investeringsforeninger, hedgefonde eller institutioner. Skema 13D angiver, at investoren besidder (eller besidder) mere end 5 % af virksomheden og har til hensigt (eller har til hensigt at) aktivt at forfølge en ændring i forretningsstrategi. Skema 13G indikerer en passiv investering på over 5%.
The share price as of September 12, 2025 is 76,72 / share. Previously, on September 16, 2024, the share price was 60,38 / share. This represents an increase of 27,06% over that period.

Fondens stemningsscore
Fund Sentiment Score (fka Ownership Accumulation Score) finder de aktier, der bliver mest købt af fonde. Det er resultatet af en sofistikeret, multi-faktor kvantitativ model, der identificerer virksomheder med de højeste niveauer af institutionel akkumulering. Scoringsmodellen bruger en kombination af den samlede stigning i oplyste ejere, ændringerne i porteføljeallokeringer i disse ejere og andre målinger. Tallet går fra 0 til 100, hvor højere tal indikerer et højere niveau af akkumulering for sine jævnaldrende, og 50 er gennemsnittet.
Opdateringsfrekvens: Dagligt
Se Ownership Explorer, som giver en liste over højest rangerende virksomheder.
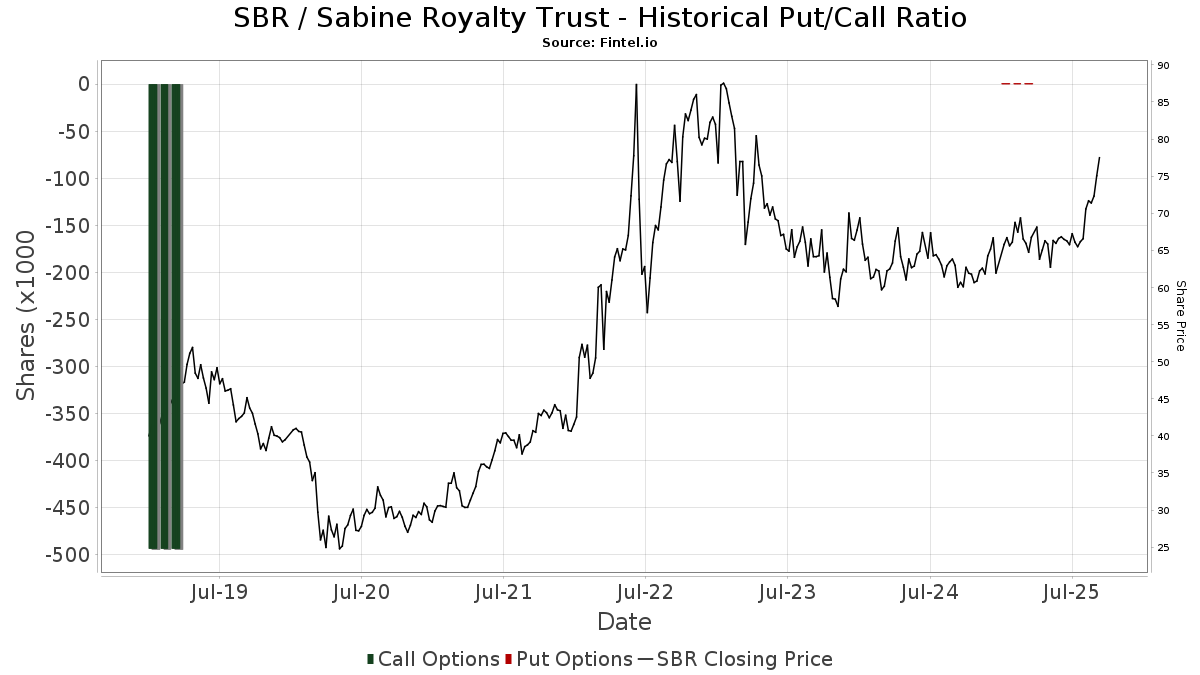
Institutionel Put/Call-forhold
Ud over at indberette standardaktie- og gældsudstedelser skal institutter med mere end 100 mill. aktiver under forvaltning også oplyse deres put- og call-optionsbeholdninger. Da salgsoptioner generelt indikerer negativ stemning, og købsoptioner indikerer positiv stemning, kan vi få en fornemmelse af den overordnede institutionelle stemning ved at plotte forholdet mellem put og kald. Diagrammet til højre viser det historiske put/call-forhold for dette instrument.
Brug af Put/Call Ratio som en indikator for investorernes stemning overvinder en af de vigtigste mangler ved at bruge totalt institutionelt ejerskab, som er, at en betydelig mængde af aktiver under forvaltning investeres passivt for at spore indekser. Passivt forvaltede fonde køber typisk ikke optioner, så indikatoren for put/call-forholdet følger mere nøje følelsen af aktivt forvaltede fonde.
13F og NPORT arkivering
Detaljer om 13F-arkivering er gratis. Detaljer om NP-ansøgninger kræver et premium-medlemskab. Grønne rækker angiver nye positioner. Røde rækker angiver lukkede positioner. Klik på linket ikon for at se den fulde transaktionshistorik.
Opgrader
for at låse premium-data op og eksportere til Excel ![]() .
.
| Fil dato | Kilde | Investor | Type | Gennemsnitlig pris (Øst) |
Aktier | Δ Aktier (%) |
Rapporteret Værdi ($1000) |
Δ Værdi (%) |
Port Alloc (%) |
|
|---|---|---|---|---|---|---|---|---|---|---|
| 2025-07-31 | 13F | Mcdaniel Terry & Co | 14.000 | 0,00 | 934 | |||||
| 2025-08-12 | 13F | XTX Topco Ltd | 0 | -100,00 | 0 | |||||
| 2025-08-14 | 13F | Fayez Sarofim & Co | 134.038 | -40,60 | 8.938 | -41,48 | ||||
| 2025-08-14 | 13F | Citadel Advisors Llc | 26.095 | 128,12 | 1.740 | 124,81 | ||||
| 2025-07-31 | 13F/A | Sendero Wealth Management, LLC | 12.927 | 0,00 | 862 | -1,60 | ||||
| 2025-07-23 | 13F | Citizens National Bank Trust Department | 1.000 | 0,00 | 67 | -1,49 | ||||
| 2025-05-06 | 13F | Venturi Wealth Management, LLC | 0 | -100,00 | 0 | |||||
| 2025-07-25 | 13F | Ackerman Capital Advisors, LLC | 3.417 | 0,00 | 227 | -1,30 | ||||
| 2025-08-15 | 13F | CI Private Wealth, LLC | 6.883 | 0,00 | 459 | -1,51 | ||||
| 2025-08-14 | 13F/A | Skopos Labs, Inc. | 54 | 14,89 | 4 | 0,00 | ||||
| 2025-08-21 | NP | LUSIX - Lazard US Systematic Small Cap Equity Portfolio Institutional Shares | 843 | -4,10 | 56 | -5,08 | ||||
| 2025-07-30 | 13F | Exencial Wealth Advisors, Llc | 10.357 | 0,00 | 688 | -1,43 | ||||
| 2025-04-29 | 13F | Envestnet Asset Management Inc | 0 | -100,00 | 0 | |||||
| 2025-08-15 | 13F | Morgan Stanley | 90.466 | 27,18 | 6.032 | 25,28 | ||||
| 2025-08-14 | 13F | Chilton Investment Co Llc | 9.067 | 0,00 | 605 | -1,47 | ||||
| 2025-08-19 | 13F | Advisory Services Network, LLC | 10.796 | 249,61 | 716 | 242,11 | ||||
| 2025-08-28 | NP | NVIR - Horizon Kinetics Energy and Remediation ETF | 493 | 0,00 | 33 | -3,03 | ||||
| 2025-08-13 | 13F | Russell Investments Group, Ltd. | 10 | 0,00 | 1 | |||||
| 2025-07-29 | 13F | Burford Brothers, Inc. | 10.142 | 1,42 | 674 | -0,15 | ||||
| 2025-07-10 | 13F | Clare Market Investments LLC | 27.643 | -0,54 | 1.843 | -2,02 | ||||
| 2025-08-08 | 13F | Creative Planning | 17.070 | -0,58 | 1.135 | -2,07 | ||||
| 2025-08-01 | 13F | Transcend Wealth Collective, Llc | 14.480 | 0,00 | 966 | -1,53 | ||||
| 2025-08-14 | 13F | Fmr Llc | 160 | -57,10 | 11 | -60,00 | ||||
| 2025-08-12 | 13F | BlackRock, Inc. | 50 | 0,00 | 3 | 0,00 | ||||
| 2025-07-29 | 13F | Oxbow Advisors, LLC | 4.091 | 0,00 | 272 | -1,45 | ||||
| 2025-07-23 | 13F | BankPlus Trust Department | 1.400 | 0,00 | 93 | -1,06 | ||||
| 2025-08-19 | 13F | State of Wyoming | 9.300 | 3,79 | 620 | 2,31 | ||||
| 2025-07-09 | 13F | Beacon Financial Group | 5.255 | 0,00 | 349 | -1,41 | ||||
| 2025-08-12 | 13F | BWM Planning, LLC | 21.552 | 0,00 | 1.437 | -1,44 | ||||
| 2025-07-25 | 13F | Atria Wealth Solutions, Inc. | 3.078 | 205 | ||||||
| 2025-07-29 | 13F | Private Trust Co Na | 6.800 | 0,00 | 453 | -1,52 | ||||
| 2025-07-31 | 13F | Cambridge Investment Research Advisors, Inc. | 3.929 | -5,94 | 0 | |||||
| 2025-08-13 | 13F | Cresset Asset Management, LLC | 13.005 | 867 | ||||||
| 2025-07-10 | 13F | Moody National Bank Trust Division | 35.185 | 2.346 | ||||||
| 2025-08-12 | 13F | Jpmorgan Chase & Co | 4.017 | -14,35 | 268 | -15,77 | ||||
| 2025-08-14 | 13F | Jane Street Group, Llc | 4.277 | -62,50 | 285 | -63,04 | ||||
| 2025-08-14 | 13F | Comerica Bank | 48 | 3 | ||||||
| 2025-04-08 | 13F | Lowe Wealth Advisors, LLC | 0 | -100,00 | 0 | |||||
| 2025-08-13 | 13F | SCS Capital Management LLC | 31.115 | 0,00 | 2.075 | -1,52 | ||||
| 2025-07-25 | 13F | Concurrent Investment Advisors, LLC | 25.355 | -10,80 | 1.686 | -12,15 | ||||
| 2025-08-11 | 13F | Citigroup Inc | 1.143 | -30,77 | 76 | -31,53 | ||||
| 2025-07-17 | 13F/A | Capital Investment Advisors, LLC | 12.653 | 1,55 | 841 | 0,12 | ||||
| 2025-08-15 | 13F | Kestra Advisory Services, LLC | 0 | -100,00 | 0 | |||||
| 2025-05-13 | 13F | FineMark National Bank & Trust | 0 | -100,00 | 0 | |||||
| 2025-08-08 | 13F | VeraBank, N.A. | 24.024 | 0,00 | 1.602 | -1,54 | ||||
| 2025-07-02 | 13F | Howard Financial Services, Ltd. | 67.814 | -12,42 | 4.506 | -13,73 | ||||
| 2025-08-14 | 13F | Bnp Paribas Arbitrage, Sa | 708 | 79,24 | 47 | 80,77 | ||||
| 2025-07-23 | 13F | Mraz, Amerine & Associates, Inc. | 24.525 | -1,01 | 1.630 | -1,09 | ||||
| 2025-04-22 | 13F | TrueMark Investments, LLC | 0 | -100,00 | 0 | |||||
| 2025-05-14 | 13F | Virtus ETF Advisers LLC | 0 | -100,00 | 0 | |||||
| 2025-08-14 | 13F | Ameriprise Financial Inc | 6.216 | -14,52 | 415 | -15,85 | ||||
| 2025-08-06 | 13F | Adviser Investments LLC | 9.197 | -1,76 | 613 | -3,16 | ||||
| 2025-08-14 | 13F | Kovitz Investment Group Partners, LLC | 7.032 | 0,00 | 467 | -1,48 | ||||
| 2025-08-28 | NP | SMLV - SPDR SSGA US Small Cap Low Volatility Index ETF This fund is a listed as child fund of State Street Corp and if that institution has disclosed ownership in this security, then these positions will not be double counted when calculating total shares and total value | 7.229 | -15,33 | 482 | -16,46 | ||||
| 2025-08-19 | 13F | Campbell Capital Management Inc | 0 | -100,00 | 0 | |||||
| 2025-08-12 | 13F | Steward Partners Investment Advisory, Llc | 200 | 0,00 | 13 | 0,00 | ||||
| 2025-08-14 | 13F | UBS Group AG | 14.037 | -22,20 | 936 | -23,42 | ||||
| 2025-07-16 | 13F | Essex Financial Services, Inc. | 9.186 | -2,43 | 613 | -3,92 | ||||
| 2025-08-14 | 13F | Raymond James Financial Inc | 16.032 | -1,20 | 1.069 | -2,64 | ||||
| 2025-07-23 | 13F | Tyche Wealth Partners LLC | 4.758 | 0,00 | 317 | -1,55 | ||||
| 2025-09-04 | 13F/A | Advisor Group Holdings, Inc. | 17.768 | 8,06 | 1.185 | 6,47 | ||||
| 2025-08-07 | 13F | Allworth Financial LP | 386 | -88,25 | 26 | -88,58 | ||||
| 2025-08-04 | 13F | Quaker Wealth Management, LLC | 1.000 | 66 | ||||||
| 2025-07-25 | 13F | M.e. Allison & Co., Inc. | 4.061 | 0,00 | 271 | -1,46 | ||||
| 2025-08-13 | 13F | Virtus Investment Advisers, Inc. | 2.593 | 7,24 | 173 | 5,52 | ||||
| 2025-08-11 | 13F | Rahlfs Capital, Llc | 11.985 | 1,48 | 798 | 0,00 | ||||
| 2025-08-07 | 13F | PFG Advisors | 14.846 | 0,34 | 987 | -1,20 | ||||
| 2025-07-31 | 13F | Buckingham Strategic Partners | 3.058 | 0,00 | 204 | -1,93 | ||||
| 2025-07-25 | 13F | Cwm, Llc | 237 | 1,28 | 0 | |||||
| 2025-08-04 | 13F | AMG National Trust Bank | 12.680 | 0,00 | 844 | -1,40 | ||||
| 2025-08-12 | 13F | Global Retirement Partners, LLC | 238 | 0,00 | 16 | 0,00 | ||||
| 2025-05-12 | 13F | Invesco Ltd. | 0 | -100,00 | 0 | -100,00 | ||||
| 2025-07-25 | 13F | Verdence Capital Advisors LLC | 10.500 | 0,00 | 700 | -1,41 | ||||
| 2025-08-14 | 13F | Bank Of America Corp /de/ | 28.496 | 11,88 | 1.900 | 10,21 | ||||
| 2025-05-15 | 13F | Mariner, LLC | 0 | -100,00 | 0 | |||||
| 2025-08-15 | 13F | Captrust Financial Advisors | 3.729 | 0,00 | 248 | -1,59 | ||||
| 2025-08-06 | 13F | Commonwealth Equity Services, Llc | 31.588 | 6,30 | 2 | 0,00 | ||||
| 2025-08-11 | 13F | Hexagon Capital Partners LLC | 0 | -100,00 | 0 | |||||
| 2025-08-12 | 13F | Pathstone Holdings, LLC | 3.617 | 0,00 | 241 | -1,23 | ||||
| 2025-08-12 | 13F | Manchester Capital Management LLC | 55 | 0,00 | 4 | 0,00 | ||||
| 2025-08-04 | 13F | Creekmur Asset Management LLC | 1 | 0,00 | 0 | |||||
| 2025-08-07 | 13F | King Luther Capital Management Corp | 143.555 | 0,00 | 9.572 | -1,49 | ||||
| 2025-07-15 | 13F | Significant Wealth Partners LLC | 4.739 | -9,02 | 315 | -10,54 | ||||
| 2025-08-14 | 13F | Two Sigma Investments, Lp | 56.130 | 31,67 | 3.743 | 29,71 | ||||
| 2025-08-12 | 13F | Holderness Investments Co | 6.000 | 0,00 | 399 | -1,49 | ||||
| 2025-08-13 | 13F | Marshall Wace, Llp | 23.172 | 1.545 | ||||||
| 2025-08-14 | 13F | Royal Bank Of Canada | 1.464 | 65,61 | 98 | 63,33 | ||||
| 2025-07-11 | 13F/A | Umb Bank N A/mo | 45 | 0,00 | 3 | 0,00 | ||||
| 2025-08-12 | 13F | Bokf, Na | 6.500 | 0,00 | 433 | -1,37 | ||||
| 2025-07-15 | 13F | Td Private Client Wealth Llc | 10 | 1 | ||||||
| 2025-07-24 | 13F | Robertson Stephens Wealth Management, LLC | 10.600 | 0,00 | 704 | -1,54 | ||||
| 2025-08-01 | 13F | Motco | 11.600 | 0,00 | 769 | -2,17 | ||||
| 2025-08-08 | 13F | Islay Capital Management, Llc | 3.000 | -25,00 | 199 | -26,02 | ||||
| 2025-08-12 | 13F | LPL Financial LLC | 22.923 | 4,03 | 1.528 | 2,48 | ||||
| 2025-07-14 | 13F | GAMMA Investing LLC | 0 | -100,00 | 0 | |||||
| 2025-08-11 | 13F | HighTower Advisors, LLC | 6.644 | -1,20 | 442 | -2,64 | ||||
| 2025-08-04 | 13F | Quaker Wealth Management, LLC | Put | 0 | -100,00 | 0 | -100,00 | |||
| 2025-08-11 | 13F | Principal Securities, Inc. | 17 | 1.600,00 | 1 | |||||
| 2025-08-28 | NP | RENN Fund, Inc. | 100 | 0,00 | 7 | 0,00 | ||||
| 2025-08-13 | 13F | Capital Analysts, Inc. | 27.425 | 16,23 | 2 | 0,00 | ||||
| 2025-08-14 | 13F | Hilltop Holdings Inc. | 6.176 | 1,25 | 412 | -0,24 | ||||
| 2025-08-06 | 13F | Decker Retirement Planning Inc. | 0 | 0 | ||||||
| 2025-08-14 | 13F | Susquehanna International Group, Llp | 24.164 | 48,08 | 1.611 | 45,92 | ||||
| 2025-08-14 | 13F | Wells Fargo & Company/mn | 16.710 | -19,71 | 1.114 | -20,88 | ||||
| 2025-07-24 | 13F | Ronald Blue Trust, Inc. | 17.009 | -41,03 | 1.134 | -41,91 | ||||
| 2025-07-28 | 13F | Harbour Investments, Inc. | 120 | 2,56 | 8 | 0,00 | ||||
| 2025-08-15 | 13F | Tower Research Capital LLC (TRC) | 37 | -94,37 | 2 | -95,45 | ||||
| 2025-04-28 | NP | BFOR - Barron's 400 ETF | 5.972 | 1,22 | 391 | 1,83 | ||||
| 2025-08-14 | 13F | State Street Corp | 7.229 | 4,18 | 482 | 2,77 | ||||
| 2025-07-23 | 13F | Prime Capital Investment Advisors, LLC | 3.000 | 0,00 | 200 | -1,48 | ||||
| 2025-08-07 | 13F | Americana Partners, LLC | 37.155 | 2.469 | ||||||
| 2025-06-25 | NP | VRAI - Virtus Real Asset Income ETF | 2.350 | -1,71 | 155 | -2,53 | ||||
| 2025-08-14 | 13F/A | Perritt Capital Management Inc | 2.579 | 0,00 | 171 | -1,16 | ||||
| 2025-07-15 | 13F | Fifth Third Bancorp | 355 | 24 | ||||||
| 2025-08-14 | 13F | Peapack Gladstone Financial Corp | 22.283 | 8,82 | 1 | 0,00 | ||||
| 2025-08-14 | 13F | GWM Advisors LLC | 540 | 0,00 | 36 | 0,00 | ||||
| 2025-08-05 | 13F | Huntington National Bank | 500 | -14,82 | 33 | -15,38 | ||||
| 2025-07-21 | 13F | Franklin Street Advisors Inc /nc | 10.081 | 0,00 | 1 | |||||
| 2025-08-14 | 13F | Qube Research & Technologies Ltd | 21.405 | -6,08 | 1.427 | -7,46 | ||||
| 2025-07-21 | 13F | Custos Family Office, LLC | 5.564 | 0,00 | 371 | -1,33 | ||||
| 2025-08-06 | 13F | Prospera Financial Services Inc | 31.059 | 4,94 | 2.071 | 3,39 | ||||
| 2025-07-31 | 13F | Fielder Capital Group LLC | 11.377 | 0,00 | 759 | -1,56 | ||||
| 2025-07-31 | 13F | Carnegie Capital Asset Management, LLC | 7.507 | 2,84 | 501 | 12,61 | ||||
| 2025-08-08 | 13F | Cetera Investment Advisers | 5.926 | 7,73 | 395 | 6,18 | ||||
| 2025-08-12 | 13F | Horizon Kinetics Asset Management Llc | 109.521 | -7,41 | 7.303 | -8,79 | ||||
| 2025-08-13 | 13F | Beacon Pointe Advisors, LLC | 195.894 | 1,26 | 13.017 | -0,25 | ||||
| 2025-08-13 | 13F | Brown Advisory Inc | 9.100 | -3,19 | 607 | -4,72 | ||||
| 2025-07-07 | 13F | Salem Investment Counselors Inc | 0 | -100,00 | 0 | |||||
| 2025-07-18 | 13F | PFG Investments, LLC | 3.898 | 260 | ||||||
| 2025-08-15 | 13F | Fairfield, Bush & Co. | 3.951 | -2,47 | 263 | -4,03 | ||||
| 2025-07-30 | 13F | Loring Wolcott & Coolidge Fiduciary Advisors Llp/ma | 1.437 | 0,00 | 96 | 0,00 | ||||
| 2025-04-01 | NP | PRFZ - Invesco FTSE RAFI US 1500 Small-Mid ETF This fund is a listed as child fund of Invesco Ltd. and if that institution has disclosed ownership in this security, then these positions will not be double counted when calculating total shares and total value | 8.283 | -0,10 | 548 | 8,51 | ||||
| 2025-07-17 | 13F | Sound Income Strategies, LLC | 50 | 0,00 | 3 | 0,00 | ||||
| 2025-07-11 | 13F | Farther Finance Advisors, LLC | 22 | 0,00 | 1 | 0,00 | ||||
| 2025-08-28 | NP | INFL - Horizon Kinetics Inflation Beneficiaries ETF | 85.201 | 0,00 | 5.681 | -1,49 | ||||
| 2025-04-30 | 13F | Alps Advisors Inc | 0 | -100,00 | 0 | |||||
| 2025-07-16 | 13F | American National Bank | 1.483 | 0,00 | 99 | -2,00 | ||||
| 2025-07-22 | 13F | Olistico Wealth, LLC | 427 | 0,00 | 28 | 0,00 | ||||
| 2025-07-10 | 13F | Wealth Enhancement Advisory Services, Llc | 3.570 | -9,98 | 237 | -11,24 | ||||
| 2025-08-14 | 13F | Mercer Global Advisors Inc /adv | 14.883 | 0,00 | 990 | -1,49 | ||||
| 2025-07-21 | 13F | Monticello Wealth Management, Llc | 5.908 | 0,00 | 393 | -1,50 | ||||
| 2025-08-14 | 13F | Two Sigma Advisers, Lp | 10.800 | 41,25 | 720 | 39,26 | ||||
| 2025-08-18 | 13F | Geneos Wealth Management Inc. | 5.257 | 11,21 | 351 | 10,06 | ||||
| 2025-08-14 | 13F | Summit Trail Advisors, Llc | 8.500 | 567 | ||||||
| 2025-08-04 | 13F | Assetmark, Inc | 13 | 1 | ||||||
| 2025-08-12 | 13F | Proequities, Inc. | 0 | 0 | ||||||
| 2025-08-14 | 13F | Stifel Financial Corp | 15.673 | 0,13 | 1.045 | -1,32 | ||||
| 2025-08-08 | 13F | Pnc Financial Services Group, Inc. | 3.324 | 0,00 | 222 | -1,78 | ||||
| 2025-08-14 | 13F | Lazard Asset Management Llc | 6.274 | 0,42 | 0 | |||||
| 2025-08-12 | 13F | Argent Trust Co | 4.977 | 0,00 | 332 | -1,49 | ||||
| 2025-08-06 | 13F | Moors & Cabot, Inc. | 18.542 | -1,59 | 1.236 | -3,06 | ||||
| 2025-07-16 | 13F | Signature Resources Capital Management, LLC | 600 | 0,00 | 40 | -2,50 | ||||
| 2025-08-14 | 13F | Sunbelt Securities, Inc. | 5.000 | 0,00 | 324 | -4,14 | ||||
| 2025-08-28 | NP | PVFIX - Pinnacle Value Fund | 5.441 | 817,54 | 363 | 805,00 | ||||
| 2025-08-14 | 13F | Uniplan Investment Counsel, Inc. | 12.859 | 857 | ||||||
| 2025-07-29 | 13F | Regions Financial Corp | 3.819 | 0,00 | 255 | -1,55 | ||||
| 2025-08-01 | 13F | Chilton Capital Management Llc | 35.523 | -13,42 | 2.361 | -14,71 | ||||
| 2025-08-18 | 13F/A | Westwood Holdings Group Inc | 5.325 | 0,41 | 355 | -0,84 | ||||
| 2025-08-14 | 13F | Federation des caisses Desjardins du Quebec | 150 | 0,00 | 10 | 0,00 | ||||
| 2025-08-15 | 13F | WealthCollab, LLC | 195 | 13 |