Grundlæggende statistik
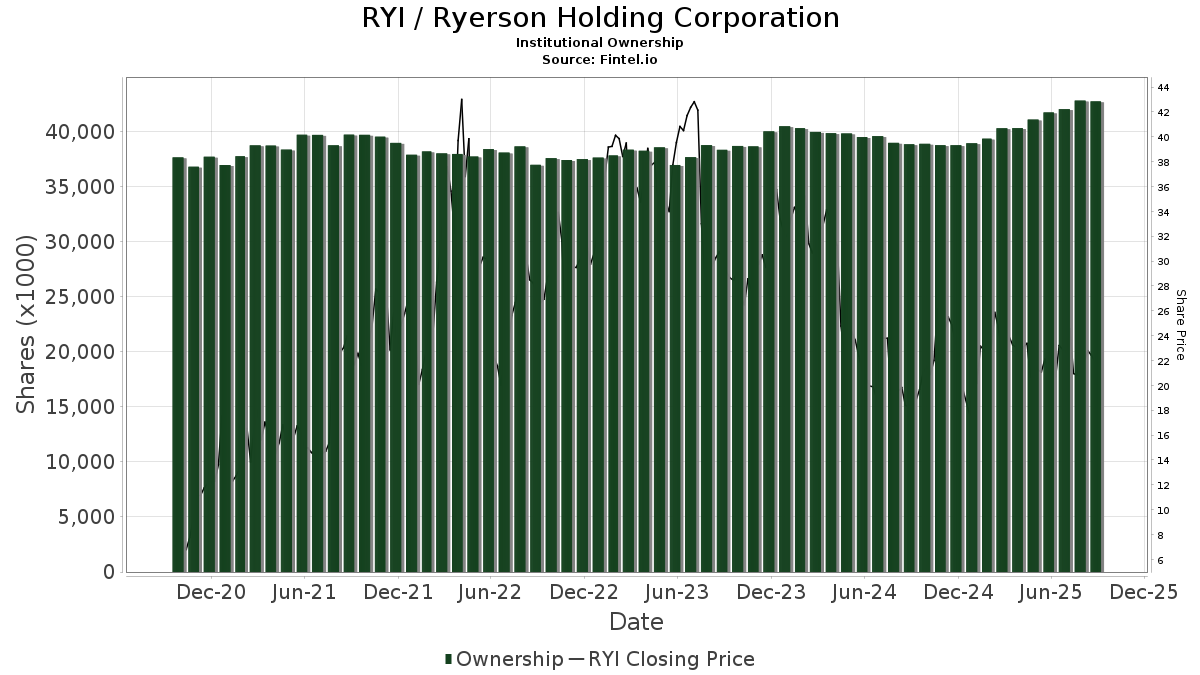
| Institutionelle aktier (lange) | 33.682.520 - 65,13% (ex 13D/G) - change of -7,84MM shares -18,88% MRQ |
| Institutionel værdi (lang) | $ 844.146 USD ($1000) |
Institutionelt ejerskab og aktionærer
Ryerson Holding Corporation (US:RYI) har 145 institutionelle ejere og aktionærer, der har indsendt 13D/G- eller 13F-formularer til Securities Exchange Commission (SEC). Disse institutioner har i alt 33,682,520 aktier. Største aktionærer omfatter Platinum Equity Advisors, LLC/DE, BlackRock, Inc., Franklin Resources Inc, Jb Capital Partners Lp, Dimensional Fund Advisors Lp, Donald Smith & Co., Inc., Vanguard Group Inc, MIRAE ASSET GLOBAL ETFS HOLDINGS Ltd., State Street Corp, and American Century Companies Inc .
Ryerson Holding Corporation (NYSE:RYI) institutionel ejerskabsstruktur viser aktuelle positioner i virksomheden efter institutioner og fonde, samt seneste ændringer i positionsstørrelse. Større aktionærer kan omfatte individuelle investorer, investeringsforeninger, hedgefonde eller institutioner. Skema 13D angiver, at investoren besidder (eller besidder) mere end 5 % af virksomheden og har til hensigt (eller har til hensigt at) aktivt at forfølge en ændring i forretningsstrategi. Skema 13G indikerer en passiv investering på over 5%.
The share price as of February 23, 2026 is 28,16 / share. Previously, on April 8, 2025, the share price was 20,80 / share. This represents an increase of 35,38% over that period.
Fondens stemningsscore
Fund Sentiment Score (fka Ownership Accumulation Score) finder de aktier, der bliver mest købt af fonde. Det er resultatet af en sofistikeret, multi-faktor kvantitativ model, der identificerer virksomheder med de højeste niveauer af institutionel akkumulering. Scoringsmodellen bruger en kombination af den samlede stigning i oplyste ejere, ændringerne i porteføljeallokeringer i disse ejere og andre målinger. Tallet går fra 0 til 100, hvor højere tal indikerer et højere niveau af akkumulering for sine jævnaldrende, og 50 er gennemsnittet.
Opdateringsfrekvens: Dagligt
Se Ownership Explorer, som giver en liste over højest rangerende virksomheder.
AI+ Ask Fintel’s AI assistant about Ryerson Holding Corporation.
Select a question to share a public post with an AI-crafted answer.
Thinking of good questions…
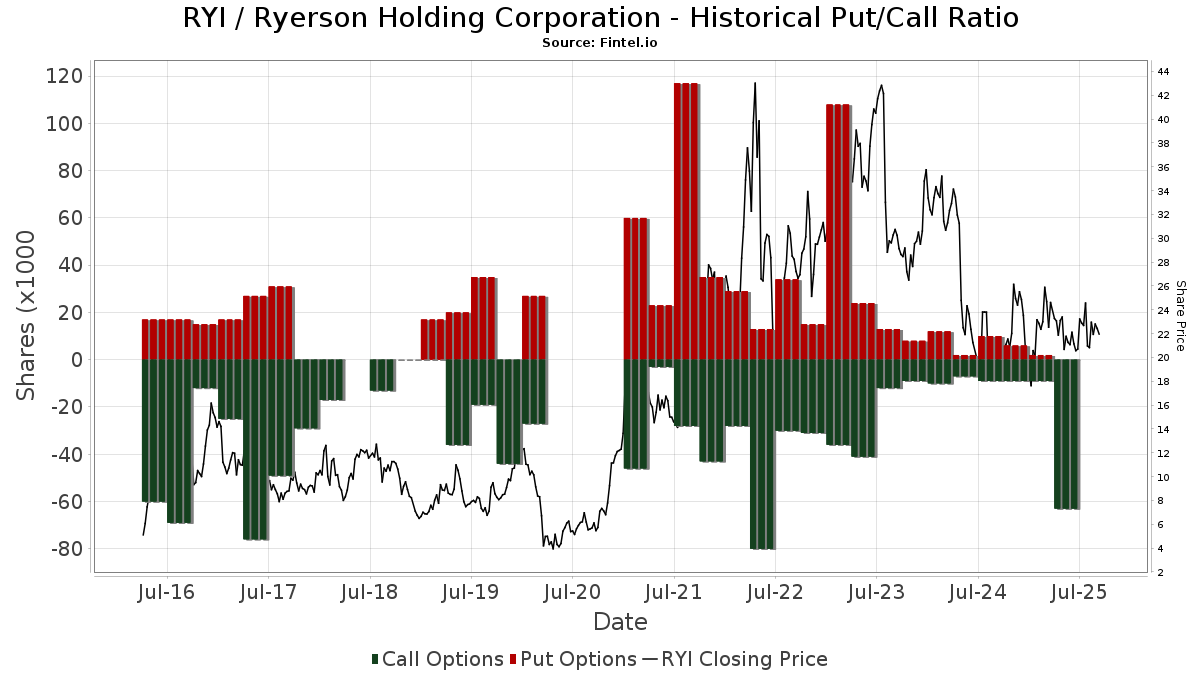
Institutionel Put/Call-forhold
Ud over at indberette standardaktie- og gældsudstedelser skal institutter med mere end 100 mill. aktiver under forvaltning også oplyse deres put- og call-optionsbeholdninger. Da salgsoptioner generelt indikerer negativ stemning, og købsoptioner indikerer positiv stemning, kan vi få en fornemmelse af den overordnede institutionelle stemning ved at plotte forholdet mellem put og kald. Diagrammet til højre viser det historiske put/call-forhold for dette instrument.
Brug af Put/Call Ratio som en indikator for investorernes stemning overvinder en af de vigtigste mangler ved at bruge totalt institutionelt ejerskab, som er, at en betydelig mængde af aktiver under forvaltning investeres passivt for at spore indekser. Passivt forvaltede fonde køber typisk ikke optioner, så indikatoren for put/call-forholdet følger mere nøje følelsen af aktivt forvaltede fonde.
13F og NPORT arkivering
Detaljer om 13F-arkivering er gratis. Detaljer om NP-ansøgninger kræver et premium-medlemskab. Grønne rækker angiver nye positioner. Røde rækker angiver lukkede positioner. Klik på linket ikon for at se den fulde transaktionshistorik.
Opgrader
for at låse premium-data op og eksportere til Excel ![]() .
.
| Fil dato | Kilde | Investor | Type | Gennemsnitlig pris (Øst) |
Aktier | Δ Aktier (%) |
Rapporteret Værdi ($1000) |
Δ Værdi (%) |
Port Alloc (%) |
|
|---|---|---|---|---|---|---|---|---|---|---|
| 2026-01-20 | 13F | Global Trust Asset Management, LLC | 5.000 | 126 | ||||||
| 2026-02-17 | 13F | Northern Trust Corp | 228.174 | -6,32 | 5.741 | 3,11 | ||||
| 2026-02-17 | 13F | Advisory Services Network, LLC | 0 | -100,00 | 0 | |||||
| 2026-02-17 | 13F | SummitTX Capital, L.P. | 281.503 | 7.083 | ||||||
| 2026-02-17 | 13F | Susquehanna International Group, Llp | 18.315 | 461 | ||||||
| 2026-01-07 | 13F | CWA Asset Management Group, LLC | 0 | -100,00 | 0 | -100,00 | ||||
| 2026-02-04 | 13F | Bailard, Inc. | 0 | -100,00 | 0 | |||||
| 2026-02-17 | 13F | Russell Investments Group, Ltd. | 53.185 | 1,23 | 1.338 | 11,50 | ||||
| 2026-01-21 | 13F | Flagship Harbor Advisors, Llc | 15 | 0 | ||||||
| 2026-02-12 | 13F | Voya Investment Management Llc | 0 | -100,00 | 0 | |||||
| 2026-03-06 | 13F | Hsbc Holdings Plc | 0 | -100,00 | 0 | |||||
| 2026-02-11 | 13F | Winton Capital Group Ltd | 0 | -100,00 | 0 | -100,00 | ||||
| 2026-02-17 | 13F | Royal Bank Of Canada | 1.013 | -97,84 | 25 | -97,67 | ||||
| 2026-02-10 | 13F | Quantbot Technologies LP | 272 | 7 | ||||||
| 2026-01-08 | 13F | True Wealth Design, LLC | 65 | -32,29 | 2 | -50,00 | ||||
| 2026-02-17 | 13F | Advisor Group Holdings, Inc. | 6.679 | -39,39 | 168 | -33,07 | ||||
| 2026-01-28 | 13F | Universal- Beteiligungs- und Servicegesellschaft mbH | 20.285 | -25,93 | 517 | -17,41 | ||||
| 2026-02-13 | 13F | Charles Schwab Investment Management Inc | 1.128.728 | 2,57 | 28.399 | 12,89 | ||||
| 2026-02-12 | 13F | Advisors Asset Management, Inc. | 472 | -49,57 | 12 | -47,62 | ||||
| 2026-02-13 | 13F | CDC Financial, Inc. | 134.160 | 3.375 | ||||||
| 2026-02-11 | 13F | Jpmorgan Chase & Co | 65.107 | -57,46 | 1.638 | -53,17 | ||||
| 2026-01-30 | 13F | Us Bancorp \de\ | 788 | -8,27 | 20 | 0,00 | ||||
| 2026-02-09 | 13F | Geode Capital Management, Llc | 646.011 | -0,50 | 16.257 | 9,51 | ||||
| 2026-02-13 | 13F | Wells Fargo & Company/mn | 31.395 | 44,11 | 790 | 58,43 | ||||
| 2026-02-17 | 13F | Bank Of America Corp /de/ | 58.049 | -47,26 | 1.461 | -41,97 | ||||
| 2026-02-17 | 13F | Citadel Advisors Llc | 24.902 | -45,12 | 627 | -39,63 | ||||
| 2026-01-30 | 13F | New York State Teachers Retirement System | 0 | -100,00 | 0 | |||||
| 2026-02-13 | 13F | Walleye Capital LLC | 66.584 | 1.675 | ||||||
| 2026-02-17 | 13F | XTX Topco Ltd | 9.273 | 233 | ||||||
| 2026-02-11 | 13F | Allianz Asset Management GmbH | 355.245 | 14,98 | 8.938 | 26,55 | ||||
| 2026-02-17 | 13F | State Of Wisconsin Investment Board | 22.556 | -2,38 | 568 | 7,39 | ||||
| 2026-02-13 | 13F | Verition Fund Management LLC | 9.500 | -65,28 | 239 | -61,76 | ||||
| 2026-02-17 | 13F | Cambria Investment Management, L.P. | 0 | -100,00 | 0 | -100,00 | ||||
| 2026-01-20 | 13F | Harbor Capital Advisors, Inc. | 13.606 | 35,01 | 0 | |||||
| 2026-02-11 | 13F | Ameritas Investment Partners, Inc. | 2.265 | 57 | ||||||
| 2026-02-17 | 13F | Public Employees Retirement System Of Ohio | 20.066 | 0,61 | 505 | 10,77 | ||||
| 2026-02-17 | 13F | Trexquant Investment LP | 46.435 | 1.168 | ||||||
| 2026-02-13 | 13F | Rhumbline Advisers | 36.754 | -11,04 | 925 | -2,12 | ||||
| 2025-11-14 | 13F | CastleKnight Management LP | 0 | -100,00 | 0 | -100,00 | ||||
| 2026-02-06 | 13F | EverSource Wealth Advisors, LLC | 392 | -18,84 | 10 | -18,18 | ||||
| 2026-02-10 | 13F | Goldman Sachs Group Inc | 868.278 | 278,74 | 21.846 | 316,89 | ||||
| 2026-02-11 | 13F | Deutsche Bank Ag\ | 28.349 | 32,78 | 713 | 46,11 | ||||
| 2026-02-12 | 13F | MetLife Investment Management, LLC | 15.640 | -11,62 | 394 | -2,72 | ||||
| 2025-10-17 | 13F | Copeland Capital Management, LLC | 0 | -100,00 | 0 | |||||
| 2026-02-17 | 13F | Engineers Gate Manager LP | 0 | -100,00 | 0 | |||||
| 2026-02-06 | 13F | Larson Financial Group LLC | 62 | -74,38 | 2 | -80,00 | ||||
| 2026-02-13 | 13F | Barclays Plc | 60.670 | 9,65 | 1.526 | 38,60 | ||||
| 2026-02-10 | 13F | Intech Investment Management Llc | 11.876 | -16,69 | 299 | -8,31 | ||||
| 2026-02-13 | 13F | Advisory Research Inc | 0 | -100,00 | 0 | |||||
| 2026-02-09 | 13F | Quest Partners LLC | 36.114 | 1.289,53 | 909 | 1.438,98 | ||||
| 2026-02-17 | 13F | D. E. Shaw & Co., Inc. | 17.238 | 54,56 | 434 | 70,47 | ||||
| 2026-02-17 | 13F | Prescott General Partners LLC | 30.000 | 0,00 | 755 | 10,07 | ||||
| 2026-02-11 | 13F | Simplex Trading, Llc | 0 | -100,00 | 0 | |||||
| 2026-02-11 | 13F | Simplex Trading, Llc | Put | 0 | -100,00 | 0 | ||||
| 2026-02-17 | 13F | Ancora Advisors, LLC | 6.331 | 159 | ||||||
| 2026-02-11 | 13F | Group One Trading, L.p. | Put | 0 | -100,00 | 0 | -100,00 | |||
| 2026-02-09 | 13F | Hartland & Co., LLC | 6 | -88,00 | 0 | -100,00 | ||||
| 2026-02-13 | 13F | Caitong International Asset Management Co., Ltd | 0 | -100,00 | 0 | |||||
| 2026-02-12 | 13F | Renaissance Technologies Llc | 119.697 | -25,45 | 3.012 | -17,96 | ||||
| 2026-02-13 | 13F | Victory Capital Management Inc | 998.150 | 1,01 | 25.113 | 11,17 | ||||
| 2026-02-17 | 13F | Verdad Advisers, LP | 0 | -100,00 | 0 | |||||
| 2026-04-07 | 13F | Signaturefd, Llc | 106 | 96,30 | 2 | 100,00 | ||||
| 2026-02-13 | 13F | Jacobs Levy Equity Management, Inc | 310.064 | -4,02 | 7.801 | 5,65 | ||||
| 2026-02-17 | 13F | Odyssean, LLC | 11.989 | 302 | ||||||
| 2026-02-10 | 13F | Bnp Paribas Arbitrage, Sa | 6.122 | -52,53 | 154 | -47,62 | ||||
| 2026-02-11 | 13F | Brandywine Global Investment Management, LLC | 129.480 | -3,57 | 3.258 | 6,13 | ||||
| 2026-02-12 | 13F | Aegis Financial Corp | 707.390 | 17.798 | ||||||
| 2026-02-12 | 13F | Towle & Co | 392.634 | 4,86 | 9.879 | 15,41 | ||||
| 2026-01-09 | 13F | SG Americas Securities, LLC | 24.097 | -46,00 | 1 | -100,00 | ||||
| 2026-02-17 | 13F | Grantham, Mayo, Van Otterloo & Co. LLC | 0 | -100,00 | 0 | |||||
| 2026-02-13 | 13F | American Century Companies Inc | 1.244.861 | 4,24 | 31.321 | 14,73 | ||||
| 2026-02-13 | 13F | Police & Firemen's Retirement System of New Jersey | 7.584 | 0,00 | 191 | 9,83 | ||||
| 2026-02-17 | 13F | Grizzlyrock Capital, Llc | 274.596 | -6,31 | 6.909 | 3,10 | ||||
| 2026-01-21 | 13F | Newbridge Financial Services Group, Inc. | 0 | -100,00 | 0 | |||||
| 2026-01-28 | 13F | Klp Kapitalforvaltning As | 31.500 | 0,00 | 793 | 10,00 | ||||
| 2026-02-04 | 13F | Versor Investments LP | 0 | -100,00 | 0 | |||||
| 2025-11-14 | 13F | Citadel Advisors Llc | Call | 0 | -100,00 | 0 | -100,00 | |||
| 2026-01-29 | 13F | Comerica Bank | 46.013 | 10,12 | 1.158 | 21,15 | ||||
| 2026-01-15 | 13F | Nisa Investment Advisors, Llc | 526 | 0,00 | 13 | 8,33 | ||||
| 2026-02-10 | 13F | Rothschild Investment Llc | 45 | -25,00 | 1 | 0,00 | ||||
| 2025-10-27 | 13F | Janney Montgomery Scott LLC | 0 | -100,00 | 0 | |||||
| 2025-11-13 | 13F | Landscape Capital Management, L.l.c. | 0 | -100,00 | 0 | |||||
| 2026-02-13 | 13F | Citigroup Inc | 16.012 | -11,00 | 403 | -2,19 | ||||
| 2026-02-10 | 13F | Bank of New York Mellon Corp | 241.199 | 7,67 | 6.069 | 18,49 | ||||
| 2026-02-13 | 13F | Cynosure Management, Llc | 0 | -100,00 | 0 | -100,00 | ||||
| 2026-02-17 | 13F | Frontier Capital Management Co Llc | 374.908 | 43,91 | 9.433 | 58,39 | ||||
| 2026-02-12 | 13F | BlackRock, Inc. | 3.182.493 | -0,16 | 80.072 | 9,89 | ||||
| 2026-01-21 | 13F | Capital Advisors, Ltd. LLC | 0 | -100,00 | 0 | |||||
| 2026-02-03 | 13F | SummerHaven Investment Management, LLC | 35.520 | 0,00 | 894 | 10,11 | ||||
| 2026-02-13 | 13F | Macquarie Group Ltd | 0 | -100,00 | 0 | -100,00 | ||||
| 2026-02-13 | 13F | Mariner, LLC | 0 | -100,00 | 0 | |||||
| 2026-02-13 | 13F | Caxton Associates Llp | 7.967 | 200 | ||||||
| 2026-02-17 | 13F | Two Sigma Investments, Lp | 127.374 | 3.205 | ||||||
| 2026-02-17 | 13F | Price T Rowe Associates Inc /md/ | 20.985 | 6,41 | 1 | |||||
| 2026-02-17 | 13F | Optiver Holding B.V. | 56 | -49,09 | 1 | -50,00 | ||||
| 2026-02-10 | 13F | Murphy & Mullick Capital Management Corp | 570 | 0,71 | 14 | 16,67 | ||||
| 2026-02-14 | 13F | Rockefeller Capital Management L.P. | 1.193 | 8,36 | 30 | 20,00 | ||||
| 2026-02-06 | 13F | IFP Advisors, Inc | 5 | -82,76 | 0 | |||||
| 2026-02-13 | 13F | SRS Capital Advisors, Inc. | 813 | -84,69 | 20 | -83,47 | ||||
| 2026-02-11 | 13F | LPL Financial LLC | 12.333 | -25,03 | 310 | -17,55 | ||||
| 2026-02-11 | 13F | Franklin Resources Inc | 2.872.992 | -0,10 | 72.284 | 9,95 | ||||
| 2026-02-13 | 13F | Jb Capital Partners Lp | 2.343.475 | 10,28 | 58.962 | 21,37 | ||||
| 2026-02-17 | 13F | Virtus Investment Advisers, Inc. | 0 | -100,00 | 0 | -100,00 | ||||
| 2025-11-21 | 13F | Nebula Research & Development LLC | 0 | -100,00 | 0 | |||||
| 2026-04-06 | 13F | GAMMA Investing LLC | 1.127 | 37,61 | 25 | 25,00 | ||||
| 2026-01-29 | 13F | UBS Group AG | 50.301 | -59,14 | 1.266 | -55,05 | ||||
| 2026-02-17 | 13F | Dba Trading, Llc | 35.000 | 881 | ||||||
| 2025-10-16 | 13F | Kingstone Capital Partners Texas, LLC | 0 | -100,00 | 0 | -100,00 | ||||
| 2026-02-13 | 13F | Manufacturers Life Insurance Company, The | 0 | -100,00 | 0 | |||||
| 2026-02-17 | 13F | Fmr Llc | 2.909 | -68,71 | 73 | -65,57 | ||||
| 2026-02-05 | 13F | Amalgamated Bank | 852 | -11,25 | 0 | |||||
| 2026-04-07 | 13F | CoreCap Advisors, LLC | 160 | 0,00 | 4 | -25,00 | ||||
| 2026-02-09 | 13F | Hantz Financial Services, Inc. | 42.481 | -7,94 | 1 | 0,00 | ||||
| 2026-01-23 | 13F | State of Alaska, Department of Revenue | 1.316 | 0,00 | 0 | |||||
| 2026-02-11 | 13F | CenterBook Partners LP | 30.785 | 775 | ||||||
| 2026-02-12 | 13F | Dimensional Fund Advisors Lp | 1.911.512 | -1,98 | 48.095 | 7,89 | ||||
| 2026-02-11 | 13F | Los Angeles Capital Management Llc | 173 | 4 | ||||||
| 2026-02-17 | 13F | California State Teachers Retirement System | 27.438 | -1,11 | 690 | 8,83 | ||||
| 2026-01-26 | 13F | Cwm, Llc | 4.527 | -34,89 | 0 | |||||
| 2026-02-17 | 13F | Bridgeway Capital Management Inc | 283.508 | -4,04 | 7.133 | 5,63 | ||||
| 2026-02-05 | 13F | Allworth Financial LP | 372 | -25,45 | 9 | -18,18 | ||||
| 2026-02-17 | 13F | Platinum Equity Advisors, LLC/DE | 3.924.478 | 0,00 | 98.740 | 10,06 | ||||
| 2025-11-14 | 13F | Raymond James Financial Inc | 0 | -100,00 | 0 | |||||
| 2026-02-11 | 13F | Parallel Advisors, LLC | 590 | 1,72 | 15 | 7,69 | ||||
| 2026-02-13 | 13F | Parkside Financial Bank & Trust | 1.000 | 25 | ||||||
| 2026-04-06 | 13F | Versant Capital Management, Inc | 555 | -42,67 | 12 | -50,00 | ||||
| 2026-02-17 | 13F | Ameriprise Financial Inc | 423.386 | 468,55 | 10.652 | 525,85 | ||||
| 2026-02-13 | 13F | Morgan Stanley | 242.648 | -0,51 | 6.105 | 9,51 | ||||
| 2026-02-17 | 13F | Quantinno Capital Management LP | 28.972 | 41,94 | 729 | 56,22 | ||||
| 2026-02-06 | 13F | Lsv Asset Management | 10.500 | -92,09 | 0 | -100,00 | ||||
| 2026-02-17 | 13F | Kemnay Advisory Services Inc. | 1.598 | 40 | ||||||
| 2026-02-13 | 13F | State Street Corp | 1.346.674 | -8,36 | 33.882 | 0,86 | ||||
| 2026-01-26 | 13F | Grace & White Inc /ny | 76.567 | -8,81 | 1.926 | 0,36 | ||||
| 2026-02-17 | 13F | Millennium Management Llc | 104.555 | 336,10 | 2.631 | 379,93 | ||||
| 2026-04-07 | 13F | Farther Finance Advisors, LLC | 353 | 8,28 | 8 | -12,50 | ||||
| 2026-02-13 | 13F | Arrowstreet Capital, Limited Partnership | 400.719 | -9,02 | 10.082 | 0,14 | ||||
| 2026-02-06 | 13F | Covestor Ltd | 345 | -2,82 | 0 | |||||
| 2026-02-09 | 13F | Fisher Asset Management, LLC | 0 | -100,00 | 0 | |||||
| 2026-02-03 | 13F | SBI Securities Co., Ltd. | 3 | 0,00 | 0 | |||||
| 2026-02-13 | 13F | Great West Life Assurance Co /can/ | 7.265 | 111,93 | 0 | |||||
| 2026-02-13 | 13F | Entropy Technologies, LP | 9.185 | 231 | ||||||
| 2026-02-13 | 13F | Van Eck Associates Corp | 0 | -100,00 | 0 | |||||
| 2026-02-17 | 13F | Aquatic Capital Management LLC | 8.025 | 202 | ||||||
| 2025-11-14 | 13F | Petrus Trust Company, LTA | 0 | -100,00 | 0 | |||||
| 2026-02-17 | 13F | Alliancebernstein L.p. | 24.600 | 0,00 | 619 | 9,96 | ||||
| 2026-02-12 | 13F | Nuveen, LLC | 78.778 | -1,47 | 1.982 | 8,48 | ||||
| 2026-02-17 | 13F | Shelton Capital Management | 26.624 | -42,90 | 670 | -37,18 | ||||
| 2026-02-11 | 13F | Donald Smith & Co., Inc. | 1.889.916 | 207,94 | 47.550 | 238,94 | ||||
| 2026-02-13 | 13F | Squarepoint Ops LLC | 0 | -100,00 | 0 | |||||
| 2026-01-29 | 13F | Vanguard Group Inc | 1.709.724 | -0,20 | 43.017 | 9,84 | ||||
| 2026-02-09 | 13F | Legal & General Group Plc | 27.618 | -9,73 | 695 | -0,72 | ||||
| 2025-11-12 | 13F | William Blair Investment Management, Llc | 0 | -100,00 | 0 | |||||
| 2026-01-22 | 13F | Massachusetts Financial Services Co /ma/ | 0 | -100,00 | 0 | |||||
| 2026-02-13 | 13F | Sei Investments Co | 72.318 | 1.820 | ||||||
| 2026-02-02 | 13F | Mutual Advisors, LLC | 47.235 | 5,28 | 1.188 | 12,08 | ||||
| 2026-02-06 | 13F | Pnc Financial Services Group, Inc. | 80 | 40,35 | 2 | 100,00 | ||||
| 2026-02-17 | 13F | Invenomic Capital Management LP | 653.514 | 270,52 | 16.442 | 307,89 | ||||
| 2026-01-28 | 13F | Teacher Retirement System Of Texas | 41.890 | -6,21 | 1.054 | 3,13 | ||||
| 2026-01-15 | 13F | Fortitude Family Office, LLC | 141 | 0,00 | 4 | 0,00 | ||||
| 2026-02-13 | 13F | Sterling Capital Management LLC | 1.578 | -91,09 | 40 | -90,35 | ||||
| 2026-02-12 | 13F | Skopos Labs, Inc. | 13.190 | 341 | ||||||
| 2026-02-17 | 13F | Aqr Capital Management Llc | 109.601 | -47,07 | 2.758 | -41,75 | ||||
| 2026-01-14 | 13F | Wedge Capital Management L L P/nc | 54.219 | 10,53 | 1.364 | 21,68 | ||||
| 2026-02-13 | 13F | BNP Paribas Asset Management Holding S.A. | 617 | 55,81 | 0 | |||||
| 2026-01-21 | 13F | Unison Advisors LLC | 0 | -100,00 | 0 | |||||
| 2026-02-13 | 13F | MAI Capital Management | 900 | -18,18 | 23 | -12,00 | ||||
| 2026-01-27 | 13F | Zurcher Kantonalbank (Zurich Cantonalbank) | 10.748 | 0,00 | 270 | 10,20 | ||||
| 2026-02-09 | 13F | New Age Alpha Advisors, LLC | 0 | -100,00 | 0 | |||||
| 2026-02-17 | 13F | Harvest Management Llc | 17.748 | 447 | ||||||
| 2026-02-17 | 13F | MIRAE ASSET GLOBAL ETFS HOLDINGS Ltd. | 1.429.017 | 2,41 | 35.955 | 12,72 | ||||
| 2026-02-17 | 13F | Janus Henderson Group Plc | 11.263 | 0,00 | 283 | 10,12 | ||||
| 2026-02-10 | 13F | Acadian Asset Management Llc | 2.750 | -76,67 | 0 | |||||
| 2025-11-14 | 13F | Jane Street Group, Llc | 0 | -100,00 | 0 | |||||
| 2026-02-17 | 13F | Jones Financial Companies Lllp | 44 | 0,00 | 1 | 0,00 | ||||
| 2026-02-13 | 13F | Ubs Asset Management Americas Inc | 48.776 | -1,10 | 1.227 | 8,87 | ||||
| 2025-11-05 | 13F | Bessemer Group Inc | 0 | -100,00 | 0 | |||||
| 2026-02-11 | 13F | Empowered Funds, LLC | 270.619 | -3,03 | 6.809 | 6,73 | ||||
| 2026-02-12 | 13F | Swiss National Bank | 54.000 | 2,86 | 1.359 | 13,17 | ||||
| 2026-02-02 | 13F | Strs Ohio | 10.900 | -56,75 | 274 | -52,43 | ||||
| 2026-02-11 | 13F | Simplex Trading, Llc | Call | 400 | -20,00 | 10 | ||||
| 2026-02-19 | 13F | Invesco Ltd. | 82.314 | -11,95 | 2.071 | -3,09 | ||||
| 2026-02-12 | 13F | New York State Common Retirement Fund | 9.429 | 0,00 | 237 | 10,23 | ||||
| 2026-02-10 | 13F | State of Wyoming | 10.960 | -67,52 | 276 | -64,33 | ||||
| 2026-02-17 | 13F | Two Sigma Advisers, Lp | 85.300 | 788,54 | 2.146 | 879,91 | ||||
| 2026-02-11 | 13F | Group One Trading, L.p. | Call | 800 | 100,00 | 20 | 122,22 | |||
| 2026-02-13 | 13F | Transamerica Financial Advisors, Inc. | 5 | 0 | ||||||
| 2026-02-17 | 13F | Tower Research Capital LLC (TRC) | 2.118 | -66,67 | 53 | -63,45 | ||||
| 2025-11-12 | 13F | Robotti Robert | 0 | -100,00 | 0 |