Grundlæggende statistik
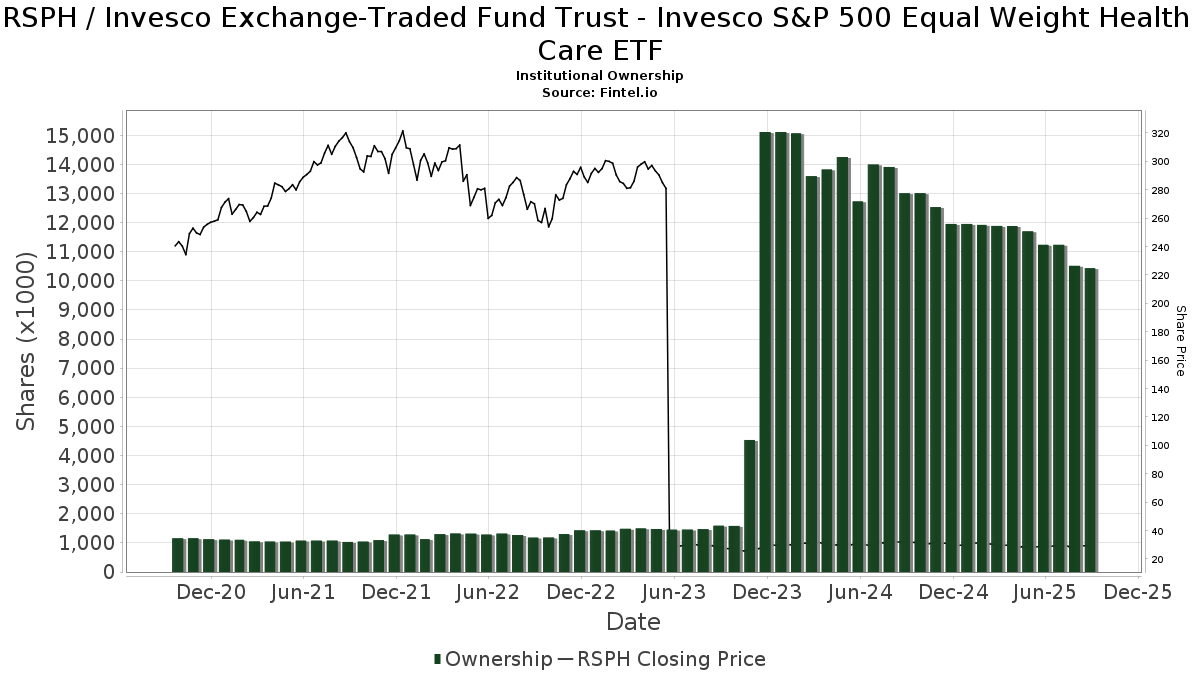
| Institutionelle ejere | 168 total, 168 long only, 0 short only, 0 long/short - change of -10,11% MRQ |
| Gennemsnitlig porteføljeallokering | 0.1253 % - change of -17,80% MRQ |
| Institutionelle aktier (lange) | 10.435.096 (ex 13D/G) - change of -0,77MM shares -6,89% MRQ |
| Institutionel værdi (lang) | $ 297.531 USD ($1000) |
Institutionelt ejerskab og aktionærer
Invesco Exchange-Traded Fund Trust - Invesco S&P 500 Equal Weight Health Care ETF (US:RSPH) har 168 institutionelle ejere og aktionærer, der har indsendt 13D/G- eller 13F-formularer til Securities Exchange Commission (SEC). Disse institutioner har i alt 10,435,096 aktier. Største aktionærer omfatter HighTower Advisors, LLC, Morgan Stanley, LPL Financial LLC, Walled Lake Planning & Wealth Management, Llc, Bank Of America Corp /de/, Royal Bank Of Canada, Raymond James Financial Inc, MAI Capital Management, Jpmorgan Chase & Co, and Federation des caisses Desjardins du Quebec .
Invesco Exchange-Traded Fund Trust - Invesco S&P 500 Equal Weight Health Care ETF (ARCA:RSPH) institutionel ejerskabsstruktur viser aktuelle positioner i virksomheden efter institutioner og fonde, samt seneste ændringer i positionsstørrelse. Større aktionærer kan omfatte individuelle investorer, investeringsforeninger, hedgefonde eller institutioner. Skema 13D angiver, at investoren besidder (eller besidder) mere end 5 % af virksomheden og har til hensigt (eller har til hensigt at) aktivt at forfølge en ændring i forretningsstrategi. Skema 13G indikerer en passiv investering på over 5%.
The share price as of September 8, 2025 is 29,49 / share. Previously, on September 9, 2024, the share price was 31,79 / share. This represents a decline of 7,23% over that period.
Fondens stemningsscore
Fund Sentiment Score (fka Ownership Accumulation Score) finder de aktier, der bliver mest købt af fonde. Det er resultatet af en sofistikeret, multi-faktor kvantitativ model, der identificerer virksomheder med de højeste niveauer af institutionel akkumulering. Scoringsmodellen bruger en kombination af den samlede stigning i oplyste ejere, ændringerne i porteføljeallokeringer i disse ejere og andre målinger. Tallet går fra 0 til 100, hvor højere tal indikerer et højere niveau af akkumulering for sine jævnaldrende, og 50 er gennemsnittet.
Opdateringsfrekvens: Dagligt
Se Ownership Explorer, som giver en liste over højest rangerende virksomheder.
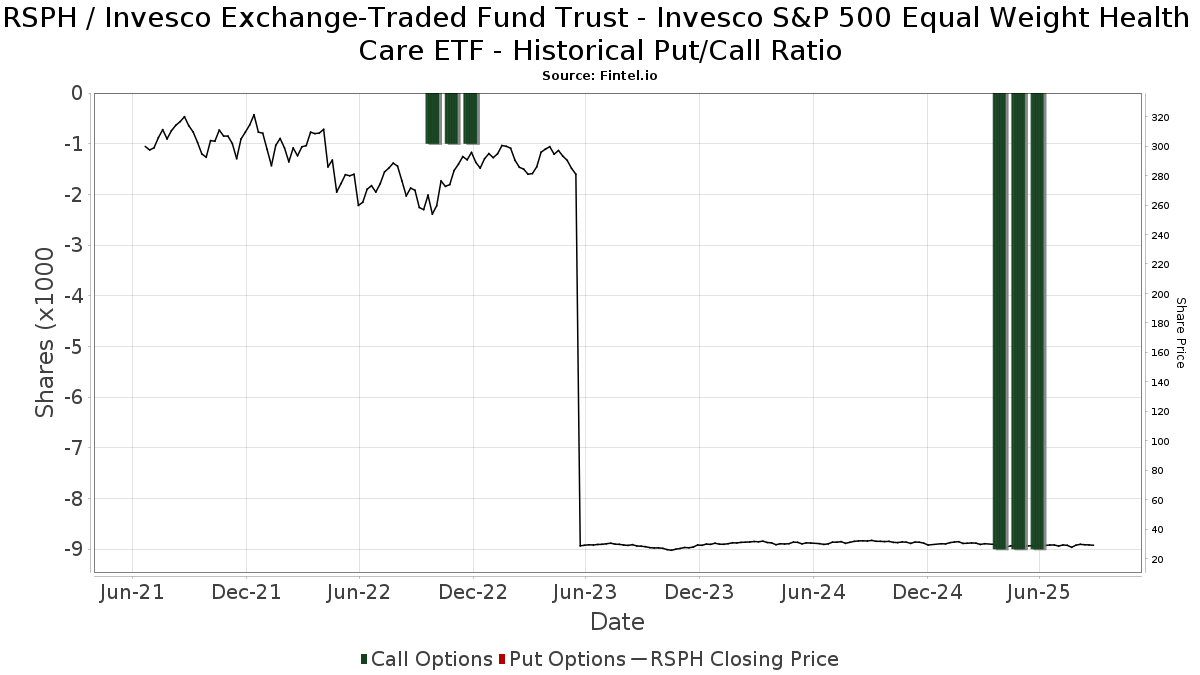
Institutionel Put/Call-forhold
Ud over at indberette standardaktie- og gældsudstedelser skal institutter med mere end 100 mill. aktiver under forvaltning også oplyse deres put- og call-optionsbeholdninger. Da salgsoptioner generelt indikerer negativ stemning, og købsoptioner indikerer positiv stemning, kan vi få en fornemmelse af den overordnede institutionelle stemning ved at plotte forholdet mellem put og kald. Diagrammet til højre viser det historiske put/call-forhold for dette instrument.
Brug af Put/Call Ratio som en indikator for investorernes stemning overvinder en af de vigtigste mangler ved at bruge totalt institutionelt ejerskab, som er, at en betydelig mængde af aktiver under forvaltning investeres passivt for at spore indekser. Passivt forvaltede fonde køber typisk ikke optioner, så indikatoren for put/call-forholdet følger mere nøje følelsen af aktivt forvaltede fonde.
13F og NPORT arkivering
Detaljer om 13F-arkivering er gratis. Detaljer om NP-ansøgninger kræver et premium-medlemskab. Grønne rækker angiver nye positioner. Røde rækker angiver lukkede positioner. Klik på linket ikon for at se den fulde transaktionshistorik.
Opgrader
for at låse premium-data op og eksportere til Excel ![]() .
.
| Fil dato | Kilde | Investor | Type | Gennemsnitlig pris (Øst) |
Aktier | Δ Aktier (%) |
Rapporteret Værdi ($1000) |
Δ Værdi (%) |
Port Alloc (%) |
|
|---|---|---|---|---|---|---|---|---|---|---|
| 2025-08-11 | 13F | HighTower Advisors, LLC | 2.246.103 | -7,13 | 65.541 | -8,91 | ||||
| 2025-07-23 | 13F | Country Club Bank /gfn | 7.500 | 0,00 | 218 | -1,81 | ||||
| 2025-08-14 | 13F | Boston Private Wealth Llc | 0 | -100,00 | 0 | |||||
| 2025-07-14 | 13F | CRA Financial Services, LLC | 17.106 | -8,65 | 499 | -10,41 | ||||
| 2025-08-11 | 13F | Aptus Capital Advisors, LLC | 104 | -38,46 | 3 | -40,00 | ||||
| 2025-05-15 | 13F | Hrt Financial Lp | 0 | -100,00 | 0 | |||||
| 2025-08-12 | 13F | Fca Corp /tx | 139.979 | 2,51 | 4.085 | 0,54 | ||||
| 2025-07-23 | 13F | Optas, LLC | 30.398 | -3,10 | 887 | -4,93 | ||||
| 2025-08-12 | 13F | Franklin Resources Inc | 900 | 0,00 | 26 | 0,00 | ||||
| 2025-08-12 | 13F | LPL Financial LLC | 450.503 | -2,93 | 13.146 | -4,79 | ||||
| 2025-08-14 | 13F | Comerica Bank | 2.100 | -39,85 | 61 | -40,78 | ||||
| 2025-07-10 | 13F | Exchange Traded Concepts, Llc | 1.001 | 29 | ||||||
| 2025-07-24 | 13F | Blair William & Co/il | 7.000 | 0,00 | 204 | -1,92 | ||||
| 2025-05-15 | 13F | Graham Capital Management, L.P. | 0 | -100,00 | 0 | |||||
| 2025-07-14 | 13F | AdvisorNet Financial, Inc | 3.660 | 0,00 | 107 | -1,85 | ||||
| 2025-08-12 | 13F | Financial Advocates Investment Management | 0 | -100,00 | 0 | -100,00 | ||||
| 2025-08-14 | 13F | Guardian Wealth Management, Inc. | 0 | -100,00 | 0 | |||||
| 2025-08-12 | 13F | Global Retirement Partners, LLC | 163 | 0,62 | 5 | 0,00 | ||||
| 2025-08-12 | 13F | O'shaughnessy Asset Management, Llc | 1.037 | 0,19 | 30 | 0,00 | ||||
| 2025-08-14 | 13F | Ausdal Financial Partners, Inc. | 59.345 | -3,14 | 1.732 | -4,99 | ||||
| 2025-08-12 | 13F | Stelac Advisory Services LLC | 70.061 | -1,49 | 2.045 | -3,31 | ||||
| 2025-07-22 | 13F | Valley National Advisers Inc | 3.020 | 0,00 | 0 | |||||
| 2025-08-14 | 13F | EP Wealth Advisors, Inc. | 6.400 | 15,94 | 187 | 13,41 | ||||
| 2025-08-04 | 13F | Crescent Sterling, Ltd. | 0 | -100,00 | 0 | |||||
| 2025-08-12 | 13F | MAI Capital Management | 329.368 | -1,99 | 9.611 | -3,87 | ||||
| 2025-08-14 | 13F | Wiley Bros.-aintree Capital, Llc | 26.357 | 0,73 | 769 | -0,52 | ||||
| 2025-08-15 | 13F | Equitable Holdings, Inc. | 8.550 | -29,80 | 249 | -31,22 | ||||
| 2025-05-09 | 13F | Comprehensive Financial Planning, Inc./PA | 0 | -100,00 | 0 | |||||
| 2025-08-13 | 13F | Beacon Pointe Advisors, LLC | 30.050 | 0,00 | 877 | -1,90 | ||||
| 2025-07-11 | 13F | SILVER OAK SECURITIES, Inc | 354 | 10 | ||||||
| 2025-07-31 | 13F | Hartford Financial Management Inc. | 62.366 | -3,36 | 1.820 | -5,21 | ||||
| 2025-08-08 | 13F | Hartland & Co., LLC | 17.945 | -38,86 | 524 | -40,09 | ||||
| 2025-08-14 | 13F | Fmr Llc | 17.112 | -21,40 | 499 | -22,87 | ||||
| 2025-08-11 | 13F | Citigroup Inc | 1.936 | 56 | ||||||
| 2025-08-12 | 13F | Walled Lake Planning & Wealth Management, Llc | 407.726 | 5,29 | 11.897 | 3,27 | ||||
| 2025-08-06 | 13F | Legacy Bridge, LLC | 5.210 | 0,00 | 152 | -1,30 | ||||
| 2025-08-07 | 13F | Runnymede Capital Advisors, Inc. | 0 | -100,00 | 0 | |||||
| 2025-07-15 | 13F | North Star Investment Management Corp. | 0 | -100,00 | 0 | |||||
| 2025-04-30 | 13F | Sofos Investments, Inc. | 266 | 322,22 | 8 | 600,00 | ||||
| 2025-08-12 | 13F | Atlas Capital Advisors Llc | 14.567 | 0,01 | 425 | -1,85 | ||||
| 2025-04-29 | 13F | Lee Danner & Bass Inc | 0 | -100,00 | 0 | |||||
| 2025-08-13 | 13F | Gateway Wealth Partners, LLC | 7.529 | 0,03 | 220 | -1,79 | ||||
| 2025-08-18 | 13F | Hollencrest Capital Management | 1.420 | 0,00 | 41 | -2,38 | ||||
| 2025-08-12 | 13F | Proequities, Inc. | 0 | 0 | ||||||
| 2025-07-24 | 13F | IFP Advisors, Inc | 3.250 | 0,00 | 95 | -2,08 | ||||
| 2025-08-05 | 13F | Wakefield Asset Management LLLP | 0 | -100,00 | 0 | |||||
| 2025-07-18 | 13F | Cooper Financial Group | 11.492 | 0,00 | 335 | -1,76 | ||||
| 2025-07-29 | 13F | Empirical Asset Management, LLC | 29.780 | -3,56 | 869 | -5,45 | ||||
| 2025-07-22 | 13F | Yoder Wealth Management, Inc. | 66.595 | 9,83 | 1.943 | 7,76 | ||||
| 2025-08-14 | 13F | Bank Of America Corp /de/ | 401.689 | -11,13 | 11.721 | -12,84 | ||||
| 2025-07-21 | 13F | Kennebec Savings Bank | 0 | -100,00 | 0 | |||||
| 2025-08-18 | 13F/A | National Bank Of Canada /fi/ | 5.295 | 0,00 | 155 | -1,91 | ||||
| 2025-08-13 | 13F | Northwestern Mutual Wealth Management Co | 5.032 | -4,46 | 147 | -6,41 | ||||
| 2025-08-11 | 13F | Principal Securities, Inc. | 13.998 | -2,96 | 408 | -3,32 | ||||
| 2025-08-13 | 13F | Continuum Advisory, LLC | 0 | -100,00 | 0 | |||||
| 2025-08-14 | 13F | Quantinno Capital Management LP | 15.200 | -4,81 | 444 | -6,74 | ||||
| 2025-08-08 | 13F | Cetera Investment Advisers | 110.709 | 12,18 | 3.230 | 10,05 | ||||
| 2025-08-13 | 13F | Cerity Partners LLC | 9.124 | -0,86 | 266 | -2,56 | ||||
| 2025-08-14 | 13F | Federation des caisses Desjardins du Quebec | 295.294 | 7,46 | 8.617 | 5,39 | ||||
| 2025-08-08 | 13F | Avalon Trust Co | 1.000 | 0,00 | 29 | 0,00 | ||||
| 2025-08-15 | 13F | First Heartland Consultants, Inc. | 25.025 | -2,82 | 730 | -4,70 | ||||
| 2025-05-15 | 13F | TFG Advisers LLC | 0 | -100,00 | 0 | |||||
| 2025-04-29 | 13F | Financial Network Wealth Management LLC | 840 | 0 | ||||||
| 2025-07-11 | 13F | Farther Finance Advisors, LLC | 123.776 | 1,71 | 3.612 | 0,98 | ||||
| 2025-08-14 | 13F | Susquehanna International Group, Llp | 20.052 | 50,63 | 585 | 47,73 | ||||
| 2025-07-15 | 13F | McAdam, LLC | 57.520 | -4,06 | 1.678 | -5,89 | ||||
| 2025-07-24 | 13F | Live Oak Investment Partners | 8.241 | 0,00 | 240 | -2,04 | ||||
| 2025-08-13 | 13F | Lido Advisors, LLC | 32.002 | -4,41 | 934 | -6,33 | ||||
| 2025-07-28 | 13F | Pettinga Financial Advisors, LLC | 53.129 | 88,17 | 1.550 | 84,74 | ||||
| 2025-08-12 | 13F | CIBC Private Wealth Group, LLC | 713 | 0,00 | 21 | 5,26 | ||||
| 2025-07-08 | 13F | Nbc Securities, Inc. | 500 | 0,00 | 0 | |||||
| 2025-04-23 | 13F | Sylvest Advisors, LLC | 0 | -100,00 | 0 | |||||
| 2025-08-11 | 13F | Rothschild Investment Llc | 700 | 0,00 | 20 | 0,00 | ||||
| 2025-08-11 | 13F | Pin Oak Investment Advisors Inc | 500 | 0,00 | 0 | |||||
| 2025-08-08 | 13F | Atlantic Trust, LLC | 1.250 | 0,00 | 36 | -2,70 | ||||
| 2025-07-25 | 13F | Envestnet Portfolio Solutions, Inc. | 0 | -100,00 | 0 | |||||
| 2025-08-01 | 13F | Envestnet Asset Management Inc | 41.637 | 6,89 | 1.215 | 4,84 | ||||
| 2025-05-08 | 13F | Empirical Financial Services, LLC d.b.a. Empirical Wealth Management | 0 | -100,00 | 0 | |||||
| 2025-08-12 | 13F | Jpmorgan Chase & Co | 327.886 | 98,99 | 9.568 | 95,17 | ||||
| 2025-08-04 | 13F | Kovack Advisors, Inc. | 17.954 | -2,02 | 524 | -4,04 | ||||
| 2025-07-29 | 13F | Private Trust Co Na | 5.183 | -70,13 | 151 | -70,74 | ||||
| 2025-07-18 | 13F | Truist Financial Corp | 0 | -100,00 | 0 | |||||
| 2025-08-06 | 13F | AE Wealth Management LLC | 977 | 3,83 | 29 | 3,70 | ||||
| 2025-07-21 | 13F | DHJJ Financial Advisors, Ltd. | 14.816 | 0,01 | 432 | -1,82 | ||||
| 2025-07-31 | 13F | Blue Sky Capital Consultants Group, Inc. | 25.725 | -5,36 | 751 | -7,18 | ||||
| 2025-07-10 | 13F | Focus Financial Network, Inc. | 122.087 | 2,15 | 3.562 | 0,20 | ||||
| 2025-08-13 | 13F | Jones Financial Companies Lllp | 43.100 | 25,13 | 1.252 | 22,99 | ||||
| 2025-08-15 | 13F | Kestra Advisory Services, LLC | 13.786 | -9,36 | 402 | -11,06 | ||||
| 2025-08-15 | 13F | CI Private Wealth, LLC | 23.743 | 0,06 | 693 | -1,84 | ||||
| 2025-08-08 | 13F | Avantax Advisory Services, Inc. | 12.508 | 8,93 | 365 | 6,74 | ||||
| 2025-07-15 | 13F | Mather Group, Llc. | 0 | -100,00 | 0 | |||||
| 2025-08-13 | 13F | Measured Wealth Private Client Group, LLC | 0 | -100,00 | 0 | |||||
| 2025-05-14 | 13F | Jane Street Group, Llc | 0 | -100,00 | 0 | |||||
| 2025-05-15 | 13F | Two Sigma Investments, Lp | 0 | -100,00 | 0 | |||||
| 2025-05-15 | 13F | Blue Chip Partners, Inc. | 0 | -100,00 | 0 | -100,00 | ||||
| 2025-08-28 | 13F/A | Lavaca Capital Llc | 1.100 | 0,00 | 32 | 0,00 | ||||
| 2025-08-01 | 13F | Belvedere Trading LLC | Call | 9.100 | 266 | |||||
| 2025-07-30 | 13F | Cornerstone Advisory, LLC | 78.813 | -1,12 | 2.300 | 3,23 | ||||
| 2025-08-19 | 13F | Asset Dedication, LLC | 17.685 | 0,00 | 516 | -1,90 | ||||
| 2025-07-29 | 13F | Koshinski Asset Management, Inc. | 12.705 | 0,01 | 371 | -1,86 | ||||
| 2025-08-12 | 13F | Howe & Rusling Inc | 125 | 0,00 | 4 | 0,00 | ||||
| 2025-08-13 | 13F | Rsm Us Wealth Management Llc | 22.780 | 0,00 | 665 | -1,92 | ||||
| 2025-08-14 | 13F | Great Valley Advisor Group, Inc. | 29.187 | -1,31 | 852 | -3,30 | ||||
| 2025-05-16 | 13F | Laidlaw Wealth Management LLC | 0 | -100,00 | 0 | |||||
| 2025-08-14 | 13F | GWM Advisors LLC | 5.285 | -30,71 | 154 | -31,86 | ||||
| 2025-05-13 | 13F | Shorepoint Capital Partners LLC | 10.200 | 0,00 | 303 | 1,68 | ||||
| 2025-07-29 | 13F | Harbor Asset Planning, Inc. | 19.251 | 562 | ||||||
| 2025-08-05 | 13F | Dunhill Financial, LLC | 34 | 0,00 | 1 | -100,00 | ||||
| 2025-08-07 | 13F | Cahill Financial Advisors Inc | 75.175 | 0,14 | 2.194 | -1,79 | ||||
| 2025-07-10 | 13F | Wealth Enhancement Advisory Services, Llc | 44.831 | -19,46 | 1.310 | -20,89 | ||||
| 2025-07-15 | 13F | Yarbrough Capital, LLC | 0 | -100,00 | 0 | |||||
| 2025-08-11 | 13F | Private Advisor Group, LLC | 28.414 | -61,82 | 829 | -62,56 | ||||
| 2025-08-07 | 13F | Flagship Wealth Advisors, Llc | 150 | 0,00 | 4 | 0,00 | ||||
| 2025-08-14 | 13F | Bnp Paribas Arbitrage, Sa | 2.422 | 0,00 | 71 | -2,78 | ||||
| 2025-08-14 | 13F/A | Rockefeller Capital Management L.P. | 15.198 | -42,56 | 443 | -43,71 | ||||
| 2025-08-05 | 13F | Scarborough Advisors, LLC | 323 | 9 | ||||||
| 2025-07-23 | 13F | Peak Financial Management, Inc. | 68.031 | -7,40 | 1.985 | -9,15 | ||||
| 2025-05-19 | 13F/A | Trinity Financial Advisors LLC | 0 | -100,00 | 0 | -100,00 | ||||
| 2025-07-23 | 13F | Friedenthal Financial | 109.934 | 5,34 | 3.208 | 3,32 | ||||
| 2025-07-21 | 13F | Ameriflex Group, Inc. | 0 | -100,00 | 0 | |||||
| 2025-07-16 | 13F | Fortune Financial Advisors, LLC | 0 | -100,00 | 0 | |||||
| 2025-08-08 | 13F | Creative Planning | 118.098 | 23,77 | 3.446 | 21,42 | ||||
| 2025-08-14 | 13F | Goldman Sachs Group Inc | 39.781 | 110,56 | 1.161 | 106,41 | ||||
| 2025-05-28 | 13F | Silicon Valley Capital Partners | 101 | 0,00 | 3 | 0,00 | ||||
| 2025-08-01 | 13F | Zhang Financial LLC | 0 | -100,00 | 0 | |||||
| 2025-08-12 | 13F | Steward Partners Investment Advisory, Llc | 1.650 | -78,29 | 48 | -78,76 | ||||
| 2025-08-07 | 13F/A | Joseph Group Capital Management | 3.269 | 0,28 | 95 | -1,04 | ||||
| 2025-08-14 | 13F | UBS Group AG | 136.569 | 35,81 | 3.985 | 33,23 | ||||
| 2025-08-06 | 13F | Commonwealth Equity Services, Llc | 114.840 | -7,52 | 3 | 0,00 | ||||
| 2025-08-12 | 13F | One Charles Private Wealth Services, LLC | 8.980 | 0,00 | 262 | -1,87 | ||||
| 2025-08-07 | 13F | Resources Investment Advisors, LLC. | 10.568 | -2,13 | 308 | -4,05 | ||||
| 2025-08-07 | 13F | Montag A & Associates Inc | 1.662 | -39,08 | 48 | -40,74 | ||||
| 2025-07-01 | 13F | Harbor Investment Advisory, Llc | 5.300 | 0,00 | 155 | -1,91 | ||||
| 2025-08-14 | 13F | Financial Advisory Service, Inc. | 0 | -100,00 | 0 | |||||
| 2025-07-22 | 13F | Berger Financial Group, Inc | 75.710 | -19,60 | 2.209 | -21,14 | ||||
| 2025-08-15 | 13F | Morgan Stanley | 785.996 | 11,16 | 22.935 | 9,03 | ||||
| 2025-08-12 | 13F | AlphaCore Capital LLC | 1.049 | 486,03 | 31 | 500,00 | ||||
| 2025-08-05 | 13F | Sensible Money, LLC | 21.825 | 0,00 | 637 | -2,00 | ||||
| 2025-08-14 | 13F | Wells Fargo & Company/mn | 217.128 | -16,15 | 6.336 | -17,76 | ||||
| 2025-08-14 | 13F | CoreCap Advisors, LLC | 1.540 | 0,00 | 45 | -2,22 | ||||
| 2025-08-18 | 13F | Pacific Center for Financial Services | 701 | 0,29 | 20 | 0,00 | ||||
| 2025-07-17 | 13F | Wagner Wealth Management, Llc | 8.337 | 0,19 | 243 | -1,62 | ||||
| 2025-08-14 | 13F | Acorn Wealth Advisors, LLC | 39.855 | -37,86 | 1.163 | -39,10 | ||||
| 2025-08-07 | 13F | Parkside Financial Bank & Trust | 4.930 | 0,00 | 144 | -2,05 | ||||
| 2025-04-17 | 13F | Pacific Sun Financial Corp | 0 | -100,00 | 0 | |||||
| 2025-08-04 | 13F | Assetmark, Inc | 1.080 | 0,00 | 32 | -3,12 | ||||
| 2025-07-31 | 13F | Cambridge Investment Research Advisors, Inc. | 44.819 | -5,65 | 1 | 0,00 | ||||
| 2025-07-21 | 13F | Rainey & Randall Investment Management Inc. | 102.175 | -85,69 | 2.981 | -85,97 | ||||
| 2025-04-22 | 13F | Jfs Wealth Advisors, Llc | 0 | -100,00 | 0 | -100,00 | ||||
| 2025-07-14 | 13F | UMA Financial Services, Inc. | 130 | 0,00 | 4 | 0,00 | ||||
| 2025-08-14 | 13F | IHT Wealth Management, LLC | 10.446 | -22,66 | 305 | -24,19 | ||||
| 2025-08-05 | 13F | GPS Wealth Strategies Group, LLC | 720 | 0,00 | 21 | 0,00 | ||||
| 2025-08-07 | 13F | PCG Wealth Advisors, LLC | 0 | -100,00 | 0 | |||||
| 2025-07-16 | 13F | Signaturefd, Llc | 1.087 | 0,00 | 32 | -3,12 | ||||
| 2025-08-14 | 13F | LM Advisors LLC | 34.471 | 0,00 | 1 | 0,00 | ||||
| 2025-08-14 | 13F | Raymond James Financial Inc | 347.520 | -2,23 | 10.141 | -4,10 | ||||
| 2025-08-05 | 13F | Bank Of Montreal /can/ | 176.582 | 0,47 | 5.153 | -1,45 | ||||
| 2025-07-30 | 13F | Bogart Wealth, LLC | 5.727 | 0,16 | 167 | -1,76 | ||||
| 2025-08-14 | 13F | Hilltop Holdings Inc. | 13.350 | -1,29 | 390 | -3,23 | ||||
| 2025-05-06 | 13F | Proficio Capital Partners LLC | 0 | -100,00 | 0 | -100,00 | ||||
| 2025-08-07 | 13F | Allworth Financial LP | 24.001 | 0,16 | 700 | 3,55 | ||||
| 2025-08-11 | 13F | United Capital Financial Advisers, Llc | 8.000 | 0,00 | 233 | -2,10 | ||||
| 2025-07-30 | 13F | Avidian Wealth Solutions, LLC | 15.640 | 0,00 | 456 | -1,94 | ||||
| 2025-07-18 | 13F | Eagle Capital Management, LLC | 0 | -100,00 | 0 | |||||
| 2025-07-22 | 13F/A | Red Mountain Financial, LLC | 32.029 | -12,24 | 935 | -13,92 | ||||
| 2025-08-14 | 13F | Mercer Global Advisors Inc /adv | 53.713 | 308,71 | 1.567 | 301,79 | ||||
| 2025-08-19 | 13F | Advisory Services Network, LLC | 10.854 | 10,17 | 303 | 3,41 | ||||
| 2025-07-17 | 13F | Walker Asset Management, LLC | 41.282 | 2,34 | 1.205 | 0,33 | ||||
| 2025-07-22 | 13F | DAVENPORT & Co LLC | 14.669 | -2,82 | 428 | -4,68 | ||||
| 2025-07-24 | 13F | Us Bancorp \de\ | 920 | 0,00 | 27 | -3,70 | ||||
| 2025-09-04 | 13F/A | Advisor Group Holdings, Inc. | 137.564 | 4,27 | 4.014 | 2,27 | ||||
| 2025-08-11 | 13F | Ironsides Asset Advisors, LLC | 37.628 | -0,99 | 1.098 | -2,92 | ||||
| 2025-08-12 | 13F | Bank OZK | 7.800 | 0,00 | 228 | -2,16 | ||||
| 2025-07-07 | 13F | Global Wealth Strategies & Associates | 0 | -100,00 | 0 | |||||
| 2025-08-14 | 13F | Mariner, LLC | 21.523 | 9,23 | 628 | 7,17 | ||||
| 2025-08-04 | 13F | Joseph P. Lucia & Associates, LLC | 117.495 | -3,65 | 3.429 | -5,49 | ||||
| 2025-08-14 | 13F | Allred Capital Management, LLC | 0 | -100,00 | 0 | |||||
| 2025-07-11 | 13F | Kapstone Financial Advisors LLC | 0 | -100,00 | 0 | |||||
| 2025-07-31 | 13F | Oppenheimer & Co Inc | 34.642 | -4,02 | 1.011 | -5,87 | ||||
| 2025-07-29 | 13F | Socha Financial Group, LLC | 8.020 | -53,45 | 234 | -54,30 | ||||
| 2025-07-30 | 13F | Eqis Capital Management, Inc. | 16.522 | -1,54 | 482 | -3,41 | ||||
| 2025-07-11 | 13F | Seacrest Wealth Management, Llc | 0 | -100,00 | 0 | |||||
| 2025-08-11 | 13F | Cascade Wealth Advisors, Inc | 0 | -100,00 | 0 | |||||
| 2025-07-18 | 13F | SOA Wealth Advisors, LLC. | 4.555 | 0,20 | 133 | -2,22 | ||||
| 2025-08-18 | 13F | Geneos Wealth Management Inc. | 13.269 | -7,16 | 387 | -8,94 | ||||
| 2025-08-01 | 13F | Biltmore Family Office, LLC | 37.200 | 0,00 | 1.085 | -1,90 | ||||
| 2025-08-11 | 13F | HHM Wealth Advisors, LLC | 21.645 | 0,00 | 632 | -1,87 | ||||
| 2025-08-14 | 13F | Seven Mile Advisory | 7.000 | 0,00 | 204 | -1,92 | ||||
| 2025-04-29 | 13F | Hm Payson & Co | 0 | -100,00 | 0 | |||||
| 2025-08-13 | 13F | StoneX Group Inc. | 10.119 | 1,18 | 295 | -0,67 | ||||
| 2025-08-14 | 13F | D. E. Shaw & Co., Inc. | 0 | -100,00 | 0 | |||||
| 2025-08-18 | 13F | Front Row Advisors LLC | 550 | 0,00 | 16 | 0,00 | ||||
| 2025-07-16 | 13F/A | CX Institutional | 534 | -79,35 | 0 | |||||
| 2025-08-06 | 13F | North Capital, Inc. | 1.080 | 0,00 | 32 | -3,12 | ||||
| 2025-08-08 | 13F | Financial Gravity Companies, Inc. | 93 | -65,43 | 3 | -71,43 | ||||
| 2025-08-13 | 13F | Green Harvest Asset Management LLC | 129.776 | -1,50 | 3.787 | -3,39 | ||||
| 2025-07-30 | 13F | LGT Financial Advisors LLC | 0 | -100,00 | 0 | |||||
| 2025-08-14 | 13F | Mml Investors Services, Llc | 7.249 | -0,43 | 0 | |||||
| 2025-08-14 | 13F | Citadel Advisors Llc | 69.916 | 584,04 | 2.040 | 571,05 | ||||
| 2025-07-14 | 13F | U.S. Capital Wealth Advisors, LLC | 40.020 | 0,00 | 1.168 | -1,93 | ||||
| 2025-08-14 | 13F | Ameriprise Financial Inc | 124.805 | -12,04 | 3.642 | -13,74 | ||||
| 2025-07-11 | 13F/A | Umb Bank N A/mo | 29.000 | 0,00 | 846 | -1,86 | ||||
| 2025-08-14 | 13F | Royal Bank Of Canada | 355.421 | 2,52 | 10.371 | 0,56 | ||||
| 2025-07-25 | 13F | Cwm, Llc | 2.210 | -12,30 | 0 | |||||
| 2025-07-08 | 13F | Parallel Advisors, LLC | 190 | 0,00 | 6 | 0,00 | ||||
| 2025-07-29 | 13F | Ballast, Inc. | 117.495 | 3.429 | ||||||
| 2025-07-31 | 13F | Perissos Private Wealth Management, LLC | 12.477 | 0,02 | 364 | -1,89 | ||||
| 2025-07-14 | 13F | Occidental Asset Management, LLC | 6.898 | -6,76 | 201 | -8,64 | ||||
| 2025-08-14 | 13F | Stifel Financial Corp | 14.115 | -5,24 | 412 | -7,22 | ||||
| 2025-07-28 | 13F | Harbour Investments, Inc. | 3.412 | 0,09 | 100 | -1,98 | ||||
| 2025-05-08 | 13F | Natixis Advisors, L.p. | 0 | -100,00 | 0 | |||||
| 2025-08-05 | 13F | Huntington National Bank | 314 | -15,82 | ||||||
| 2025-08-14 | 13F | Coastal Bridge Advisors, LLC | 20.035 | -1,77 | 585 | -3,63 | ||||
| 2025-07-17 | 13F | Janney Montgomery Scott LLC | 26.847 | 0,22 | 1 |