Grundlæggende statistik
| Institutionelle aktier (lange) | 61.480.925 - 67,07% (ex 13D/G) - change of -3,67MM shares -5,63% MRQ |
| Institutionel værdi (lang) | $ 227.760 USD ($1000) |
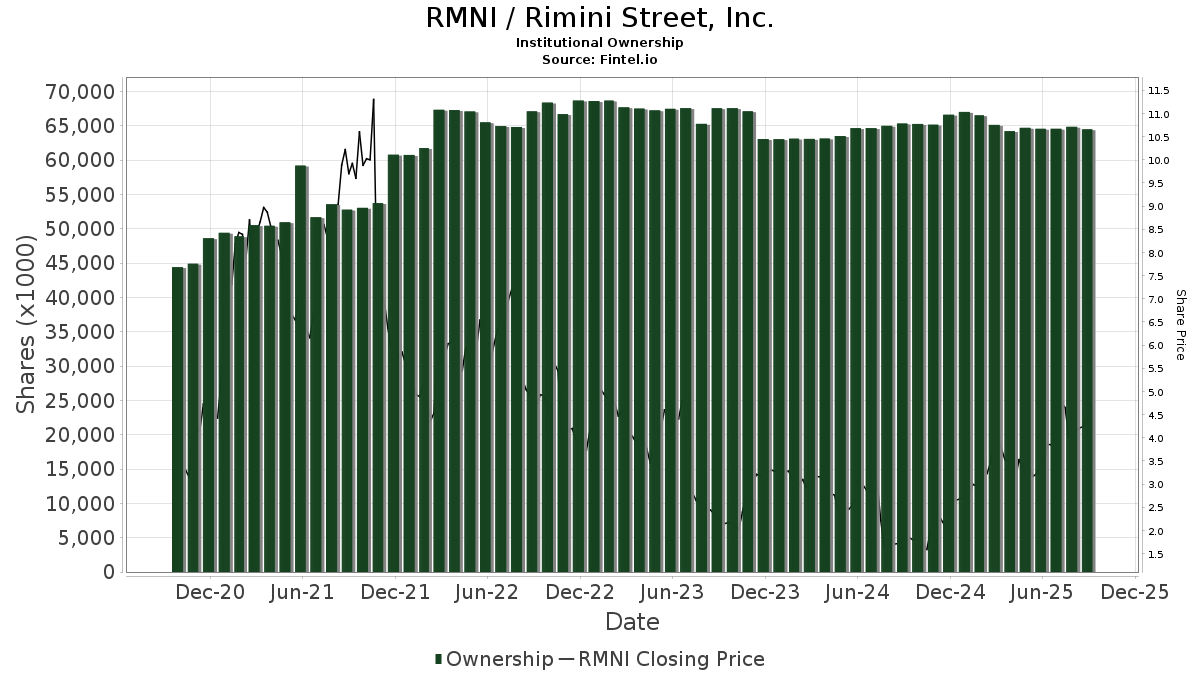
Institutionelt ejerskab og aktionærer
Rimini Street, Inc. (US:RMNI) har 130 institutionelle ejere og aktionærer, der har indsendt 13D/G- eller 13F-formularer til Securities Exchange Commission (SEC). Disse institutioner har i alt 61,480,925 aktier. Største aktionærer omfatter Adams Street Partners Llc, Conifer Management, L.L.C., Vanguard Group Inc, Brooktree Capital Management, BlackRock, Inc., Acadian Asset Management Llc, Pacific Ridge Capital Partners, LLC, Caption Management, LLC, Mink Brook Asset Management LLC, and Samjo Management, LLC .
Rimini Street, Inc. (NasdaqGM:RMNI) institutionel ejerskabsstruktur viser aktuelle positioner i virksomheden efter institutioner og fonde, samt seneste ændringer i positionsstørrelse. Større aktionærer kan omfatte individuelle investorer, investeringsforeninger, hedgefonde eller institutioner. Skema 13D angiver, at investoren besidder (eller besidder) mere end 5 % af virksomheden og har til hensigt (eller har til hensigt at) aktivt at forfølge en ændring i forretningsstrategi. Skema 13G indikerer en passiv investering på over 5%.
The share price as of March 20, 2026 is 3,10 / share. Previously, on March 21, 2025, the share price was 3,89 / share. This represents a decline of 20,18% over that period.
Fondens stemningsscore
Fund Sentiment Score (fka Ownership Accumulation Score) finder de aktier, der bliver mest købt af fonde. Det er resultatet af en sofistikeret, multi-faktor kvantitativ model, der identificerer virksomheder med de højeste niveauer af institutionel akkumulering. Scoringsmodellen bruger en kombination af den samlede stigning i oplyste ejere, ændringerne i porteføljeallokeringer i disse ejere og andre målinger. Tallet går fra 0 til 100, hvor højere tal indikerer et højere niveau af akkumulering for sine jævnaldrende, og 50 er gennemsnittet.
Opdateringsfrekvens: Dagligt
Se Ownership Explorer, som giver en liste over højest rangerende virksomheder.
AI+ Ask Fintel’s AI assistant about Rimini Street, Inc..
Select a question to share a public post with an AI-crafted answer.
Thinking of good questions…
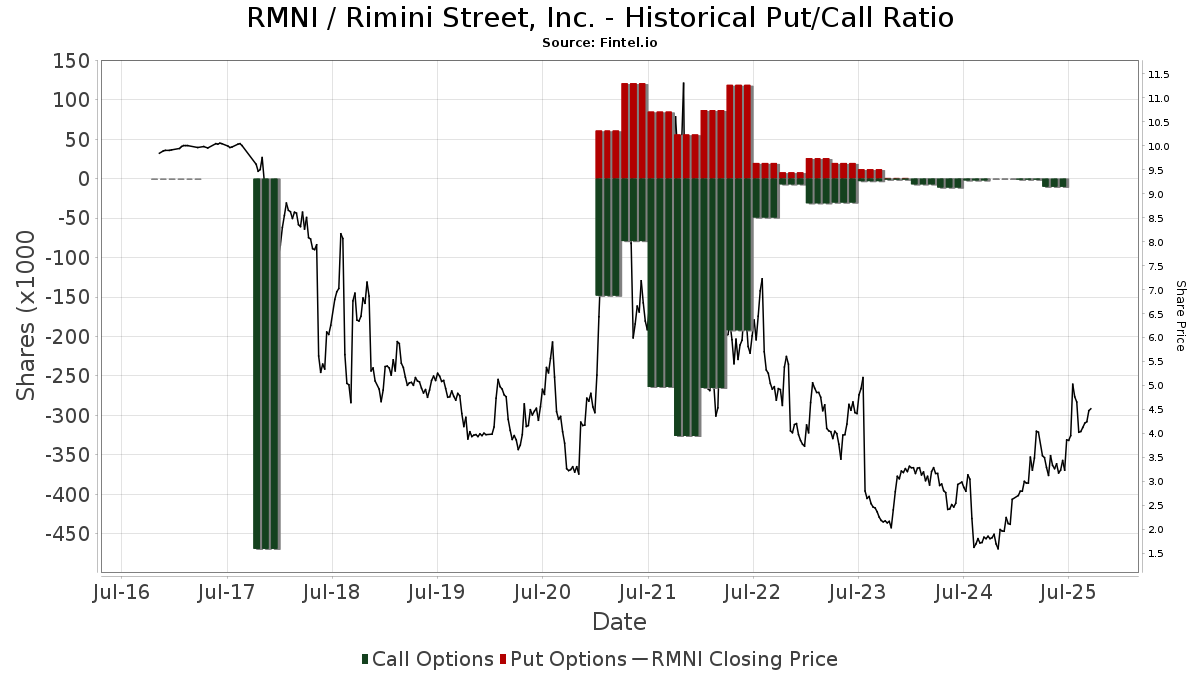
Institutionel Put/Call-forhold
Ud over at indberette standardaktie- og gældsudstedelser skal institutter med mere end 100 mill. aktiver under forvaltning også oplyse deres put- og call-optionsbeholdninger. Da salgsoptioner generelt indikerer negativ stemning, og købsoptioner indikerer positiv stemning, kan vi få en fornemmelse af den overordnede institutionelle stemning ved at plotte forholdet mellem put og kald. Diagrammet til højre viser det historiske put/call-forhold for dette instrument.
Brug af Put/Call Ratio som en indikator for investorernes stemning overvinder en af de vigtigste mangler ved at bruge totalt institutionelt ejerskab, som er, at en betydelig mængde af aktiver under forvaltning investeres passivt for at spore indekser. Passivt forvaltede fonde køber typisk ikke optioner, så indikatoren for put/call-forholdet følger mere nøje følelsen af aktivt forvaltede fonde.
13F og NPORT arkivering
Detaljer om 13F-arkivering er gratis. Detaljer om NP-ansøgninger kræver et premium-medlemskab. Grønne rækker angiver nye positioner. Røde rækker angiver lukkede positioner. Klik på linket ikon for at se den fulde transaktionshistorik.
Opgrader
for at låse premium-data op og eksportere til Excel ![]() .
.
| Fil dato | Kilde | Investor | Type | Gennemsnitlig pris (Øst) |
Aktier | Δ Aktier (%) |
Rapporteret Værdi ($1000) |
Δ Værdi (%) |
Port Alloc (%) |
|
|---|---|---|---|---|---|---|---|---|---|---|
| 2026-02-11 | 13F | CenterBook Partners LP | 0 | -100,00 | 0 | -100,00 | ||||
| 2026-02-17 | 13F | Millennium Management Llc | 70.834 | 48,97 | 275 | 23,42 | ||||
| 2026-02-17 | 13F | Royal Bank Of Canada | 2.169 | 1,45 | 8 | -20,00 | ||||
| 2025-09-26 | NP | UAPIX - Ultrasmall-cap Profund Investor Class | 540 | -0,18 | 3 | 100,00 | ||||
| 2025-10-09 | 13F | Voya Investment Management Llc | 0 | -100,00 | 0 | |||||
| 2026-01-29 | 13F | UBS Group AG | 23.959 | -87,23 | 93 | -89,52 | ||||
| 2025-11-14 | 13F | Occudo Quantitative Strategies Lp | 0 | -100,00 | 0 | |||||
| 2025-09-29 | NP | RSSL - Global X Russell 2000 ETF | 25.465 | -19,87 | 122 | 8,93 | ||||
| 2025-11-13 | 13F | Formula Growth Ltd | 0 | -100,00 | 0 | -100,00 | ||||
| 2026-02-17 | 13F | MIRAE ASSET GLOBAL ETFS HOLDINGS Ltd. | 22.680 | 2,19 | 88 | -15,53 | ||||
| 2026-02-17 | 13F | Public Employees Retirement System Of Ohio | 37.191 | 58,62 | 144 | 32,11 | ||||
| 2026-02-17 | 13F | PharVision Advisers, LLC | 0 | -100,00 | 0 | |||||
| 2026-02-05 | 13F | Amalgamated Bank | 1.533 | -16,18 | 0 | |||||
| 2026-01-20 | 13F | Harbor Capital Advisors, Inc. | 442 | 15,40 | 0 | |||||
| 2026-02-13 | 13F | BNP Paribas Asset Management Holding S.A. | 265.962 | 1 | ||||||
| 2026-02-19 | 13F | Invesco Ltd. | 22.105 | 37,24 | 86 | 13,33 | ||||
| 2025-09-26 | NP | TISBX - TIAA-CREF Small-Cap Blend Index Fund Institutional Class | 68.658 | 0,00 | 330 | 35,95 | ||||
| 2025-11-14 | 13F | Strategic Wealth Partners, Ltd. | 3.950 | -35,25 | 18 | -18,18 | ||||
| 2026-02-17 | 13F | Manatuck Hill Partners, LLC | 639.115 | 5,70 | 2.480 | -12,37 | ||||
| 2025-09-24 | NP | BLACKROCK FUNDS - iShares Total U.S. Stock Market Index Fund Investor A | 3.501 | 0,00 | 17 | 33,33 | ||||
| 2026-02-17 | 13F | Tower Research Capital LLC (TRC) | 4.980 | 78,69 | 19 | 46,15 | ||||
| 2026-02-10 | 13F | Rothschild Investment Llc | 2 | 0 | ||||||
| 2026-02-09 | 13F | Geode Capital Management, Llc | 1.153.192 | -4,19 | 4.475 | -20,57 | ||||
| 2026-01-09 | 13F | SG Americas Securities, LLC | 11.000 | 0 | ||||||
| 2026-02-17 | 13F | Northern Trust Corp | 451.478 | -5,48 | 1.752 | -21,66 | ||||
| 2026-02-13 | 13F | Squarepoint Ops LLC | 12.144 | -50,75 | 47 | -59,13 | ||||
| 2026-02-10 | 13F | Connor, Clark & Lunn Investment Management Ltd. | 451.330 | -14,09 | 1.751 | -28,76 | ||||
| 2025-11-13 | 13F | Jump Financial, LLC | 0 | -100,00 | 0 | |||||
| 2026-02-09 | 13F | Legal & General Group Plc | 4.477 | -5,13 | 17 | -22,73 | ||||
| 2025-09-25 | NP | DFAC - Dimensional U.S. Core Equity 2 ETF | 0 | -100,00 | 0 | -100,00 | ||||
| 2026-02-17 | 13F | Engine Capital Management, LP | 17.416 | 0,00 | 68 | -17,28 | ||||
| 2026-01-05 | 13F | GAMMA Investing LLC | 64 | 0 | ||||||
| 2026-01-26 | 13F | Cwm, Llc | 1.672 | 0,78 | 0 | |||||
| 2026-02-06 | 13F | Pnc Financial Services Group, Inc. | 10 | -47,37 | 0 | |||||
| 2026-02-17 | 13F | Panoramic Capital, LLC | 0 | -100,00 | 0 | |||||
| 2026-02-17 | 13F | Caption Management, LLC | 527.860 | -13,17 | 2.048 | -28,01 | ||||
| 2026-01-21 | 13F | Gerber, Llc | 17.915 | -41,73 | 70 | -51,75 | ||||
| 2026-02-17 | 13F | State Of Wisconsin Investment Board | 104.056 | 82,21 | 404 | 50,94 | ||||
| 2026-02-13 | 13F | Samjo Management, LLC | 1.207.750 | 149,02 | 4.686 | 106,52 | ||||
| 2026-02-13 | 13F | SRS Capital Advisors, Inc. | 0 | -100,00 | 0 | |||||
| 2026-02-17 | 13F | Russell Investments Group, Ltd. | 39.722 | 6,66 | 154 | -12,07 | ||||
| 2025-10-20 | 13F | Los Angeles Capital Management Llc | 0 | -100,00 | 0 | -100,00 | ||||
| 2026-02-10 | 13F | Goldman Sachs Group Inc | 194.713 | 43,93 | 755 | 19,27 | ||||
| 2025-11-14 | 13F | Graham Capital Management, L.P. | 0 | -100,00 | 0 | |||||
| 2025-11-14 | 13F | Raymond James Financial Inc | 0 | -100,00 | 0 | |||||
| 2026-02-06 | 13F | Diamond Hill Capital Management Inc | 316.013 | 8,11 | 1.226 | -10,38 | ||||
| 2026-02-12 | 13F | Jane Street Group, Llc | 174.756 | 19,62 | 678 | -0,73 | ||||
| 2025-12-02 | 13F | IFP Advisors, Inc | 0 | 0 | ||||||
| 2026-01-15 | 13F | Nisa Investment Advisors, Llc | 479 | 6,92 | 2 | -50,00 | ||||
| 2026-02-13 | 13F | Manufacturers Life Insurance Company, The | 0 | -100,00 | 0 | |||||
| 2026-02-11 | 13F | Simplex Trading, Llc | 0 | -100,00 | 0 | |||||
| 2026-02-17 | 13F | Caption Management, LLC | Put | 1.710.000 | -17,97 | 6.635 | -31,99 | |||
| 2026-02-13 | 13F | Jacobs Levy Equity Management, Inc | 298.678 | 10,74 | 1.159 | -8,24 | ||||
| 2026-02-17 | 13F | XTX Topco Ltd | 129.330 | 2,08 | 502 | -15,37 | ||||
| 2026-02-13 | 13F | Bard Associates Inc | 240.916 | -2,45 | 935 | -19,13 | ||||
| 2025-11-14 | 13F | Hrt Financial Lp | 0 | -100,00 | 0 | |||||
| 2026-02-12 | 13F | MetLife Investment Management, LLC | 16.377 | -42,79 | 64 | -52,63 | ||||
| 2025-11-14 | 13F | Point72 (DIFC) Ltd | 0 | -100,00 | 0 | |||||
| 2026-02-05 | 13F | Bessemer Group Inc | 3.384 | 0 | ||||||
| 2026-02-17 | 13F | Immersion Corp | 526.450 | 2.043 | ||||||
| 2026-02-13 | 13F | Charles Schwab Investment Management Inc | 143.671 | -0,00 | 557 | -17,11 | ||||
| 2025-09-24 | NP | SWTSX - Schwab Total Stock Market Index Fund This fund is a listed as child fund of Charles Schwab Investment Management Inc and if that institution has disclosed ownership in this security, then these positions will not be double counted when calculating total shares and total value | 21.843 | 0,00 | 105 | 35,06 | ||||
| 2026-01-29 | 13F | Vanguard Group Inc | 4.496.627 | 1,01 | 17.447 | -16,26 | ||||
| 2026-02-11 | 13F | Group One Trading, L.p. | 957 | -97,70 | 4 | -98,45 | ||||
| 2026-02-11 | 13F | Deutsche Bank Ag\ | 38.301 | 85,33 | 149 | 54,17 | ||||
| 2026-02-12 | 13F | Renaissance Technologies Llc | 299.226 | -14,26 | 1.161 | -28,97 | ||||
| 2026-02-17 | 13F | Bank Of America Corp /de/ | 39.482 | 75,28 | 153 | 45,71 | ||||
| 2026-02-12 | 13F | Advisors Asset Management, Inc. | 572 | -30,07 | 2 | -33,33 | ||||
| 2026-02-17 | 13F | Ancora Advisors, LLC | 128.687 | -50,81 | 499 | -59,23 | ||||
| 2026-02-10 | 13F | Private Wealth Asset Management, LLC | 2.800 | 0,00 | 11 | -23,08 | ||||
| 2026-02-17 | 13F | Oxford Asset Management Llp | 32.658 | 127 | ||||||
| 2025-09-29 | NP | SUNAMERICA SERIES TRUST - SA Small Cap Index Portfolio Class 1 | 6.002 | -0,51 | 29 | 33,33 | ||||
| 2026-02-11 | 13F | Cerity Partners LLC | 317.969 | -1,25 | 1.234 | -18,13 | ||||
| 2025-11-13 | 13F | Marshall Wace, Llp | 0 | -100,00 | 0 | |||||
| 2025-11-13 | 13F | Arrowstreet Capital, Limited Partnership | 0 | -100,00 | 0 | |||||
| 2026-02-13 | 13F | Verition Fund Management LLC | 14.800 | 0,00 | 57 | -17,39 | ||||
| 2026-01-20 | 13F | Signaturefd, Llc | 0 | -100,00 | 0 | |||||
| 2026-02-11 | 13F | Jpmorgan Chase & Co | 19.511 | -2,11 | 76 | -19,35 | ||||
| 2026-02-03 | 13F | SBI Securities Co., Ltd. | 1.794 | 0,90 | 7 | -25,00 | ||||
| 2026-02-13 | 13F | Rhumbline Advisers | 64.737 | -11,11 | 251 | -26,18 | ||||
| 2025-09-26 | NP | EBIT - Harbor AlphaEdge Small Cap Earners ETF | 380 | -0,26 | 2 | 0,00 | ||||
| 2025-09-26 | NP | USMIX - Extended Market Index Fund | 5.351 | 2,55 | 26 | 38,89 | ||||
| 2026-02-17 | 13F | California State Teachers Retirement System | 3.004 | -1,15 | 12 | -21,43 | ||||
| 2026-02-10 | 13F | Belvedere Trading LLC | Call | 50.000 | 0,00 | 194 | -17,09 | |||
| 2026-02-10 | 13F | Belvedere Trading LLC | 2.172 | -81,52 | 8 | -85,45 | ||||
| 2025-11-14 | 13F | Boothbay Fund Management, Llc | 0 | -100,00 | 0 | |||||
| 2025-09-26 | NP | TIEIX - TIAA-CREF Equity Index Fund Institutional Class | 38.512 | 0,00 | 185 | 36,30 | ||||
| 2026-02-12 | 13F | Round Hill Asset Management | 348.798 | -0,17 | 1.353 | -17,25 | ||||
| 2025-11-06 | 13F | Lsv Asset Management | 0 | -100,00 | 0 | |||||
| 2026-02-13 | 13F | Voss Capital, LLC | 70.000 | -72,00 | 272 | -76,84 | ||||
| 2026-02-13 | 13F | Police & Firemen's Retirement System of New Jersey | 14.868 | 0,00 | 58 | -17,39 | ||||
| 2026-02-17 | 13F | Susquehanna International Group, Llp | Put | 150.600 | 18,21 | 584 | -2,01 | |||
| 2026-02-13 | 13F | Barclays Plc | 75.893 | 10,60 | 294 | -8,41 | ||||
| 2026-02-17 | 13F | Susquehanna International Group, Llp | 155.376 | 79,62 | 603 | 49,01 | ||||
| 2025-09-29 | NP | KCXIX - Knights of Columbus U.S. All Cap Index Fund I Shares | 239 | 8,64 | 1 | |||||
| 2026-01-12 | 13F | Byrne Asset Management LLC | 66.400 | 258 | 131,53 | |||||
| 2026-02-12 | 13F | EAM Investors, LLC | 0 | -100,00 | 0 | |||||
| 2026-02-13 | 13F | Wells Fargo & Company/mn | 56.643 | 47,74 | 220 | 22,35 | ||||
| 2026-02-13 | 13F | Morgan Stanley | 391.369 | -12,98 | 1.519 | -27,85 | ||||
| 2025-11-14 | 13F | Walleye Capital LLC | 0 | -100,00 | 0 | |||||
| 2026-02-13 | 13F | Quarry LP | 0 | -100,00 | 0 | |||||
| 2026-02-17 | 13F | Optiver Holding B.V. | 896 | 0,00 | 3 | -25,00 | ||||
| 2026-02-17 | 13F | Bridgeway Capital Management Inc | 354.200 | 0,00 | 1.374 | -17,08 | ||||
| 2026-02-10 | 13F | Bnp Paribas Arbitrage, Sa | 11.108 | 11,71 | 43 | -6,52 | ||||
| 2025-09-24 | NP | PJARX - SmallCap Value Fund II R-3 | 2.386 | -23,48 | 11 | 0,00 | ||||
| 2026-02-13 | 13F | Victory Capital Management Inc | 0 | -100,00 | 0 | |||||
| 2026-02-13 | 13F | Herald Investment Management Ltd | 1.000.000 | 17,65 | 3.870 | -2,71 | ||||
| 2025-11-13 | 13F | Dynamic Technology Lab Private Ltd | 0 | -100,00 | 0 | -100,00 | ||||
| 2026-02-02 | 13F | Brooktree Capital Management | 3.836.703 | -1,56 | 14.886 | -18,38 | ||||
| 2026-02-10 | 13F | Intech Investment Management Llc | 12.930 | -22,15 | 50 | -35,06 | ||||
| 2026-02-12 | 13F | Quadrant Capital Group Llc | 0 | -100,00 | 0 | |||||
| 2025-10-14 | 13F | Exchange Traded Concepts, Llc | 0 | -100,00 | 0 | |||||
| 2026-02-10 | 13F | Bank of New York Mellon Corp | 210.736 | -27,68 | 818 | -40,06 | ||||
| 2026-02-12 | 13F | BlackRock, Inc. | 3.415.603 | -0,43 | 13.253 | -17,45 | ||||
| 2026-02-12 | 13F | Dimensional Fund Advisors Lp | 210.726 | 362,41 | 818 | 281,78 | ||||
| 2025-09-24 | NP | SWSSX - Schwab Small-Cap Index Fund This fund is a listed as child fund of Charles Schwab Investment Management Inc and if that institution has disclosed ownership in this security, then these positions will not be double counted when calculating total shares and total value | 122.559 | -4,53 | 588 | 29,80 | ||||
| 2026-02-13 | 13F | Citigroup Inc | 1.592 | -43,26 | 6 | -53,85 | ||||
| 2026-01-29 | 13F | Lee Danner & Bass Inc | 20.000 | 0,00 | 78 | -17,20 | ||||
| 2026-02-10 | 13F | Hillsdale Investment Management Inc. | 50.600 | -30,30 | 196 | -42,18 | ||||
| 2026-02-17 | 13F | Price T Rowe Associates Inc /md/ | 76.741 | 0,00 | 0 | |||||
| 2026-02-17 | 13F | Advisor Group Holdings, Inc. | 6.002 | 51,18 | 23 | 27,78 | ||||
| 2026-02-11 | 13F | Potomac Capital Management, Inc. | 83.933 | 326 | ||||||
| 2026-02-13 | 13F | Jb Capital Partners Lp | 59.193 | 0,00 | 230 | -17,33 | ||||
| 2026-02-17 | 13F | Citadel Advisors Llc | Call | 294.400 | 1.142 | |||||
| 2026-02-05 | 13F | Allworth Financial LP | 66 | 6.500,00 | 0 | |||||
| 2026-02-17 | 13F | Citadel Advisors Llc | 214.763 | 159,62 | 833 | 115,25 | ||||
| 2026-02-17 | 13F | Citadel Advisors Llc | Put | 24.400 | -14,39 | 95 | -29,32 | |||
| 2026-02-17 | 13F | Ameriprise Financial Inc | 257.170 | 8,91 | 998 | -9,77 | ||||
| 2026-02-02 | 13F | Strs Ohio | 118.200 | -2,88 | 459 | -19,51 | ||||
| 2026-02-10 | 13F | Acadian Asset Management Llc | 2.500.627 | 12,89 | 10 | -10,00 | ||||
| 2026-02-13 | 13F | DLD Asset Management, LP | Call | 192.400 | 3,27 | 746 | -14,76 | |||
| 2026-02-17 | 13F | Qube Research & Technologies Ltd | 22.425 | 87 | ||||||
| 2026-02-11 | 13F | Ameritas Investment Partners, Inc. | 3.438 | 13 | ||||||
| 2025-10-08 | 13F | Peoples Bank/KS | 0 | -100,00 | 0 | -100,00 | ||||
| 2026-02-06 | 13F | EverSource Wealth Advisors, LLC | 136 | 0,00 | 1 | |||||
| 2026-02-06 | 13F | Global Retirement Partners, LLC | 2.140 | 0,00 | 8 | -20,00 | ||||
| 2026-02-18 | 13F | GWM Advisors LLC | 918 | -55,74 | 4 | -66,67 | ||||
| 2026-02-17 | 13F | Quantinno Capital Management LP | 26.429 | -6,36 | 103 | -22,73 | ||||
| 2026-02-12 | 13F | Ruane, Cunniff & Goldfarb L.P. | 37.141 | 0,00 | 144 | -16,76 | ||||
| 2026-02-17 | 13F | nVerses Capital, LLC | 14.712 | 57 | ||||||
| 2025-11-14 | 13F | AXA Investment Managers S.A. | 285.445 | 1.336 | ||||||
| 2026-02-13 | 13F | Adams Street Partners Llc | 23.565.433 | 0,00 | 91.434 | -17,09 | ||||
| 2026-01-30 | 13F | NJ State Employees Deferred Compensation Plan | 0 | -100,00 | 0 | |||||
| 2026-02-17 | 13F | Fmr Llc | 1.922 | -10,02 | 7 | -22,22 | ||||
| 2025-09-25 | NP | DCOR - Dimensional US Core Equity 1 ETF | 0 | -100,00 | 0 | |||||
| 2026-02-12 | 13F | New York State Common Retirement Fund | 9.177 | 0,00 | 36 | -16,67 | ||||
| 2025-11-06 | 13F | ProShare Advisors LLC | 0 | -100,00 | 0 | |||||
| 2026-02-17 | 13F | Alliancebernstein L.p. | 73.390 | 0,00 | 285 | -17,20 | ||||
| 2025-09-24 | NP | PPNMX - SmallCap Growth Fund I R-3 | 607 | 0,00 | 3 | 0,00 | ||||
| 2026-02-17 | 13F | Two Sigma Investments, Lp | 107.588 | -59,44 | 417 | -66,40 | ||||
| 2026-01-27 | 13F | Financial Management Professionals, Inc. | 5.732 | 0,00 | 22 | -15,38 | ||||
| 2026-02-13 | 13F | Boston Partners | 426.074 | -1,91 | 1.653 | -18,65 | ||||
| 2025-11-14 | 13F | Axa S.a. | 0 | -100,00 | 0 | |||||
| 2026-02-12 | 13F | Federated Hermes, Inc. | 0 | -100,00 | 0 | |||||
| 2026-02-17 | 13F | Two Sigma Advisers, Lp | 0 | -100,00 | 0 | |||||
| 2026-02-19 | 13F | CI Private Wealth, LLC | 135.156 | -14,04 | 524 | -28,71 | ||||
| 2025-11-14 | 13F | Cubist Systematic Strategies, LLC | 0 | -100,00 | 0 | |||||
| 2025-09-24 | NP | BLACKROCK FUNDS - iShares Russell Small/Mid-Cap Index Fund Investor A | 8.507 | -25,94 | 41 | 0,00 | ||||
| 2025-09-26 | NP | PCSGX - PACE Small/Medium Co Growth Equity Investments Class P | 6.215 | 28,75 | 30 | 141,67 | ||||
| 2026-02-13 | 13F | Prudential Financial Inc | 0 | -100,00 | 0 | |||||
| 2025-09-26 | NP | FSSNX - Fidelity Small Cap Index Fund This fund is a listed as child fund of Fmr Llc and if that institution has disclosed ownership in this security, then these positions will not be double counted when calculating total shares and total value | 490.902 | -9,02 | 2.356 | 23,74 | ||||
| 2026-02-12 | 13F | Nuveen, LLC | 111.012 | 0,00 | 431 | -17,15 | ||||
| 2026-02-13 | 13F | Sei Investments Co | 42.080 | 0,00 | 163 | -16,84 | ||||
| 2026-02-13 | 13F | Sterling Capital Management LLC | 2.386 | -15,12 | 9 | -30,77 | ||||
| 2025-11-13 | 13F | Quadrature Capital Ltd | 0 | -100,00 | 0 | -100,00 | ||||
| 2025-11-07 | 13F | Gsa Capital Partners Llp | 0 | -100,00 | 0 | |||||
| 2026-02-09 | 13F | Hantz Financial Services, Inc. | 245 | 0,00 | 0 | |||||
| 2026-02-17 | 13F | Susquehanna International Group, Llp | Call | 0 | -100,00 | 0 | ||||
| 2026-02-12 | 13F | Conifer Management, L.L.C. | 5.913.199 | 0,00 | 22.943 | -17,09 | ||||
| 2026-02-13 | 13F | State Street Corp | 1.055.183 | 0,06 | 4.094 | -17,04 | ||||
| 2026-01-08 | 13F | Adirondack Trust Co | 1.565 | 0,00 | 6 | -14,29 | ||||
| 2026-02-12 | 13F | Adviser Investments LLC | 32.159 | 0,00 | 125 | -17,33 | ||||
| 2026-02-13 | 13F | Mink Brook Asset Management LLC | 1.299.741 | 73,40 | 5.043 | 43,73 | ||||
| 2025-09-26 | NP | SLPIX - Small-cap Profund Investor Class | 44 | -15,38 | 0 | |||||
| 2026-02-04 | 13F | Pacific Ridge Capital Partners, LLC | 1.857.512 | 9,40 | 7.207 | -9,29 | ||||
| 2026-02-17 | 13F | Aqr Capital Management Llc | 69.980 | 95,16 | 272 | 62,28 |
Other Listings
| DE:0QH | 2,80 € |