Grundlæggende statistik
| Institutionelle ejere | 145 total, 145 long only, 0 short only, 0 long/short - change of 18,85% MRQ |
| Gennemsnitlig porteføljeallokering | 1.1384 % - change of 5,83% MRQ |
| Institutionelle aktier (lange) | 64.541.664 (ex 13D/G) - change of 11,19MM shares 20,97% MRQ |
| Institutionel værdi (lang) | $ 2.469.424 USD ($1000) |
Institutionelt ejerskab og aktionærer
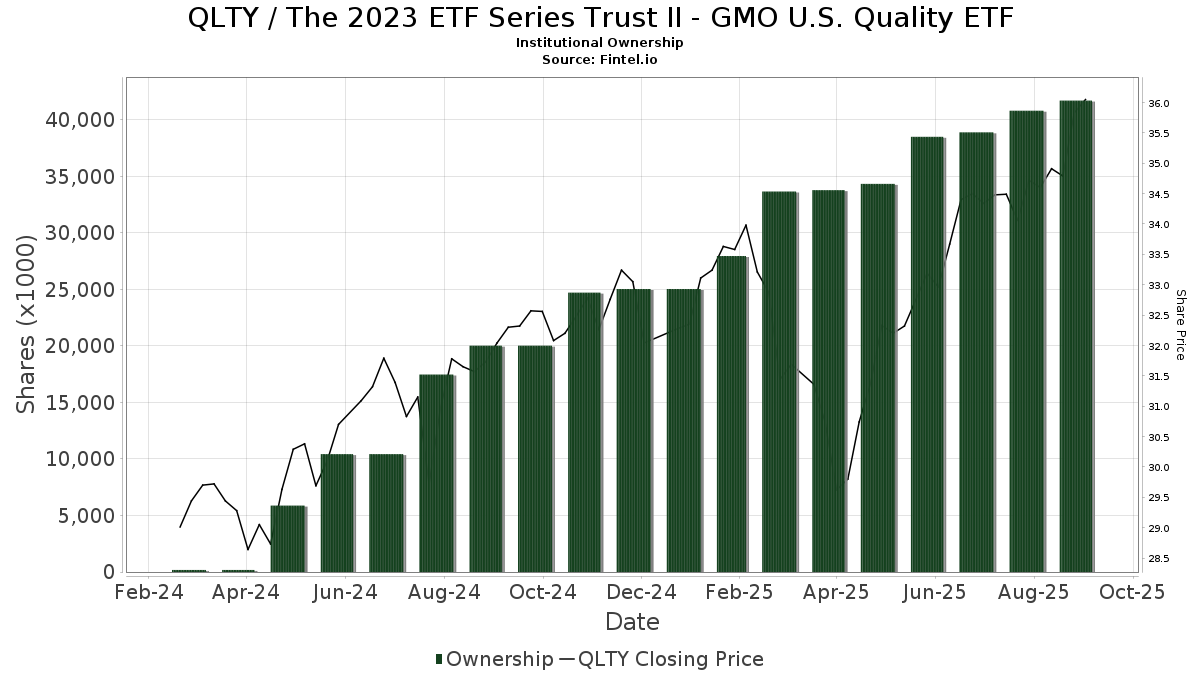
The 2023 ETF Series Trust II - GMO U.S. Quality ETF (US:QLTY) har 145 institutionelle ejere og aktionærer, der har indsendt 13D/G- eller 13F-formularer til Securities Exchange Commission (SEC). Disse institutioner har i alt 64,541,664 aktier. Største aktionærer omfatter AIA Group Ltd, Allworth Financial LP, Merit Financial Group, LLC, Legacy Advisors, LLC, Lazard Asset Management Llc, Brown Brothers Harriman & Co, Colony Group, LLC, Perigon Wealth Management, LLC, Gitterman Wealth Management, LLC, and Fft Wealth Management Llc .
The 2023 ETF Series Trust II - GMO U.S. Quality ETF (ARCA:QLTY) institutionel ejerskabsstruktur viser aktuelle positioner i virksomheden efter institutioner og fonde, samt seneste ændringer i positionsstørrelse. Større aktionærer kan omfatte individuelle investorer, investeringsforeninger, hedgefonde eller institutioner. Skema 13D angiver, at investoren besidder (eller besidder) mere end 5 % af virksomheden og har til hensigt (eller har til hensigt at) aktivt at forfølge en ændring i forretningsstrategi. Skema 13G indikerer en passiv investering på over 5%.
The share price as of March 31, 2026 is 36,18 / share. Previously, on April 1, 2025, the share price was 31,22 / share. This represents an increase of 15,89% over that period.
Fondens stemningsscore
Fund Sentiment Score (fka Ownership Accumulation Score) finder de aktier, der bliver mest købt af fonde. Det er resultatet af en sofistikeret, multi-faktor kvantitativ model, der identificerer virksomheder med de højeste niveauer af institutionel akkumulering. Scoringsmodellen bruger en kombination af den samlede stigning i oplyste ejere, ændringerne i porteføljeallokeringer i disse ejere og andre målinger. Tallet går fra 0 til 100, hvor højere tal indikerer et højere niveau af akkumulering for sine jævnaldrende, og 50 er gennemsnittet.
Opdateringsfrekvens: Dagligt
Se Ownership Explorer, som giver en liste over højest rangerende virksomheder.
AI+ Ask Fintel’s AI assistant about The 2023 ETF Series Trust II - GMO U.S. Quality ETF.
Select a question to share a public post with an AI-crafted answer.
Thinking of good questions…
Institutionel Put/Call-forhold
Ud over at indberette standardaktie- og gældsudstedelser skal institutter med mere end 100 mill. aktiver under forvaltning også oplyse deres put- og call-optionsbeholdninger. Da salgsoptioner generelt indikerer negativ stemning, og købsoptioner indikerer positiv stemning, kan vi få en fornemmelse af den overordnede institutionelle stemning ved at plotte forholdet mellem put og kald. Diagrammet til højre viser det historiske put/call-forhold for dette instrument.
Brug af Put/Call Ratio som en indikator for investorernes stemning overvinder en af de vigtigste mangler ved at bruge totalt institutionelt ejerskab, som er, at en betydelig mængde af aktiver under forvaltning investeres passivt for at spore indekser. Passivt forvaltede fonde køber typisk ikke optioner, så indikatoren for put/call-forholdet følger mere nøje følelsen af aktivt forvaltede fonde.
13F og NPORT arkivering
Detaljer om 13F-arkivering er gratis. Detaljer om NP-ansøgninger kræver et premium-medlemskab. Grønne rækker angiver nye positioner. Røde rækker angiver lukkede positioner. Klik på linket ikon for at se den fulde transaktionshistorik.
Opgrader
for at låse premium-data op og eksportere til Excel ![]() .
.
| Fil dato | Kilde | Investor | Type | Gennemsnitlig pris (Øst) |
Aktier | Δ Aktier (%) |
Rapporteret Værdi ($1000) |
Δ Værdi (%) |
Port Alloc (%) |
|
|---|---|---|---|---|---|---|---|---|---|---|
| 2026-01-26 | 13F | Cwm, Llc | 1.567 | 0,77 | 0 | |||||
| 2026-01-27 | 13F | Legacy Advisors, LLC | 3.493.784 | 11,06 | 134.371 | 17,77 | ||||
| 2026-02-17 | 13F | Ancora Advisors, LLC | 695 | 0,00 | 27 | 4,00 | ||||
| 2026-02-13 | 13F | Atlas Capital Advisors Llc | 0 | -100,00 | 0 | |||||
| 2026-01-27 | 13F | Wealth Enhancement Trust Services, Inc. | 14.216 | 547 | ||||||
| 2026-02-06 | 13F | Aspen Investment Management Inc | 26.590 | 1 | ||||||
| 2026-02-11 | 13F | Jpmorgan Chase & Co | 185.861 | 16,57 | 7.148 | 23,88 | ||||
| 2026-02-06 | 13F | IFP Advisors, Inc | 142 | 0,00 | 5 | 0,00 | ||||
| 2026-02-17 | 13F | Grantham, Mayo, Van Otterloo & Co. LLC | 49.728 | 1.913 | ||||||
| 2026-02-05 | 13F | Edge Financial Advisors LLC | 0 | -100,00 | 0 | |||||
| 2026-01-30 | 13F | Us Bancorp \de\ | 245 | 9 | ||||||
| 2025-11-12 | 13F | Accredited Wealth Management, LLC | 3.898 | -95,51 | 3.586 | 20,54 | ||||
| 2026-02-10 | 13F | Eq Llc | 56.905 | 28,08 | 2.189 | 36,15 | ||||
| 2026-02-02 | 13F | CENTRAL TRUST Co | 605.050 | 34,41 | 23.270 | 42,84 | ||||
| 2026-02-11 | 13F | MCF Advisors LLC | 105.026 | 4.039 | ||||||
| 2026-02-11 | 13F | Capital Analysts, Inc. | 895 | 0 | ||||||
| 2026-02-17 | 13F | Royal Bank Of Canada | 462 | 0,00 | 18 | 12,50 | ||||
| 2026-02-03 | 13F | Coston, McIsaac & Partners | 7 | 0,00 | 0 | |||||
| 2026-01-26 | 13F | Merit Financial Group, LLC | 7.494.580 | 6,70 | 288.242 | 13,39 | ||||
| 2026-01-28 | 13F | Geneos Wealth Management Inc. | 741 | 0,14 | 29 | 7,69 | ||||
| 2026-01-09 | 13F | Breakwater Capital Group | 12.881 | -0,62 | 495 | 5,54 | ||||
| 2026-01-14 | 13F | Trustees of Dartmouth College | 1.096.022 | 0,00 | 42.153 | 6,27 | ||||
| 2026-01-08 | 13F | Gryphon Financial Partners LLC | 15.999 | 0,43 | 615 | 6,77 | ||||
| 2026-01-14 | 13F | Exchange Traded Concepts, Llc | 78.591 | 2,03 | 3.023 | 8,43 | ||||
| 2026-01-14 | 13F | Pathway Financial Advisors LLC | 28.743 | -0,33 | 1.141 | 9,40 | ||||
| 2026-01-09 | 13F | Dynamic Advisor Solutions LLC | 0 | -100,00 | 0 | |||||
| 2026-02-12 | 13F | Brown Brothers Harriman & Co | 2.240.706 | 138,07 | 86.178 | 153,00 | ||||
| 2025-11-13 | 13F | Quadrature Capital Ltd | 0 | -100,00 | 0 | |||||
| 2026-02-10 | 13F | Heritage Trust Co | 160.089 | 52,46 | 6.157 | 62,03 | ||||
| 2025-11-14 | 13F | Comerica Bank | 0 | -100,00 | 0 | |||||
| 2026-02-02 | 13F | Mutual Advisors, LLC | 85.381 | 91,65 | 3.284 | 97,30 | ||||
| 2026-02-13 | 13F | Morgan Stanley | 7.122 | 0,01 | 274 | 6,23 | ||||
| 2026-01-28 | 13F | Wingate Wealth Advisors, Inc. | 73.835 | 4,89 | 2.840 | 11,46 | ||||
| 2026-02-12 | 13F | Jane Street Group, Llc | 25.680 | 988 | ||||||
| 2026-01-26 | 13F | Kelman-Lazarov, Inc. | 365.857 | 0,53 | 14.071 | 6,83 | ||||
| 2026-02-13 | 13F | Mml Investors Services, Llc | 697.527 | 5,24 | 26.827 | 11,84 | ||||
| 2026-02-06 | 13F | EverSource Wealth Advisors, LLC | 3.550 | 137 | ||||||
| 2026-02-17 | 13F | Modern Wealth Management, LLC | 8.626 | 43,10 | 332 | 51,83 | ||||
| 2026-01-20 | 13F | Princeton Global Asset Management LLC | 93.288 | -4,31 | 3.588 | 1,67 | ||||
| 2026-02-13 | 13F | Wells Fargo & Company/mn | 479 | 1.230,56 | 18 | 1.700,00 | ||||
| 2026-02-04 | 13F | Madison Asset Management, LLC | 183.547 | 782,99 | 7.059 | 838,70 | ||||
| 2026-02-04 | 13F | Certior Financial Group, Llc | 36.790 | 1,40 | 1.415 | 7,69 | ||||
| 2026-01-09 | 13F | Diversified Trust Co | 207.388 | 1,81 | 7.976 | 8,19 | ||||
| 2026-01-23 | 13F | Lam Group, Inc. | 22.930 | 16,81 | 882 | 24,08 | ||||
| 2026-02-17 | 13F | Susquehanna International Group, Llp | 19.232 | 213,53 | 740 | 234,39 | ||||
| 2026-01-26 | 13F | AE Wealth Management LLC | 6.462 | 249 | ||||||
| 2026-02-02 | 13F | Allegheny Financial Group LTD | 244.177 | 100,89 | 9.391 | 113,53 | ||||
| 2026-02-17 | 13F | Hollow Brook Wealth Management LLC | 62.975 | 6,40 | 2.422 | 13,07 | ||||
| 2025-10-10 | 13F | Kathleen S. Wright Associates Inc. | 3.823 | 87,86 | 138 | 100,00 | ||||
| 2026-01-05 | 13F | GAMMA Investing LLC | 37 | 0,00 | 1 | 0,00 | ||||
| 2026-02-09 | 13F | Harbour Investments, Inc. | 666 | 0,00 | 26 | 4,17 | ||||
| 2026-01-07 | 13F | Procyon Private Wealth Partners, LLC | 87.908 | 3.381 | ||||||
| 2026-02-12 | 13F | StoneX Group Inc. | 42.589 | -7,65 | 1.638 | -2,09 | ||||
| 2026-01-29 | 13F | Sanctuary Advisors, LLC | 0 | -100,00 | 0 | -100,00 | ||||
| 2026-01-22 | 13F | Colony Family Offices, LLC | 451.353 | 9,35 | 17.359 | 15,96 | ||||
| 2026-02-09 | 13F | AIA Group Ltd | 13.783.350 | 0,00 | 530.108 | 6,27 | ||||
| 2026-02-13 | 13F | Botty Investors LLC | 199.000 | 0,00 | 7.654 | 6,04 | ||||
| 2026-02-17 | 13F | Wiley Bros.-aintree Capital, Llc | 263.173 | -2,51 | 10.123 | 4,04 | ||||
| 2026-02-13 | 13F | National Bank Of Canada /fi/ | 566 | 22 | ||||||
| 2026-02-05 | 13F | Allworth Financial LP | 8.286.148 | 0,24 | 318.685 | 6,53 | ||||
| 2026-01-21 | 13F | Kfg Wealth Management, Llc | 11.441 | -0,62 | 440 | 5,77 | ||||
| 2026-01-14 | 13F | Verum Partners LLC | 423.125 | 4,14 | 16.273 | 10,67 | ||||
| 2026-02-10 | 13F | CIBC World Markets Inc. | 34.725 | 6,09 | 1.336 | 12,75 | ||||
| 2026-01-08 | 13F | Wealth Enhancement Advisory Services, Llc | 760.417 | 512,74 | 30.189 | 561,87 | ||||
| 2026-02-03 | 13F | Indivisible Partners | 98.863 | 3.802 | ||||||
| 2026-02-05 | 13F | Pinnacle Associates Ltd | 838.255 | 0,39 | 32.239 | 6,68 | ||||
| 2026-01-23 | 13F | TFC Financial Management | 1.850 | 0,00 | 71 | 7,58 | ||||
| 2026-02-17 | 13F | Aqr Capital Management Llc | 11.758 | 452 | ||||||
| 2026-02-10 | 13F | Envestnet Asset Management Inc | 322.388 | 5,52 | 12.399 | 12,15 | ||||
| 2026-02-10 | 13F | Principia Wealth Advisory, LLC | 4.627 | -8,39 | 178 | -2,75 | ||||
| 2026-02-05 | 13F | Atria Investments Llc | 185.715 | 7.143 | ||||||
| 2026-02-13 | 13F | MAI Capital Management | 46.702 | 51,33 | 1.796 | 60,93 | ||||
| 2026-02-12 | 13F | Moneta Group Investment Advisors Llc | 127.267 | 187,39 | 4.895 | 205,49 | ||||
| 2026-02-10 | 13F | Argent Trust Co | 122.434 | 18,20 | 4.709 | 25,61 | ||||
| 2026-01-27 | 13F | Benedict Financial Advisors Inc | 8.495 | 33,25 | 327 | 41,74 | ||||
| 2026-02-13 | 13F | Colony Group, LLC | 1.886.749 | 65,78 | 72.564 | 76,17 | ||||
| 2026-02-13 | 13F | Clarity Asset Management, Inc. | 942 | 36 | ||||||
| 2026-01-22 | 13F | Paragon Capital Management Ltd | 389.124 | 4,24 | 14.966 | 10,78 | ||||
| 2026-01-07 | 13F | Northside Capital Management, LLC | 15.680 | 0,00 | 603 | 6,35 | ||||
| 2026-01-06 | 13F | Chemistry Wealth Management LLC | 10.022 | 0,00 | 385 | 6,35 | ||||
| 2026-02-17 | 13F | Raymond James Financial Inc | 713.028 | 6,35 | 27.423 | 13,02 | ||||
| 2026-02-17 | 13F | Lazard Asset Management Llc | 2.501.269 | 65,11 | 96.199 | 287,06 | ||||
| 2026-02-17 | 13F | Advisor Group Holdings, Inc. | 14.625 | 21,52 | 563 | 32,24 | ||||
| 2026-02-02 | 13F | Fifth Third Bancorp | 0 | -100,00 | 0 | |||||
| 2026-02-11 | 13F | Parallel Advisors, LLC | 26.775 | -10,57 | 1.030 | -4,99 | ||||
| 2026-01-08 | 13F | Sprinkle Financial Consultants LLC | 79.004 | 8,60 | 3.038 | 15,43 | ||||
| 2026-02-17 | 13F | Advisory Services Network, LLC | 0 | -100,00 | 0 | |||||
| 2026-02-09 | 13F | Prospera Financial Services Inc | 33.700 | 9,77 | 1.296 | 16,65 | ||||
| 2026-01-22 | 13F | Vicus Capital | 25.948 | 172,19 | 998 | 188,99 | ||||
| 2026-02-17 | 13F | Bank Of America Corp /de/ | 0 | -100,00 | 0 | |||||
| 2026-02-11 | 13F | LPL Financial LLC | 606.175 | 255,40 | 23.313 | 277,72 | ||||
| 2026-02-17 | 13F | D. E. Shaw & Co., Inc. | 0 | -100,00 | 0 | |||||
| 2026-02-13 | 13F | Kestra Advisory Services, LLC | 8.398 | 323 | ||||||
| 2026-02-06 | 13F | Quantify Chaos Advisors, Llc | 16.991 | 653 | ||||||
| 2026-02-10 | 13F | Prodigy Asset Management LLC | 644.454 | 534,38 | 24.786 | 574,24 | ||||
| 2025-10-24 | 13F | Aspiriant, Llc | 0 | -100,00 | 0 | |||||
| 2026-02-11 | 13F | Cerity Partners LLC | 5.497 | 211 | ||||||
| 2026-02-03 | 13F | Crestwood Advisors Group LLC | 1.381.300 | 18,26 | 53.125 | 25,68 | ||||
| 2026-02-11 | 13F | Dorsey & Whitney Trust CO LLC | 8.101 | 0,00 | 312 | 6,14 | ||||
| 2025-11-04 | 13F | Gitterman Wealth Management, LLC | 1.623.342 | -0,10 | 58.749 | 5,53 | ||||
| 2026-02-26 | 13F | TD Capital Management LLC | 122 | 5 | ||||||
| 2026-01-12 | 13F | Archer Investment Management, LLC | 159.614 | -30,18 | 6.139 | -25,81 | ||||
| 2026-02-06 | 13F | Auxano Advisors, LLC | 611.016 | 4,10 | 23.500 | 10,64 | ||||
| 2026-01-21 | 13F | Flagship Harbor Advisors, Llc | 3.559 | 137 | ||||||
| 2026-02-13 | 13F/A | New England Private Wealth Advisors LLC | 186.025 | 1,09 | 7.155 | 7,43 | ||||
| 2026-02-13 | 13F | Alvarez & Marsal Private Wealth Partners, LLC | 951.420 | 36.592 | ||||||
| 2026-01-26 | 13F | Private Trust Co Na | 4.000 | 154 | ||||||
| 2026-01-29 | 13F | UBS Group AG | 7.544 | 13,60 | 290 | 20,83 | ||||
| 2026-02-13 | 13F | Arete Wealth Advisors, LLC | 38.690 | -14,70 | 1 | 0,00 | ||||
| 2026-02-09 | 13F | Fft Wealth Management Llc | 1.587.405 | 7,49 | 61.137 | 14,15 | ||||
| 2026-02-17 | 13F | First Manhattan Co | 200.937 | 7.728 | ||||||
| 2026-01-13 | 13F | Triangle Securities Wealth Management | 117.730 | 86,91 | 4.528 | 98,64 | ||||
| 2026-01-27 | 13F | Leisure Capital Management | 243.443 | -0,23 | 9.363 | 6,02 | ||||
| 2026-02-13 | 13F | J. Mark Nickell & Co. | 206.421 | 7.939 | ||||||
| 2026-01-26 | 13F | Berkeley, Inc | 37.739 | 24,91 | 1.451 | 32,75 | ||||
| 2026-02-17 | 13F | Private Advisor Group, LLC | 9.793 | 2,62 | 377 | 8,99 | ||||
| 2026-02-03 | 13F | Harel Insurance Investments & Financial Services Ltd. | 10.500 | -25,00 | 0 | |||||
| 2026-02-05 | 13F | Peak Asset Management, LLC | 53.957 | 236,10 | 2.075 | 257,76 | ||||
| 2026-02-05 | 13F | Clarendon Private LLC | 38.440 | 68,65 | 1.478 | 79,37 | ||||
| 2026-01-26 | 13F | Annex Advisory Services, LLC | 810.984 | 12,01 | 31.190 | 19,04 | ||||
| 2026-02-12 | 13F | Commonwealth Equity Services, Llc | 137.674 | 6,51 | 5.295 | 132.250,00 | ||||
| 2026-01-16 | 13F | Tempus Wealth Planning, LLC | 137.250 | 5,37 | 5.279 | 11,99 | ||||
| 2026-02-05 | 13F | Cambridge Investment Research Advisors, Inc. | 14.308 | 1 | ||||||
| 2026-03-31 | 13F | Sankala Group LLC | 752 | 83,41 | 27 | 73,33 | ||||
| 2026-01-23 | 13F | Assetmark, Inc | 277 | 28,84 | 11 | 42,86 | ||||
| 2026-01-13 | 13F | Stonehearth Capital Management, LLC | 420.793 | 4,90 | 16.184 | 11,48 | ||||
| 2026-02-10 | 13F/A | Northwestern Mutual Wealth Management Co | 10.670 | 81,71 | 410 | 93,40 | ||||
| 2026-01-30 | 13F | Joel Isaacson & Co., LLC | 7.781 | 0,34 | 299 | 6,79 | ||||
| 2026-02-17 | 13F | Jones Financial Companies Lllp | 57.109 | 313,14 | 2.196 | 341,85 | ||||
| 2026-02-06 | 13F | HighTower Advisors, LLC | 123.047 | 3,75 | 4.732 | 10,25 | ||||
| 2026-02-10 | 13F | Essex Financial Services, Inc. | 8.877 | 0,00 | 341 | 6,23 | ||||
| 2026-02-20 | 13F | Sunbelt Securities, Inc. | 6.515 | 0,03 | 251 | 6,38 | ||||
| 2026-02-10 | 13F | New Republic Capital, LLC | 411.333 | 22,80 | 15.827 | 30,28 | ||||
| 2026-02-18 | 13F | GWM Advisors LLC | 6.569 | 9,17 | 253 | 16,13 | ||||
| 2026-01-13 | 13F | Stonehage Fleming Financial Services Holdings Ltd | 110.569 | 8,58 | 4.252 | 15,39 | ||||
| 2026-01-28 | 13F | HB Wealth Management, LLC | 500.906 | 8,36 | 19.265 | 15,16 | ||||
| 2026-02-18 | 13F | Crusonia Wealth Advisors LLC | 373.373 | 14.360 | ||||||
| 2026-02-13 | 13F | Heron Bay Capital Management | 7.418 | -24,86 | 285 | -20,17 | ||||
| 2026-01-16 | 13F | Perigon Wealth Management, LLC | 1.652.954 | 63.573 | ||||||
| 2026-02-12 | 13F | Alpha Advisors, LLC/VA | 308.547 | 0,45 | 11.867 | 6,75 | ||||
| 2026-02-12 | 13F | Principal Securities, Inc. | 0 | -100,00 | 0 | -100,00 | ||||
| 2026-01-07 | 13F | Innova Wealth Partners | 8.048 | 310 | ||||||
| 2026-02-11 | 13F | SOUTH STATE Corp | 105.572 | 6,88 | 4.060 | 13,60 | ||||
| 2026-02-11 | 13F | Janney Montgomery Scott LLC | 71.683 | -6,53 | 3 | 0,00 | ||||
| 2026-02-10 | 13F | Lido Advisors, LLC | 21.200 | 0,00 | 769 | 0,00 | ||||
| 2026-01-23 | 13F | Farther Finance Advisors, LLC | 64.064 | 1,82 | 2.464 | 8,22 | ||||
| 2026-02-02 | 13F | Truist Financial Corp | 6.728 | -17,73 | 259 | -12,54 | ||||
| 2026-02-09 | 13F | Studio Investment Management Llc | 30.856 | -2,08 | 1.187 | 3,85 | ||||
| 2026-01-23 | 13F | Financial Connections Group, Inc. | 185.946 | -2,33 | 7 | 16,67 | ||||
| 2026-02-10 | 13F | Bank of New York Mellon Corp | 68.066 | 2.618 | ||||||
| 2026-02-19 | 13F | CI Private Wealth, LLC | 167.067 | 40,09 | 6.336 | 46,75 | ||||
| 2026-02-13 | 13F | Global Endowment Management, LP | 16.000 | 0,00 | 615 | 6,22 | ||||
| 2026-02-10 | 13F | Hazlett, Burt & Watson, Inc. | 274 | 0,00 | 0 | |||||
| 2026-02-06 | 13F | Global Retirement Partners, LLC | 47.993 | 34,13 | 1.846 | 42,58 | ||||
| 2026-02-13 | 13F | Islay Capital Management, Llc | 325 | 12 | ||||||
| 2026-02-09 | 13F | Lgl Partners, Llc | 191.709 | 0,81 | 7.386 | 7,09 | ||||
| 2026-02-13 | 13F | Acumen Wealth Advisors, LLC | 54.004 | 2.077 |