Grundlæggende statistik
| Institutionelle ejere | 130 total, 130 long only, 0 short only, 0 long/short - change of 15,04% MRQ |
| Gennemsnitlig porteføljeallokering | 0.8402 % - change of 2,93% MRQ |
| Institutionelle aktier (lange) | 27.631.706 (ex 13D/G) - change of 0,96MM shares 3,61% MRQ |
| Institutionel værdi (lang) | $ 1.607.168 USD ($1000) |
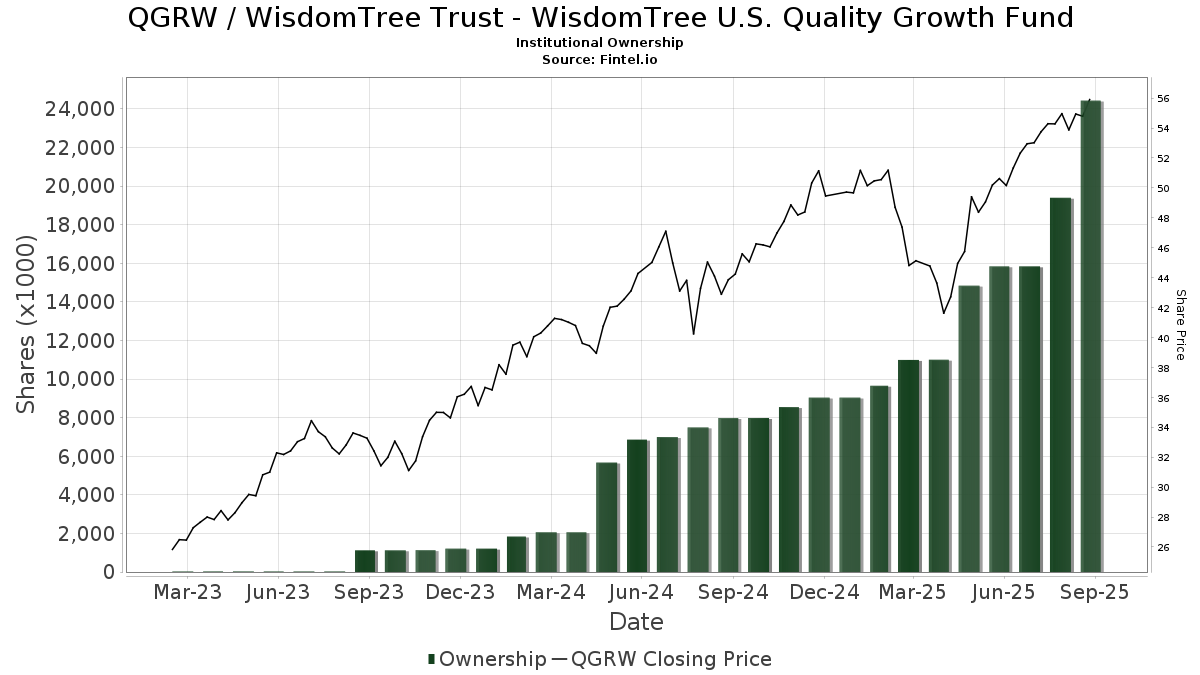
Institutionelt ejerskab og aktionærer
WisdomTree Trust - WisdomTree U.S. Quality Growth Fund (US:QGRW) har 130 institutionelle ejere og aktionærer, der har indsendt 13D/G- eller 13F-formularer til Securities Exchange Commission (SEC). Disse institutioner har i alt 27,631,706 aktier. Største aktionærer omfatter Retirement Planning Group, HighTower Advisors, LLC, LPL Financial LLC, Trust Point Inc., Morgan Stanley, Bank Of America Corp /de/, Private Advisor Group, LLC, RVW Wealth, LLC, Empirical Financial Services, LLC d.b.a. Empirical Wealth Management, and Horizon Wealth Management, LLC .
WisdomTree Trust - WisdomTree U.S. Quality Growth Fund (ARCA:QGRW) institutionel ejerskabsstruktur viser aktuelle positioner i virksomheden efter institutioner og fonde, samt seneste ændringer i positionsstørrelse. Større aktionærer kan omfatte individuelle investorer, investeringsforeninger, hedgefonde eller institutioner. Skema 13D angiver, at investoren besidder (eller besidder) mere end 5 % af virksomheden og har til hensigt (eller har til hensigt at) aktivt at forfølge en ændring i forretningsstrategi. Skema 13G indikerer en passiv investering på over 5%.
The share price as of March 6, 2026 is 55,98 / share. Previously, on March 10, 2025, the share price was 44,17 / share. This represents an increase of 26,74% over that period.
Fondens stemningsscore
Fund Sentiment Score (fka Ownership Accumulation Score) finder de aktier, der bliver mest købt af fonde. Det er resultatet af en sofistikeret, multi-faktor kvantitativ model, der identificerer virksomheder med de højeste niveauer af institutionel akkumulering. Scoringsmodellen bruger en kombination af den samlede stigning i oplyste ejere, ændringerne i porteføljeallokeringer i disse ejere og andre målinger. Tallet går fra 0 til 100, hvor højere tal indikerer et højere niveau af akkumulering for sine jævnaldrende, og 50 er gennemsnittet.
Opdateringsfrekvens: Dagligt
Se Ownership Explorer, som giver en liste over højest rangerende virksomheder.
AI+ Ask Fintel’s AI assistant about WisdomTree Trust - WisdomTree U.S. Quality Growth Fund.
Select a question to share a public post with an AI-crafted answer.
Thinking of good questions…
Institutionel Put/Call-forhold
Ud over at indberette standardaktie- og gældsudstedelser skal institutter med mere end 100 mill. aktiver under forvaltning også oplyse deres put- og call-optionsbeholdninger. Da salgsoptioner generelt indikerer negativ stemning, og købsoptioner indikerer positiv stemning, kan vi få en fornemmelse af den overordnede institutionelle stemning ved at plotte forholdet mellem put og kald. Diagrammet til højre viser det historiske put/call-forhold for dette instrument.
Brug af Put/Call Ratio som en indikator for investorernes stemning overvinder en af de vigtigste mangler ved at bruge totalt institutionelt ejerskab, som er, at en betydelig mængde af aktiver under forvaltning investeres passivt for at spore indekser. Passivt forvaltede fonde køber typisk ikke optioner, så indikatoren for put/call-forholdet følger mere nøje følelsen af aktivt forvaltede fonde.
13F og NPORT arkivering
Detaljer om 13F-arkivering er gratis. Detaljer om NP-ansøgninger kræver et premium-medlemskab. Grønne rækker angiver nye positioner. Røde rækker angiver lukkede positioner. Klik på linket ikon for at se den fulde transaktionshistorik.
Opgrader
for at låse premium-data op og eksportere til Excel ![]() .
.
| Fil dato | Kilde | Investor | Type | Gennemsnitlig pris (Øst) |
Aktier | Δ Aktier (%) |
Rapporteret Værdi ($1000) |
Δ Værdi (%) |
Port Alloc (%) |
|
|---|---|---|---|---|---|---|---|---|---|---|
| 2026-01-23 | 13F | Nbt Bank N A /ny | 59 | 12 | ||||||
| 2026-01-29 | 13F | UBS Group AG | 175.772 | 16,12 | 10.313 | 18,77 | ||||
| 2026-02-18 | 13F | Royal Harbor Partners, LLC | 4.050 | -10,75 | 238 | -8,85 | ||||
| 2026-02-13 | 13F | Centaurus Financial, Inc. | 2.252 | 13,62 | 0 | |||||
| 2026-01-26 | 13F | Oxinas Partners Wealth Management LLC | 174.525 | 1,79 | 10.239 | 4,12 | ||||
| 2026-02-12 | 13F | TopTier Wealth Management, LLC | 33.031 | 1.938 | ||||||
| 2026-01-05 | 13F | GK Wealth Management LLC | 17.716 | 1.039 | ||||||
| 2026-02-17 | 13F | Royal Bank Of Canada | 697 | 0,00 | 41 | 2,50 | ||||
| 2026-02-09 | 13F | Harbour Investments, Inc. | 32.496 | 6,66 | 1.907 | 9,10 | ||||
| 2026-02-10 | 13F | Foundations Investment Advisors, LLC | 0 | -100,00 | 0 | |||||
| 2026-02-03 | 13F | Retirement Planning Group | 4.214.209 | 2,94 | 247.248 | 5,29 | ||||
| 2026-01-13 | 13F | CoreCap Advisors, LLC | 5.692 | 1,50 | 334 | 3,74 | ||||
| 2026-02-10 | 13F | Ritter Daniher Financial Advisory LLC / DE | 309.705 | -2,00 | 18.170 | 0,24 | ||||
| 2026-01-22 | 13F | Columbia Advisory Partners Llc | 402.504 | 11,18 | 23.615 | 13,72 | ||||
| 2026-02-17 | 13F | Susquehanna International Group, Llp | 21.911 | 104,81 | 1.286 | 109,62 | ||||
| 2026-02-11 | 13F | Jpmorgan Chase & Co | 27.520 | 94,16 | 1.615 | 98,52 | ||||
| 2026-02-04 | 13F | Legacy Financial Advisors, Inc. | 328.144 | -5,42 | 19.252 | -3,26 | ||||
| 2026-01-16 | 13F | Formidable Asset Management, LLC | 27.467 | 1.576 | ||||||
| 2026-02-04 | 13F | Horizon Wealth Management, LLC | 514.956 | 30.212 | ||||||
| 2026-02-17 | 13F | Private Advisor Group, LLC | 1.153.475 | 28,08 | 67.674 | 31,00 | ||||
| 2026-02-13 | 13F | Arkadios Wealth Advisors | 9.050 | -12,07 | 531 | -10,17 | ||||
| 2026-02-17 | 13F | Raymond James Financial Inc | 152.423 | 5,83 | 8.943 | 8,26 | ||||
| 2026-02-20 | 13F | Sunbelt Securities, Inc. | 82.578 | -1,01 | 4.845 | 1,23 | ||||
| 2026-02-11 | 13F | Etesian Wealth Advisors, Inc. | 285.340 | 13,34 | 16.741 | 15,92 | ||||
| 2026-02-13 | 13F | Brown Advisory Inc | 8.766 | 0,00 | 514 | 2,39 | ||||
| 2026-01-21 | 13F | Flagship Harbor Advisors, Llc | 61.334 | 0,55 | 3.598 | 2,86 | ||||
| 2026-02-02 | 13F | KPP Advisory Services LLC | 33.594 | 339,19 | 1.971 | 349,77 | ||||
| 2026-01-05 | 13F | Park Avenue Securities Llc | 11.653 | 1,84 | 1 | |||||
| 2026-02-09 | 13F | Kingsview Wealth Management, LLC | 75.558 | 0,73 | 4.433 | 3,05 | ||||
| 2026-02-11 | 13F | Gateway Wealth Partners, LLC | 11.775 | 18,95 | 691 | 21,69 | ||||
| 2026-01-29 | 13F | Concurrent Investment Advisors, LLC | 103.321 | 0,73 | 6.062 | 3,03 | ||||
| 2026-02-17 | 13F | Qube Research & Technologies Ltd | 0 | -100,00 | 0 | |||||
| 2026-01-26 | 13F | JNBA Financial Advisors | 853 | 2,28 | 50 | 6,38 | ||||
| 2026-02-10 | 13F | Avestar Capital, LLC | 71.804 | 0,02 | 4.213 | 2,31 | ||||
| 2026-02-17 | 13F | Herold Advisors, Inc. | 55.154 | 6,02 | 3.236 | 8,45 | ||||
| 2026-01-16 | 13F | Empirical Financial Services, LLC d.b.a. Empirical Wealth Management | 723.464 | 15.576,36 | 42.446 | 15.977,65 | ||||
| 2026-02-13 | 13F | Golden State Wealth Management, LLC | 1.148 | 3,33 | 67 | 6,35 | ||||
| 2026-02-14 | 13F | Rockefeller Capital Management L.P. | 99.360 | 2.323,41 | 5.862 | 2.394,04 | ||||
| 2026-01-07 | 13F | Massmutual Trust Co Fsb/adv | 0 | -100,00 | 0 | |||||
| 2026-02-17 | 13F/A | Kovack Advisors, Inc. | 8.538 | 501 | ||||||
| 2026-01-26 | 13F | AE Wealth Management LLC | 629 | 0,00 | 37 | 0,00 | ||||
| 2026-02-13 | 13F | Change Path, LLC | 24.514 | 38,71 | 1.438 | 41,95 | ||||
| 2026-02-04 | 13F | Win Advisors, Inc | 0 | -100,00 | 0 | |||||
| 2026-02-17 | 13F | Bank Of America Corp /de/ | 1.574.515 | 1,80 | 92.377 | 4,12 | ||||
| 2026-02-05 | 13F | Intrua Financial, LLC | 7.948 | -13,35 | 466 | -11,41 | ||||
| 2026-02-02 | 13F | CENTRAL TRUST Co | 699 | 41 | ||||||
| 2025-11-12 | 13F | Armis Advisers, LLC | 0 | -100,00 | 0 | |||||
| 2026-02-05 | 13F | Atria Investments Llc | 195.959 | 1,56 | 11.497 | 3,87 | ||||
| 2026-01-20 | 13F | Stratos Wealth Partners, LTD. | 8.175 | 116,38 | 480 | 121,76 | ||||
| 2026-02-10 | 13F/A | Northwestern Mutual Wealth Management Co | 283.701 | 5,92 | 16.645 | 8,34 | ||||
| 2026-02-12 | 13F | Bank Of Montreal /can/ | 400 | 0,00 | 23 | 4,55 | ||||
| 2026-02-06 | 13F | Flynn Zito Capital Management, Llc | 213.896 | -0,93 | 12.549 | 1,33 | ||||
| 2026-01-26 | 13F | United Advisor Group, LLC | 13.400 | 19,36 | 786 | 22,24 | ||||
| 2026-01-27 | 13F | Legacy Advisors, LLC | 6.225 | 0,00 | 365 | 2,24 | ||||
| 2026-03-02 | 13F | Sankala Group LLC | 2.985 | 169 | ||||||
| 2026-01-22 | 13F | Elm3 Financial Group, LLC | 4.788 | -23,28 | 281 | -21,57 | ||||
| 2026-02-03 | 13F | Falcon Wealth Planning | 5.274 | 0,59 | 309 | 3,00 | ||||
| 2026-01-29 | 13F | Bravias Capital Group, LLC | 31.407 | 24,70 | 1.843 | 27,56 | ||||
| 2026-02-06 | 13F | Covestor Ltd | 491 | 2,51 | 0 | |||||
| 2026-01-13 | 13F | Parsons Capital Management Inc/ri | 3.890 | 228 | ||||||
| 2026-02-13 | 13F | Integrated Wealth Concepts LLC | 3.701 | 217 | ||||||
| 2026-02-17 | 13F | Equitable Holdings, Inc. | 43.408 | 15,90 | 2.547 | 18,53 | ||||
| 2026-02-17 | 13F | Ameriprise Financial Inc | 86.322 | -11,82 | 5.065 | -9,81 | ||||
| 2026-02-13 | 13F | Morgan Stanley | 2.344.690 | 3,68 | 137.563 | 6,05 | ||||
| 2026-01-29 | 13F | Comerica Bank | 279 | 0,00 | 16 | 0,00 | ||||
| 2026-02-05 | 13F | Western Wealth Management, LLC | 14.955 | 55,89 | 877 | 59,45 | ||||
| 2026-02-11 | 13F | Insight Advisors, LLC/ PA | 275.021 | -0,16 | 16.135 | 2,11 | ||||
| 2026-01-29 | 13F | Sanctuary Advisors, LLC | 24.121 | -3,62 | 1.415 | -1,39 | ||||
| 2026-02-17 | 13F | Gladstone Institutional Advisory LLC | 24.477 | 13,59 | 1.436 | 16,18 | ||||
| 2026-01-16 | 13F | Tempus Wealth Planning, LLC | 4.909 | -2,04 | 288 | 0,35 | ||||
| 2026-02-17 | 13F | Jones Financial Companies Lllp | 1.683 | 776,56 | 99 | 880,00 | ||||
| 2026-02-04 | 13F | Ameritas Advisory Services, LLC | 0 | -100,00 | 0 | |||||
| 2026-02-18 | 13F | GWM Advisors LLC | 6.006 | -36,07 | 352 | -34,57 | ||||
| 2026-02-06 | 13F | Pnc Financial Services Group, Inc. | 4.000 | -32,44 | 235 | -30,97 | ||||
| 2026-01-29 | 13F | D.a. Davidson & Co. | 0 | -100,00 | 0 | |||||
| 2026-02-12 | 13F | Summit Financial, LLC | 34.686 | -1,64 | 2.035 | 0,64 | ||||
| 2026-02-12 | 13F | Great Valley Advisor Group, Inc. | 23.294 | 16,39 | 1.367 | 19,09 | ||||
| 2026-02-13 | 13F | Glen Eagle Advisors, LLC | 280 | 0,00 | 16 | 0,00 | ||||
| 2026-02-10 | 13F | Root Financial Partners, LLC | 0 | -100,00 | 0 | |||||
| 2026-02-06 | 13F | IFP Advisors, Inc | 259 | -23,15 | 15 | -21,05 | ||||
| 2026-02-12 | 13F | Jane Street Group, Llc | 4.038 | 237 | ||||||
| 2026-01-29 | 13F | Nbc Securities, Inc. | 88.006 | 0,74 | 5.163 | 3,03 | ||||
| 2025-10-31 | 13F | Drive Wealth Management, Llc | 0 | -100,00 | 0 | |||||
| 2026-02-09 | 13F | Millington Financial Advisors, LLC | 9.086 | 0,09 | 519 | -0,38 | ||||
| 2026-01-14 | 13F | Enclave Advisors LLC | 3.994 | -32,70 | 234 | -31,18 | ||||
| 2026-01-23 | 13F | Halbert Hargrove Global Advisors, Llc | 6.994 | -0,37 | 410 | 1,99 | ||||
| 2026-02-12 | 13F | Commonwealth Equity Services, Llc | 33.975 | 121,48 | 1.993 | |||||
| 2026-01-27 | 13F | ZEGA Investments, LLC | 3.519 | 206 | ||||||
| 2026-02-13 | 13F | Smartleaf Asset Management LLC | 261.909 | 1,76 | 15.492 | 5,19 | ||||
| 2026-02-12 | 13F | Founders Financial Alliance, LLC | 7.848 | 31,77 | 460 | 34,90 | ||||
| 2026-02-17 | 13F | Advisor Group Holdings, Inc. | 374.511 | 697,00 | 21.974 | 721,77 | ||||
| 2026-02-17 | 13F | Cetera Investment Advisers | 371.378 | 333,07 | 21.789 | 343,03 | ||||
| 2026-02-13 | 13F | Kestra Advisory Services, LLC | 0 | -100,00 | 0 | |||||
| 2026-02-06 | 13F | Empirical Asset Management, LLC | 6.373 | -22,58 | 374 | -20,97 | ||||
| 2026-01-26 | 13F | Private Trust Co Na | 2.637 | 271,41 | 155 | 285,00 | ||||
| 2026-01-12 | 13F | Farrell Financial LLC | 11.846 | 4,16 | 695 | 6,60 | ||||
| 2026-02-12 | 13F | Investor's Fiduciary Advisor Network, LLC | 3.854 | 0 | ||||||
| 2026-02-05 | 13F | Soltis Investment Advisors LLC | 7.885 | -14,81 | 463 | -12,83 | ||||
| 2026-02-11 | 13F | Vise Technologies, Inc. | 5.653 | 332 | ||||||
| 2026-02-05 | 13F | Cambridge Investment Research Advisors, Inc. | 70.587 | 20,75 | 4 | 33,33 | ||||
| 2026-02-12 | 13F | Steward Partners Investment Advisory, Llc | 8.220 | 19,88 | 482 | 22,65 | ||||
| 2026-02-17 | 13F | VestGen Advisors, LLC | 4.289 | -6,33 | 252 | -4,20 | ||||
| 2026-01-22 | 13F | tru Independence LLC | 183.393 | 2,41 | 10.760 | 4,74 | ||||
| 2026-02-10 | 13F | Evolution Wealth Management Inc. | 188 | 0,00 | 11 | 10,00 | ||||
| 2026-02-17 | 13F | Citadel Advisors Llc | 5.285 | 310 | ||||||
| 2026-02-03 | 13F | We Are One Seven, LLC | 60.663 | 6,41 | 3.559 | 8,84 | ||||
| 2026-02-03 | 13F | RFG Advisory, LLC | 37.394 | 10,40 | 2.194 | 12,92 | ||||
| 2026-02-11 | 13F | Prestige Wealth Management Group LLC | 382.611 | -0,03 | 22.448 | 2,25 | ||||
| 2026-01-12 | 13F | RVW Wealth, LLC | 1.082.120 | -7,09 | 63.488 | -4,97 | ||||
| 2025-10-07 | 13F | Thurston, Springer, Miller, Herd & Titak, Inc. | 0 | -100,00 | 0 | |||||
| 2025-11-04 | 13F | L.m. Kohn & Company | 0 | -100,00 | 0 | -100,00 | ||||
| 2026-01-27 | 13F | Elevated Capital Advisors, LLC | 100 | 6 | ||||||
| 2026-02-11 | 13F | LPL Financial LLC | 2.817.821 | 8,90 | 165.322 | 11,39 | ||||
| 2026-02-26 | 13F | TD Capital Management LLC | 45.957 | 12,71 | 2.696 | 15,31 | ||||
| 2026-02-17 | 13F | Mercer Global Advisors Inc /adv | 3.409 | 200 | ||||||
| 2026-02-06 | 13F | HighTower Advisors, LLC | 3.474.401 | 3,50 | 203.843 | 5,86 | ||||
| 2026-02-17 | 13F | EFG International AG | 600 | 35 | ||||||
| 2026-02-19 | 13F | WealthPoint Financial, LLC | 8.937 | 524 | ||||||
| 2026-02-06 | 13F | GPS Wealth Strategies Group, LLC | 8.962 | -97,03 | 526 | -96,97 | ||||
| 2026-02-10 | 13F | Resolute Capital, Llc | 218.948 | 12.846 | ||||||
| 2026-02-02 | 13F | Truist Financial Corp | 4.015 | -85,20 | 236 | -84,90 | ||||
| 2026-02-17 | 13F | Wiley Bros.-aintree Capital, Llc | 4.464 | -3,46 | 262 | -1,51 | ||||
| 2026-01-29 | 13F | Comprehensive Financial Consultants Institutional, Inc. | 46.422 | 2,32 | 2.724 | 4,65 | ||||
| 2026-02-17 | 13F | Creative Planning | 5.408 | 3,17 | 317 | 5,67 | ||||
| 2026-02-17 | 13F | Lantern Wealth Advisors, LLC | 0 | -100,00 | 0 | |||||
| 2026-01-13 | 13F | Trust Point Inc. | 2.620.337 | -0,66 | 153.735 | 1,61 | ||||
| 2026-01-21 | 13F | Sound Income Strategies, LLC | 167.464 | 62,79 | 9.875 | 64,73 | ||||
| 2026-01-23 | 13F | Optima Capital Llc | 26 | 2 | ||||||
| 2026-01-23 | 13F | Farther Finance Advisors, LLC | 1.279 | 75 | ||||||
| 2026-02-11 | 13F | Janney Montgomery Scott LLC | 7.009 | 12,88 | 0 | |||||
| 2026-02-17 | 13F | Fmr Llc | 4.898 | 61,65 | 287 | 65,90 | ||||
| 2026-01-26 | 13F | Cwm, Llc | 144.429 | 89,85 | 8 | 100,00 | ||||
| 2026-02-13 | 13F | Quattro Advisors LLC | 253.502 | 14.873 | ||||||
| 2026-01-29 | 13F | Kestra Private Wealth Services, Llc | 17.548 | -41,78 | 1.030 | -40,49 | ||||
| 2026-02-10 | 13F | Envestnet Asset Management Inc | 137.741 | -7,34 | 8.081 | -5,22 | ||||
| 2026-01-28 | 13F | Trademark Financial Management, LLC | 14.730 | 864 | ||||||
| 2026-02-05 | 13F | Tucker Asset Management Llc | 1.681 | 0,00 | 99 | 2,08 | ||||
| 2026-01-15 | 13F | Shrier Wealth Management, Llc | 4.614 | 271 | ||||||
| 2026-02-04 | 13F | D'Orazio & Associates, Inc. | 6.069 | 0,00 | 356 | 2,30 | ||||
| 2026-02-13 | 13F | Mml Investors Services, Llc | 38.608 | -2,59 | 2.265 | -0,35 | ||||
| 2026-01-09 | 13F | Dynamic Advisor Solutions LLC | 4.352 | -3,40 | 255 | -1,16 | ||||
| 2026-02-06 | 13F | Creative Financial Designs Inc /adv | 14.100 | 4,56 | 827 | 6,99 | ||||
| 2026-02-13 | 13F | Aptus Capital Advisors, LLC | 2.738 | 364,07 | 161 | 384,85 | ||||
| 2025-11-10 | 13F | Tableaux Llc | 0 | -100,00 | 0 |