Grundlæggende statistik
| Institutionelle aktier (lange) | 117.085.736 - 87,72% (ex 13D/G) - change of -13,56MM shares -10,38% MRQ |
| Institutionel værdi (lang) | $ 599.628 USD ($1000) |
Institutionelt ejerskab og aktionærer
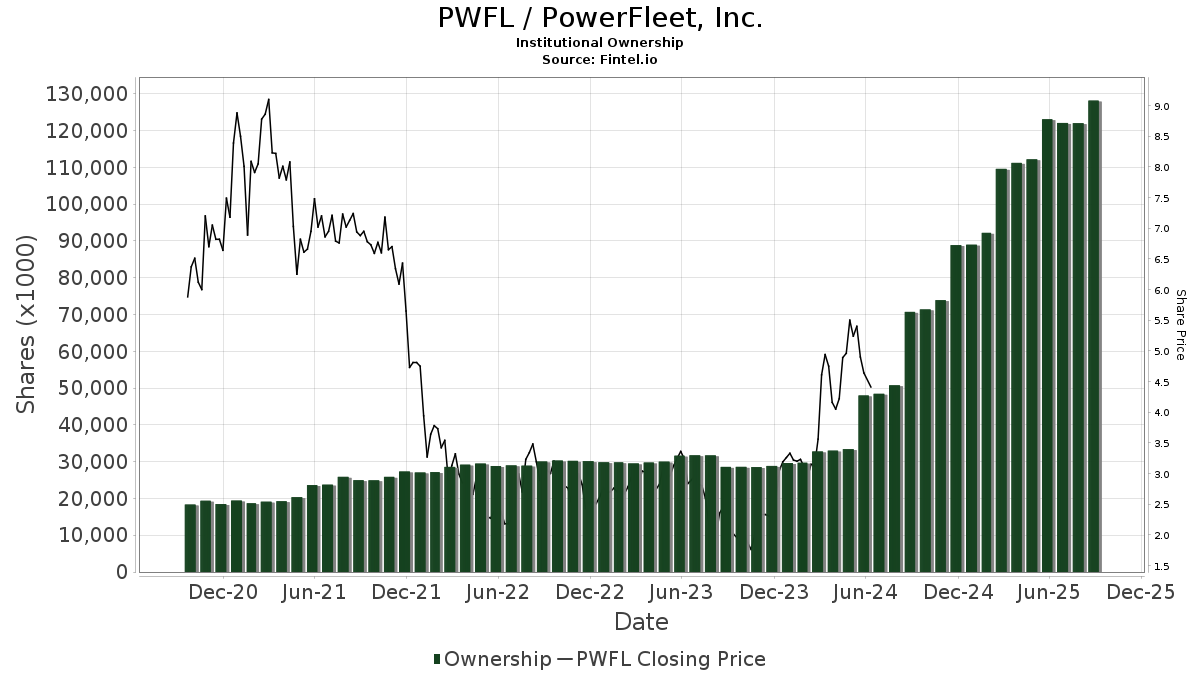
PowerFleet, Inc. (US:PWFL) har 190 institutionelle ejere og aktionærer, der har indsendt 13D/G- eller 13F-formularer til Securities Exchange Commission (SEC). Disse institutioner har i alt 117,085,736 aktier. Største aktionærer omfatter BlackRock, Inc., Vanguard Group Inc, Disciplined Growth Investors Inc /mn, Private Capital Management, LLC, Private Management Group Inc, AWM Investment Company, Inc., Royce & Associates Lp, Voss Capital, LLC, 325 Capital Llc, and Samjo Management, LLC .
PowerFleet, Inc. (NasdaqGM:PWFL) institutionel ejerskabsstruktur viser aktuelle positioner i virksomheden efter institutioner og fonde, samt seneste ændringer i positionsstørrelse. Større aktionærer kan omfatte individuelle investorer, investeringsforeninger, hedgefonde eller institutioner. Skema 13D angiver, at investoren besidder (eller besidder) mere end 5 % af virksomheden og har til hensigt (eller har til hensigt at) aktivt at forfølge en ændring i forretningsstrategi. Skema 13G indikerer en passiv investering på over 5%.
Fondens stemningsscore
Fund Sentiment Score (fka Ownership Accumulation Score) finder de aktier, der bliver mest købt af fonde. Det er resultatet af en sofistikeret, multi-faktor kvantitativ model, der identificerer virksomheder med de højeste niveauer af institutionel akkumulering. Scoringsmodellen bruger en kombination af den samlede stigning i oplyste ejere, ændringerne i porteføljeallokeringer i disse ejere og andre målinger. Tallet går fra 0 til 100, hvor højere tal indikerer et højere niveau af akkumulering for sine jævnaldrende, og 50 er gennemsnittet.
Opdateringsfrekvens: Dagligt
Se Ownership Explorer, som giver en liste over højest rangerende virksomheder.
AI+ Ask Fintel’s AI assistant about PowerFleet, Inc..
Select a question to share a public post with an AI-crafted answer.
Thinking of good questions…
Institutionel Put/Call-forhold
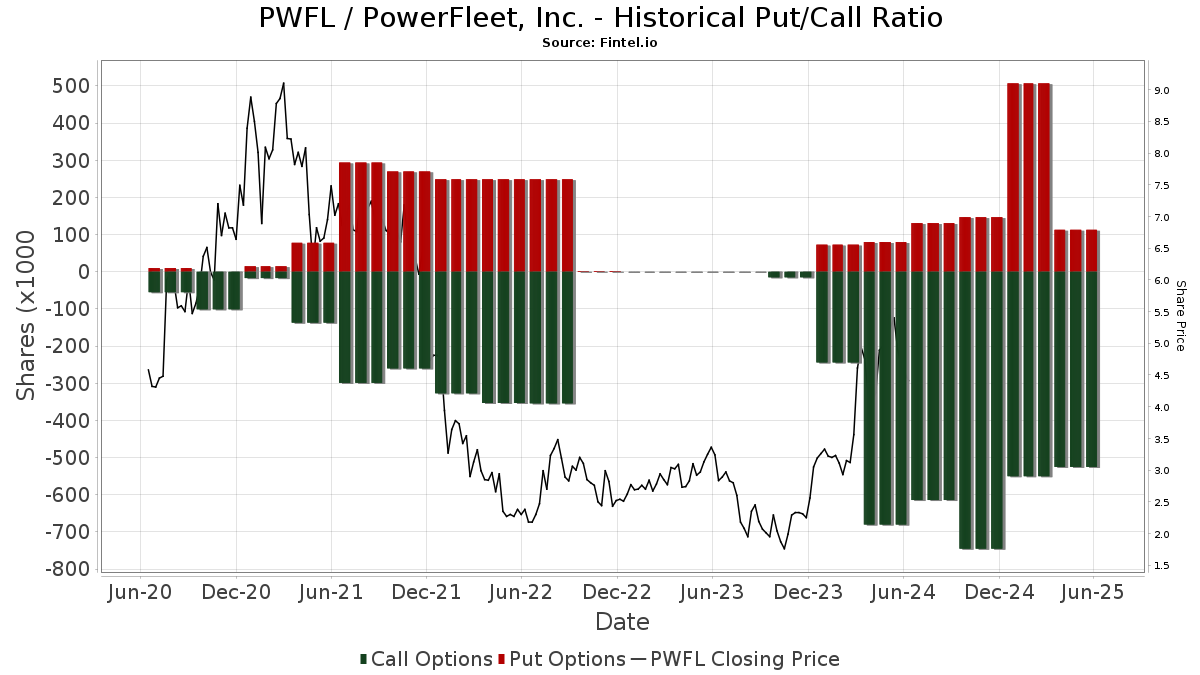
Ud over at indberette standardaktie- og gældsudstedelser skal institutter med mere end 100 mill. aktiver under forvaltning også oplyse deres put- og call-optionsbeholdninger. Da salgsoptioner generelt indikerer negativ stemning, og købsoptioner indikerer positiv stemning, kan vi få en fornemmelse af den overordnede institutionelle stemning ved at plotte forholdet mellem put og kald. Diagrammet til højre viser det historiske put/call-forhold for dette instrument.
Brug af Put/Call Ratio som en indikator for investorernes stemning overvinder en af de vigtigste mangler ved at bruge totalt institutionelt ejerskab, som er, at en betydelig mængde af aktiver under forvaltning investeres passivt for at spore indekser. Passivt forvaltede fonde køber typisk ikke optioner, så indikatoren for put/call-forholdet følger mere nøje følelsen af aktivt forvaltede fonde.
13F og NPORT arkivering
Detaljer om 13F-arkivering er gratis. Detaljer om NP-ansøgninger kræver et premium-medlemskab. Grønne rækker angiver nye positioner. Røde rækker angiver lukkede positioner. Klik på linket ikon for at se den fulde transaktionshistorik.
Opgrader
for at låse premium-data op og eksportere til Excel ![]() .
.
| Fil dato | Kilde | Investor | Type | Gennemsnitlig pris (Øst) |
Aktier | Δ Aktier (%) |
Rapporteret Værdi ($1000) |
Δ Værdi (%) |
Port Alloc (%) |
|
|---|---|---|---|---|---|---|---|---|---|---|
| 2026-04-21 | 13F | Pinnacle Wealth Management Advisory Group, LLC | 11.299 | 35 | ||||||
| 2026-02-17 | 13F | Stoic Point Capital Management LLC | 689.962 | 3.671 | ||||||
| 2026-04-16 | 13F | Aegon Asset Management Uk Plc | 0 | -100,00 | 0 | |||||
| 2025-10-30 | 13F | Strs Ohio | 0 | -100,00 | 0 | |||||
| 2026-02-10 | 13F | State of Wyoming | 3.051 | 16 | ||||||
| 2026-02-17 | 13F | Millennium Management Llc | 171.526 | -87,13 | 913 | -86,94 | ||||
| 2026-02-17 | 13F | Susquehanna International Group, Llp | Call | 111.600 | -44,53 | 594 | -43,74 | |||
| 2025-11-14 | 13F | Skopos Labs, Inc. | 0 | -100,00 | 0 | |||||
| 2026-04-20 | 13F | Cardinal Point Capital Management, ULC | 135.800 | 124,46 | 418 | 30,22 | ||||
| 2026-02-13 | 13F | Victory Capital Management Inc | 14.457 | 0,31 | 77 | 1,33 | ||||
| 2026-02-11 | 13F | Simplex Trading, Llc | Put | 0 | -100,00 | 0 | ||||
| 2026-02-13 | 13F | Prudential Financial Inc | 0 | -100,00 | 0 | |||||
| 2026-02-17 | 13F | Ionic Capital Management LLC | 519.977 | 46,48 | 2.766 | 48,71 | ||||
| 2026-02-11 | 13F | Private Management Group Inc | 5.264.812 | 1,09 | 28.009 | 2,63 | ||||
| 2026-02-13 | 13F | Diametric Capital, LP | 181.805 | 27,91 | 967 | 29,97 | ||||
| 2026-02-17 | 13F | Susquehanna International Group, Llp | 13.331 | -94,64 | 71 | -94,62 | ||||
| 2025-11-14 | 13F | Northwestern Mutual Wealth Management Co | 0 | -100,00 | 0 | |||||
| 2026-02-11 | 13F | Ameritas Investment Partners, Inc. | 10.385 | 0,00 | 55 | 1,85 | ||||
| 2025-11-13 | 13F | Hsbc Holdings Plc | 0 | -100,00 | 0 | |||||
| 2026-02-17 | 13F | Worth Venture Partners, LLC | 63.290 | 87,53 | 337 | 90,91 | ||||
| 2026-02-12 | 13F | Voya Investment Management Llc | 23.267 | 0,00 | 124 | 1,65 | ||||
| 2026-02-17 | 13F | Price T Rowe Associates Inc /md/ | 72.259 | 9,69 | 0 | |||||
| 2026-02-11 | 13F | Group One Trading, L.p. | Put | 200 | -98,15 | 1 | -98,21 | |||
| 2026-02-11 | 13F | Group One Trading, L.p. | 7.114 | -85,70 | 38 | -85,77 | ||||
| 2026-02-17 | 13F | Advisor Group Holdings, Inc. | 475 | -27,92 | 3 | -33,33 | ||||
| 2026-02-11 | 13F | Group One Trading, L.p. | Call | 22.200 | 48,00 | 118 | 51,28 | |||
| 2026-04-21 | 13F | Pinnacle Associates Ltd | 3.130.744 | 43,43 | 9.643 | -16,97 | ||||
| 2026-01-15 | 13F | Nisa Investment Advisors, Llc | 1.729 | 10,48 | 9 | 12,50 | ||||
| 2026-02-09 | 13F | Quest Partners LLC | 3.422 | 0,00 | 18 | 5,88 | ||||
| 2026-02-10 | 13F | Intech Investment Management Llc | 71.591 | 14,16 | 381 | 15,85 | ||||
| 2026-02-13 | 13F | Rhumbline Advisers | 151.751 | -14,21 | 807 | -12,85 | ||||
| 2026-04-16 | 13F | SG Americas Securities, LLC | 82.510 | -4,50 | 0 | |||||
| 2026-02-17 | 13F | Qube Research & Technologies Ltd | 0 | -100,00 | 0 | |||||
| 2026-02-11 | 13F | Hughes Financial Services, LLC | 1 | 0 | ||||||
| 2026-02-13 | 13F | Occam Crest Management LP | 197.000 | -71,86 | 1.048 | -71,43 | ||||
| 2026-04-23 | 13F | CWM Advisors, LLC | 169.474 | 92,44 | 522 | 11,32 | ||||
| 2026-02-13 | 13F | SRS Capital Advisors, Inc. | 180 | -85,43 | 1 | -100,00 | ||||
| 2026-02-17 | 13F | Cetera Investment Advisers | 199.243 | -8,07 | 1.060 | -6,70 | ||||
| 2026-02-13 | 13F | Hurley Capital, LLC | 6.000 | 32 | ||||||
| 2025-11-14 | 13F | Oxford Asset Management Llp | 0 | -100,00 | 0 | -100,00 | ||||
| 2026-04-22 | 13F | Pictet Asset Management Holding SA | 22.358 | 0,00 | 69 | -42,37 | ||||
| 2026-03-03 | 13F/A | Caitong International Asset Management Co., Ltd | 48 | 0 | ||||||
| 2026-01-30 | 13F | ABS Direct Equity Fund LLC | 0 | -100,00 | 0 | |||||
| 2026-04-23 | 13F | SJS Investment Consulting Inc. | 19 | 0 | ||||||
| 2026-01-28 | 13F | Arizona State Retirement System | 33.135 | -6,61 | 176 | -4,86 | ||||
| 2026-02-12 | 13F | BlackRock, Inc. | 9.614.714 | 1,57 | 51.150 | 3,13 | ||||
| 2026-02-17 | 13F | Boothbay Fund Management, Llc | 23.523 | 125 | ||||||
| 2026-02-11 | 13F | First Dallas Securities Inc. | 91.450 | 110,23 | 487 | 114,10 | ||||
| 2026-02-10 | 13F | Acadian Asset Management Llc | 6 | 0,00 | 0 | |||||
| 2026-02-13 | 13F | Stifel Financial Corp | 36.505 | 181,44 | 194 | 189,55 | ||||
| 2026-02-17 | 13F | 325 Capital Llc | 3.837.410 | 5,24 | 20.415 | 6,85 | ||||
| 2026-02-17 | 13F | Sherbrooke Park Advisers Llc | 0 | -100,00 | 0 | |||||
| 2026-02-17 | 13F | Captrust Financial Advisors | 190.417 | 4,15 | 1.013 | 5,74 | ||||
| 2026-04-07 | 13F/A | Round Rock Advisors, LLC | 72.518 | 64,99 | 386 | 65,95 | ||||
| 2026-02-13 | 13F | Morgan Stanley | 823.929 | 23,59 | 4.383 | 25,48 | ||||
| 2026-02-03 | 13F | We Are One Seven, LLC | 10.397 | 55 | ||||||
| 2026-02-13 | 13F | AWM Investment Company, Inc. | 4.701.506 | -0,03 | 25.012 | 1,50 | ||||
| 2026-02-11 | 13F | Franklin Resources Inc | 38.612 | 4,90 | 205 | 6,77 | ||||
| 2026-02-17 | 13F | Lynrock Lake LP | 1.908.455 | -42,39 | 10.153 | -41,51 | ||||
| 2025-10-29 | 13F | AMH Equity Ltd | 900.000 | -9,91 | 4.716 | 9,55 | ||||
| 2026-02-06 | 13F | Bastion Asset Management Inc. | 1.712.883 | 78,41 | 8.853 | 85,34 | ||||
| 2026-02-17 | 13F | Oberweis Asset Management Inc/ | 1.095.252 | 2,47 | 5.827 | 4,04 | ||||
| 2025-11-14 | 13F | Trexquant Investment LP | 0 | -100,00 | 0 | |||||
| 2026-02-17 | 13F | Cetera Investment Advisers | Call | 0 | -100,00 | 0 | ||||
| 2026-01-22 | 13F | Brookwood Investment Group LLC | 31.265 | 176,24 | 166 | 181,36 | ||||
| 2026-02-17 | 13F | CHICAGO TRUST Co NA | 0 | -100,00 | 0 | |||||
| 2026-01-22 | 13F | Bfsg, Llc | 40.583 | 1,20 | 216 | 2,38 | ||||
| 2025-11-14 | 13F | AYAL Capital Advisors Ltd | 0 | -100,00 | 0 | |||||
| 2026-02-06 | 13F | Larson Financial Group LLC | 35 | 45,83 | 0 | |||||
| 2026-02-06 | 13F | HighTower Advisors, LLC | 19.008 | 0,02 | 101 | 2,02 | ||||
| 2026-02-10 | 13F | Axq Capital, Lp | 26.639 | 131,26 | 142 | 135,00 | ||||
| 2026-02-11 | 13F | Potomac Capital Management, Inc. | 206.000 | 41,08 | 1.096 | 119,44 | ||||
| 2026-02-17 | 13F | Royal Bank Of Canada | 6.350 | 14,56 | 34 | 17,24 | ||||
| 2026-02-13 | 13F | Citigroup Inc | 6.107 | -39,75 | 32 | -39,62 | ||||
| 2026-02-10 | 13F | Quantbot Technologies LP | 111.932 | 595 | ||||||
| 2026-02-09 | 13F | Connors Investor Services Inc | 56.000 | 5,66 | 298 | 7,22 | ||||
| 2026-02-17 | 13F | Janus Henderson Group Plc | 51.400 | 0,00 | 273 | 1,49 | ||||
| 2026-01-27 | 13F | TD Waterhouse Canada Inc. | 3.500 | 0,00 | 19 | 0,00 | ||||
| 2026-02-17 | 13F | Aqr Capital Management Llc | 105.082 | -14,33 | 559 | -12,93 | ||||
| 2026-02-05 | 13F | Allworth Financial LP | 232 | 54,67 | 1 | |||||
| 2026-02-11 | 13F | LPL Financial LLC | 86.616 | -4,06 | 461 | -2,75 | ||||
| 2025-11-14 | 13F | Wolverine Trading, Llc | Call | 0 | -100,00 | 0 | ||||
| 2026-02-09 | 13F | Harbour Investments, Inc. | 2 | -99,82 | 0 | -100,00 | ||||
| 2025-11-14 | 13F | Wolverine Trading, Llc | 0 | -100,00 | 0 | |||||
| 2026-02-12 | 13F | Steward Partners Investment Advisory, Llc | 636 | 0,00 | 3 | 0,00 | ||||
| 2026-02-17 | 13F/A | Sentinus, LLC | 223.550 | 1.189 | ||||||
| 2025-11-14 | 13F | Algert Global Llc | 0 | -100,00 | 0 | |||||
| 2026-04-22 | 13F | Sterling Capital Management LLC | 4.143 | -42,18 | 13 | -68,42 | ||||
| 2026-04-21 | 13F | Maridea Wealth Management LLC | 15.977 | 0,00 | 49 | -41,67 | ||||
| 2025-11-14 | 13F | Wolverine Trading, Llc | Put | 0 | -100,00 | 0 | ||||
| 2026-02-17 | 13F | Bank Of America Corp /de/ | 205.608 | 31,78 | 1.094 | 33,78 | ||||
| 2026-02-13 | 13F | BNP Paribas Asset Management Holding S.A. | 1.715 | 52,99 | 0 | |||||
| 2026-02-10 | 13F | Goldman Sachs Group Inc | 1.169.710 | 271,02 | 6.223 | 276,86 | ||||
| 2026-02-13 | 13F | Charles Schwab Investment Management Inc | 997.368 | -0,10 | 5.306 | 1,41 | ||||
| 2026-02-11 | 13F | Los Angeles Capital Management Llc | 26.315 | -4,31 | 131 | -9,72 | ||||
| 2026-02-17 | 13F | Dark Forest Capital Management Lp | 0 | -100,00 | 0 | -100,00 | ||||
| 2026-02-12 | 13F | MetLife Investment Management, LLC | 60.745 | -15,84 | 323 | -14,55 | ||||
| 2025-11-14 | 13F | Schonfeld Strategic Advisors LLC | 0 | -100,00 | 0 | |||||
| 2026-04-07 | 13F | Farther Finance Advisors, LLC | 67 | 91,43 | 0 | |||||
| 2026-02-11 | 13F | Deutsche Bank Ag\ | 142.248 | 11,15 | 757 | 12,84 | ||||
| 2026-02-13 | 13F/A | Ontario Teachers Pension Plan Board | 0 | -100,00 | 0 | |||||
| 2026-02-09 | 13F | Royce & Associates Lp | 4.471.131 | 3,69 | 23.786 | 5,28 | ||||
| 2026-02-17 | 13F | Ardsley Advisory Partners Lp | 0 | -100,00 | 0 | |||||
| 2026-01-29 | 13F | Comerica Bank | 128 | -75,85 | 1 | -100,00 | ||||
| 2025-11-14 | 13F | ExodusPoint Capital Management, LP | 0 | -100,00 | 0 | |||||
| 2026-02-17 | 13F | State Of Wisconsin Investment Board | 419.478 | 78,93 | 2.232 | 81,68 | ||||
| 2026-02-13 | 13F | Pathstone Holdings, LLC | 52.229 | 79,49 | 278 | 82,24 | ||||
| 2026-04-06 | 13F | GAMMA Investing LLC | 578 | 27,88 | 2 | -50,00 | ||||
| 2026-04-24 | 13F | ProShare Advisors LLC | 18.021 | -20,68 | 56 | -54,17 | ||||
| 2025-11-12 | 13F | Headlands Technologies LLC | 0 | -100,00 | 0 | |||||
| 2026-04-15 | 13F | Fortitude Family Office, LLC | 0 | -100,00 | 0 | |||||
| 2026-02-17 | 13F | Blair William & Co/il | 740.122 | -13,07 | 3.937 | -11,75 | ||||
| 2026-02-03 | 13F | Strengthening Families & Communities, LLC | 1.279 | 0,00 | 7 | 0,00 | ||||
| 2026-02-17 | 13F | Prelude Capital Management, Llc | 29.108 | -25,97 | 155 | -25,24 | ||||
| 2026-02-17 | 13F | Tower Research Capital LLC (TRC) | 7.123 | 4,02 | 38 | 5,71 | ||||
| 2026-02-17 | 13F | Kemnay Advisory Services Inc. | 9.083 | 48 | ||||||
| 2026-02-10 | 13F | Bnp Paribas Arbitrage, Sa | 27.617 | 11,17 | 147 | 12,31 | ||||
| 2026-02-14 | 13F | Rockefeller Capital Management L.P. | 495 | 0,00 | 3 | 0,00 | ||||
| 2026-01-28 | 13F | Klp Kapitalforvaltning As | 25.800 | 12,17 | 137 | 14,17 | ||||
| 2026-02-06 | 13F | Pnc Financial Services Group, Inc. | 70 | 0 | ||||||
| 2026-02-05 | 13F | Bessemer Group Inc | 1.206 | 0 | ||||||
| 2026-02-17 | 13F | Private Capital Management, LLC | 7.584.853 | 3,14 | 40.351 | 4,71 | ||||
| 2026-02-13 | 13F | Verition Fund Management LLC | 146.448 | 287,54 | 779 | 293,43 | ||||
| 2026-02-11 | 13F | Hodges Capital Management Inc. | 301.985 | 1.607 | ||||||
| 2026-02-10 | 13F | Rothschild Investment Llc | 245.897 | 122.848,50 | 1.308 | 130.700,00 | ||||
| 2026-02-03 | 13F | Swedbank AB | 0 | -100,00 | 0 | |||||
| 2026-02-09 | 13F | Hartland & Co., LLC | 0 | -100,00 | 0 | |||||
| 2026-02-13 | 13F | American Century Companies Inc | 46.090 | 343,60 | 245 | 353,70 | ||||
| 2026-02-10 | 13F | Envestnet Asset Management Inc | 10.133 | 54 | ||||||
| 2026-02-17 | 13F | Credit Agricole S A | 166.544 | 886 | ||||||
| 2026-02-13 | 13F | Bandera Partners LLC | 1.881.666 | 0,00 | 10.010 | 1,53 | ||||
| 2026-02-17 | 13F/A | Samjo Management, LLC | 3.481.067 | 14,70 | 18.519 | 16,45 | ||||
| 2026-02-05 | 13F | Amalgamated Bank | 3.905 | 13,25 | 0 | |||||
| 2026-02-17 | 13F | Silvercrest Asset Management Group Llc | 1.415.095 | 0,00 | 7.528 | 1,52 | ||||
| 2026-02-17 | 13F | Susquehanna International Group, Llp | Put | 0 | -100,00 | 0 | ||||
| 2026-01-29 | 13F | Vanguard Group Inc | 9.588.511 | -0,44 | 51.011 | 1,08 | ||||
| 2026-04-13 | 13F | IFP Advisors, Inc | 576 | 476,00 | 2 | |||||
| 2026-02-13 | 13F | Toroso Investments, LLC | 100.738 | -16,06 | 536 | -14,81 | ||||
| 2026-02-17 | 13F | Gotham Asset Management, LLC | 11.991 | -12,46 | 64 | -11,27 | ||||
| 2026-02-17 | 13F | Russell Investments Group, Ltd. | 10.296 | 0,00 | 55 | 1,89 | ||||
| 2026-02-12 | 13F | Renaissance Technologies Llc | 87.736 | -29,36 | 467 | -28,31 | ||||
| 2026-04-07 | 13F | Signaturefd, Llc | 424 | 184,56 | 1 | |||||
| 2026-02-17 | 13F | Shay Capital LLC | 161.692 | -41,35 | 860 | -40,44 | ||||
| 2026-01-29 | 13F | UBS Group AG | 585.774 | 275,10 | 3.116 | 280,93 | ||||
| 2026-02-06 | 13F | EverSource Wealth Advisors, LLC | 596 | 0,00 | 3 | 0,00 | ||||
| 2026-02-10 | 13F | Bank of New York Mellon Corp | 320.571 | -7,84 | 1.705 | -6,42 | ||||
| 2026-02-17 | 13F | Raymond James Financial Inc | 676.083 | -7,14 | 3.597 | -5,74 | ||||
| 2026-02-17 | 13F | 9823 Capital, L.P. | 34.036 | 181 | ||||||
| 2026-02-13 | 13F | National Bank Of Canada /fi/ | 1.276 | -0,47 | 7 | 0,00 | ||||
| 2026-02-13 | 13F | Dynamic Technology Lab Private Ltd | 37.413 | 199 | ||||||
| 2025-11-14 | 13F | Ashford Capital Management Inc | 0 | -100,00 | 0 | -100,00 | ||||
| 2026-02-04 | 13F | Blackhawk Capital Partners LLC. | 12.898 | -7,95 | 69 | -6,85 | ||||
| 2026-02-10 | 13F | Semanteon Capital Management, LP | 11.114 | -64,26 | 59 | -63,58 | ||||
| 2026-02-13 | 13F | Police & Firemen's Retirement System of New Jersey | 34.105 | 0,00 | 181 | 1,69 | ||||
| 2026-02-09 | 13F | Geode Capital Management, Llc | 2.961.747 | 0,08 | 15.759 | 1,61 | ||||
| 2026-02-12 | 13F | Riverwater Partners LLC | 19.190 | 102 | ||||||
| 2026-02-09 | 13F | Schwarz Dygos Wheeler Investment Advisors Llc | 0 | -100,00 | 0 | |||||
| 2026-02-17 | 13F | Creative Planning | 12.580 | 67 | ||||||
| 2026-02-03 | 13F | SBI Securities Co., Ltd. | 65 | -20,73 | 0 | |||||
| 2026-02-23 | 13F | Leonteq Securities AG | 0 | -100,00 | 0 | |||||
| 2026-02-12 | 13F | Tripletail Wealth Management, LLC | 21.070 | 11,22 | 78 | -25,24 | ||||
| 2026-02-17 | 13F | Citadel Advisors Llc | Put | 15.600 | -33,62 | 83 | -33,33 | |||
| 2026-02-17 | 13F | Citadel Advisors Llc | 1.382.292 | 396,43 | 7.354 | 403,98 | ||||
| 2026-01-26 | 13F | Cwm, Llc | 6.665 | 7,45 | 0 | |||||
| 2026-02-12 | 13F | Nuveen, LLC | 3.312.956 | 44,68 | 17.625 | 46,89 | ||||
| 2026-02-13 | 13F | Bard Associates Inc | 290.558 | -8,13 | 1.546 | -6,76 | ||||
| 2026-02-17 | 13F | Citadel Advisors Llc | Call | 45.600 | 192,31 | 243 | 198,77 | |||
| 2026-02-17 | 13F | Advisory Services Network, LLC | 0 | -100,00 | 0 | |||||
| 2026-02-17 | 13F | Alliancebernstein L.p. | 108.940 | 0,00 | 580 | 1,58 | ||||
| 2026-04-15 | 13F | Financial Management Professionals, Inc. | 0 | -100,00 | 0 | |||||
| 2026-02-12 | 13F | Dimensional Fund Advisors Lp | 3.431.558 | 11,00 | 18.256 | 12,71 | ||||
| 2026-02-19 | 13F | CI Private Wealth, LLC | 46.384 | -10,82 | 247 | -9,56 | ||||
| 2026-02-17 | 13F | Brevan Howard Capital Management LP | 0 | -100,00 | 0 | |||||
| 2025-11-07 | 13F | Fiera Capital Corp | 0 | -100,00 | 0 | -100,00 | ||||
| 2026-04-22 | 13F | 1492 Capital Management LLC | 1.237.163 | 3.810 | -42,25 | |||||
| 2026-04-22 | 13F | Spire Wealth Management | 0 | -100,00 | 0 | |||||
| 2026-04-20 | 13F | State of Alaska, Department of Revenue | 6.059 | 0,00 | 0 | |||||
| 2026-01-30 | 13F | Pekin Hardy Strauss, Inc. | 29.000 | 0,00 | 154 | 1,99 | ||||
| 2026-01-27 | 13F | Zurcher Kantonalbank (Zurich Cantonalbank) | 21.773 | 116 | ||||||
| 2026-02-17 | 13F | Regal Investment Advisors LLC | 15.323 | 1,45 | 82 | 2,53 | ||||
| 2026-04-10 | 13F | Kopion Asset Management, LLC | 2.436.612 | 56,83 | 7.505 | -9,21 | ||||
| 2026-02-13 | 13F | K2 Principal Fund, L.p. | 268.846 | 7,54 | 1.430 | 9,16 | ||||
| 2026-02-10 | 13F | Options Solutions, Llc | 67.887 | 9,03 | 361 | 10,74 | ||||
| 2026-02-13 | 13F | OMERS ADMINISTRATION Corp | 0 | -100,00 | 0 | |||||
| 2026-02-11 | 13F | Manchester Capital Management LLC | 0 | -100,00 | 0 | -100,00 | ||||
| 2025-11-13 | 13F | EntryPoint Capital, LLC | 0 | -100,00 | 0 | -100,00 | ||||
| 2026-02-13 | 13F | Manufacturers Life Insurance Company, The | 0 | -100,00 | 0 | |||||
| 2026-02-10 | 13F | Rock Creek Group, LP | 100.000 | 0,00 | 532 | 1,53 | ||||
| 2026-02-17 | 13F | Quantinno Capital Management LP | 39.683 | 211 | ||||||
| 2026-02-17 | 13F | Long Focus Capital Management, Llc | 337.504 | 0,00 | 1.796 | 1,53 | ||||
| 2026-02-12 | 13F | Swiss National Bank | 236.800 | 2,73 | 1.260 | 4,31 | ||||
| 2026-02-17 | 13F | Mill Road Capital Management LLC | 15.000 | 0,00 | 80 | 1,28 | ||||
| 2026-02-17 | 13F | Perritt Capital Management Inc | 0 | -100,00 | 0 | |||||
| 2026-01-30 | 13F | R Squared Ltd | 16.073 | 40,58 | 86 | 44,07 | ||||
| 2026-02-13 | 13F | Sei Investments Co | 562.734 | 2.994 | ||||||
| 2026-02-13 | 13F | Voss Capital, LLC | 3.949.990 | -31,90 | 21.014 | -30,86 | ||||
| 2026-02-09 | 13F | Legal & General Group Plc | 126.529 | -0,35 | 673 | 1,20 | ||||
| 2026-02-17 | 13F | Ameriprise Financial Inc | 0 | -100,00 | 0 | |||||
| 2026-02-19 | 13F | Invesco Ltd. | 80.014 | -7,03 | 426 | -5,56 | ||||
| 2026-02-02 | 13F | Equitable Trust Co | 220.152 | 0,00 | 1.171 | 1,56 | ||||
| 2026-02-17 | 13F | Disciplined Growth Investors Inc /mn | 7.918.934 | 7,71 | 42.129 | 9,36 | ||||
| 2026-02-12 | 13F | Jane Street Group, Llc | Call | 26.000 | 138 | |||||
| 2026-02-12 | 13F | Jane Street Group, Llc | 359.364 | 33,76 | 1.912 | 35,82 | ||||
| 2026-01-28 | 13F | Teacher Retirement System Of Texas | 0 | -100,00 | 0 | |||||
| 2026-02-13 | 13F | Barclays Plc | 329.774 | 9,44 | 1.754 | 11,15 | ||||
| 2026-04-21 | 13F | Clarus Group, Inc. | 25.790 | 26,69 | 79 | -26,85 | ||||
| 2026-04-02 | 13F/A | Soltis Investment Advisors LLC | 21.688 | -73,41 | 115 | -73,07 | ||||
| 2026-02-13 | 13F | Wells Fargo & Company/mn | 146.564 | 42,81 | 780 | 45,07 | ||||
| 2026-02-11 | 13F | Jpmorgan Chase & Co | 194.896 | -3,92 | 1.037 | -2,45 | ||||
| 2026-02-17 | 13F | MIRAE ASSET GLOBAL ETFS HOLDINGS Ltd. | 176.852 | -2,05 | 941 | -0,63 | ||||
| 2026-02-17 | 13F | California State Teachers Retirement System | 110.695 | -0,11 | 589 | 1,38 | ||||
| 2025-11-13 | 13F | Jump Financial, LLC | 0 | -100,00 | 0 | |||||
| 2026-02-13 | 13F | State Street Corp | 3.357.492 | -10,00 | 17.862 | -8,63 | ||||
| 2026-04-14 | 13F | Nbc Securities, Inc. | 3.000 | -76,92 | 9 | -86,96 | ||||
| 2026-02-17 | 13F | Ancora Advisors, LLC | 116.930 | 622 | ||||||
| 2026-02-17 | 13F | Canada Pension Plan Investment Board | 15.800 | 84 | ||||||
| 2026-02-10 | 13F | Clear Harbor Asset Management, LLC | 28.070 | 149 | ||||||
| 2026-01-29 | 13F | D.a. Davidson & Co. | 74.623 | -6,28 | 397 | -5,04 | ||||
| 2026-02-02 | 13F | Kornitzer Capital Management Inc /ks | 213.899 | 10,83 | 1.138 | 12,46 | ||||
| 2026-02-13 | 13F | Marshall Wace, Llp | 0 | -100,00 | 0 | |||||
| 2026-02-13 | 13F | Ubs Asset Management Americas Inc | 154.072 | 8,89 | 820 | 10,53 | ||||
| 2026-02-17 | 13F | Fmr Llc | 6.805 | 107,98 | 36 | 111,76 | ||||
| 2026-02-12 | 13F | New York State Common Retirement Fund | 34.800 | -12,34 | 185 | -11,06 | ||||
| 2026-02-13 | 13F | Kennedy Capital Management, Inc. | 1.970.918 | 292,34 | 10.485 | 298,37 | ||||
| 2026-02-11 | 13F | Simplex Trading, Llc | 1.467 | -93,97 | 8 | |||||
| 2025-11-21 | 13F/A | CIBC Bancorp USA Inc. | 13.251 | 69 | ||||||
| 2026-02-17 | 13F | Mercer Global Advisors Inc /adv | 11.818 | 63 | ||||||
| 2026-02-17 | 13F | Bayesian Capital Management, LP | 0 | -100,00 | 0 | |||||
| 2026-02-11 | 13F | Simplex Trading, Llc | Call | 18.500 | 386,84 | 98 | ||||
| 2026-02-04 | 13F | Argos Wealth Advisors, LLC | 52.491 | 279 | ||||||
| 2026-04-21 | 13F | Wasatch Advisors Inc | 2.241.729 | 39,95 | 6.905 | -18,98 | ||||
| 2026-02-17 | 13F | Jones Financial Companies Lllp | 1.600 | 0,00 | 9 | 0,00 | ||||
| 2026-02-17 | 13F | Optiver Holding B.V. | 1.028 | 0,00 | 5 | 0,00 | ||||
| 2026-01-23 | 13F | Sumitomo Mitsui Trust Holdings, Inc. | 16.848 | 90 | ||||||
| 2026-01-07 | 13F | Procyon Private Wealth Partners, LLC | 15.265 | 81 | ||||||
| 2026-02-11 | 13F | CenterBook Partners LP | 3.162.940 | -12,61 | 16.827 | -11,27 | ||||
| 2026-04-21 | 13F/A | Corsair Capital Management, L.p. | 0 | -100,00 | 0 | |||||
| 2026-02-17 | 13F | Northern Trust Corp | 1.018.439 | -7,06 | 5.418 | -5,63 | ||||
| 2026-02-02 | 13F | Oppenheimer Asset Management Inc. | 0 | -100,00 | 0 | |||||
| 2026-02-12 | 13F | Cibc World Markets Corp | 0 | -100,00 | 0 | |||||
| 2026-02-17 | 13F | Engineers Gate Manager LP | 59.428 | 316 | ||||||
| 2026-04-23 | 13F | North Star Investment Management Corp. | 296.600 | 21.085,71 | 914 | 12.942,86 | ||||
| 2026-02-13 | 13F | Focused Alpha, Llc | 108.030 | 575 | ||||||
| 2026-02-13 | 13F | Landscape Capital Management, L.l.c. | 14.245 | 0,00 | 76 | 1,35 | ||||
| 2026-02-13 | 13F | Squarepoint Ops LLC | 734.898 | -11,99 | 3.910 | -10,65 | ||||
| 2026-02-17 | 13F | XTX Topco Ltd | 24.855 | -44,58 | 132 | -43,59 | ||||
| 2026-04-17 | 13F | Krilogy Financial LLC | 17.285 | 61,08 | 57 | 0,00 |