Grundlæggende statistik
| Institutionelle aktier (lange) | 20.079.585 - 86,98% (ex 13D/G) - change of -7,42MM shares -26,99% MRQ |
| Institutionel værdi (lang) | $ 642.961 USD ($1000) |
Institutionelt ejerskab og aktionærer
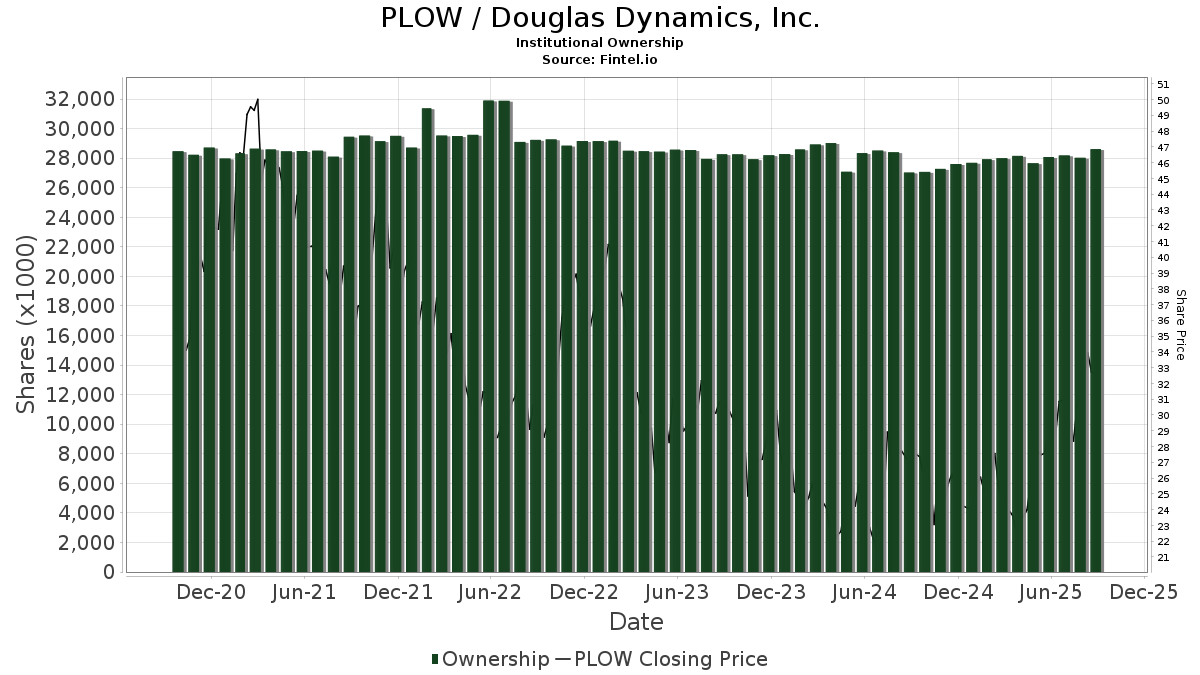
Douglas Dynamics, Inc. (US:PLOW) har 212 institutionelle ejere og aktionærer, der har indsendt 13D/G- eller 13F-formularer til Securities Exchange Commission (SEC). Disse institutioner har i alt 20,079,585 aktier. Største aktionærer omfatter Allspring Global Investments Holdings, LLC, BlackRock, Inc., Pzena Investment Management Llc, Vanguard Group Inc, Dimensional Fund Advisors Lp, Silvercrest Asset Management Group Llc, State Street Corp, Punch & Associates Investment Management, Inc., Geode Capital Management, Llc, and Ararat Capital Management, LP .
Douglas Dynamics, Inc. (NYSE:PLOW) institutionel ejerskabsstruktur viser aktuelle positioner i virksomheden efter institutioner og fonde, samt seneste ændringer i positionsstørrelse. Større aktionærer kan omfatte individuelle investorer, investeringsforeninger, hedgefonde eller institutioner. Skema 13D angiver, at investoren besidder (eller besidder) mere end 5 % af virksomheden og har til hensigt (eller har til hensigt at) aktivt at forfølge en ændring i forretningsstrategi. Skema 13G indikerer en passiv investering på over 5%.
The share price as of April 24, 2026 is 46,45 / share. Previously, on April 28, 2025, the share price was 24,06 / share. This represents an increase of 93,06% over that period.
Fondens stemningsscore
Fund Sentiment Score (fka Ownership Accumulation Score) finder de aktier, der bliver mest købt af fonde. Det er resultatet af en sofistikeret, multi-faktor kvantitativ model, der identificerer virksomheder med de højeste niveauer af institutionel akkumulering. Scoringsmodellen bruger en kombination af den samlede stigning i oplyste ejere, ændringerne i porteføljeallokeringer i disse ejere og andre målinger. Tallet går fra 0 til 100, hvor højere tal indikerer et højere niveau af akkumulering for sine jævnaldrende, og 50 er gennemsnittet.
Opdateringsfrekvens: Dagligt
Se Ownership Explorer, som giver en liste over højest rangerende virksomheder.
AI+ Ask Fintel’s AI assistant about Douglas Dynamics, Inc..
Select a question to share a public post with an AI-crafted answer.
Thinking of good questions…
Institutionel Put/Call-forhold
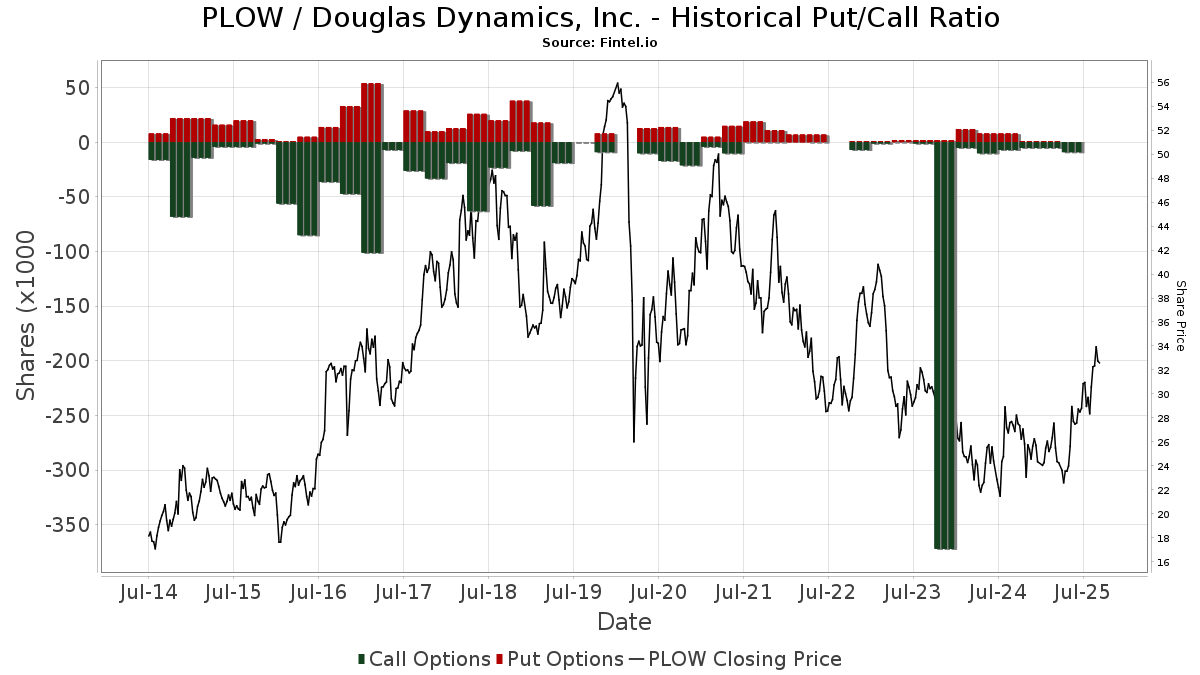
Ud over at indberette standardaktie- og gældsudstedelser skal institutter med mere end 100 mill. aktiver under forvaltning også oplyse deres put- og call-optionsbeholdninger. Da salgsoptioner generelt indikerer negativ stemning, og købsoptioner indikerer positiv stemning, kan vi få en fornemmelse af den overordnede institutionelle stemning ved at plotte forholdet mellem put og kald. Diagrammet til højre viser det historiske put/call-forhold for dette instrument.
Brug af Put/Call Ratio som en indikator for investorernes stemning overvinder en af de vigtigste mangler ved at bruge totalt institutionelt ejerskab, som er, at en betydelig mængde af aktiver under forvaltning investeres passivt for at spore indekser. Passivt forvaltede fonde køber typisk ikke optioner, så indikatoren for put/call-forholdet følger mere nøje følelsen af aktivt forvaltede fonde.
13D/G-arkivering
Vi præsenterer 13D/G ansøgninger separat fra 13F ansøgninger på grund af den forskellige behandling af SEC. 13D/G-ansøgninger kan indgives af grupper af investorer (med én ledende), hvorimod 13F-ansøgninger ikke kan. Dette resulterer i situationer, hvor en investor kan indsende en 13D/G, der rapporterer én værdi for de samlede aktier (der repræsenterer alle de aktier, der ejes af investorgruppen), men derefter indsender en 13F, der rapporterer en anden værdi for de samlede aktier (der udelukkende repræsenterer deres egne) ejendomsret). Det betyder, at aktieejerskab af 13D/G-arkiver og 13F-arkiveringer ofte ikke er direkte sammenlignelige, så vi præsenterer dem separat.
Bemærk: Fra den 16. maj 2021 viser vi ikke længere ejere, der ikke har indsendt en 13D/G inden for det seneste år. Tidligere viste vi den fulde historie af 13D/G-arkiver. Generelt skal enheder, der er forpligtet til at indgive 13D/G-ansøgninger, indgive mindst årligt, før de indsender en afsluttende ansøgning. Dog forlader fonde nogle gange positioner uden at indsende en afsluttende ansøgning (dvs. de afvikler), så visning af den fulde historie resulterede nogle gange i forvirring om det nuværende ejerskab. For at undgå forvirring viser vi nu kun 'aktuelle' ejere - det vil sige - ejere, der har anmeldt inden for det seneste år.
Upgrade to unlock premium data.
| Fil dato | Form | Investor | Forrige Aktier |
Seneste Aktier |
Δ Aktier (Procent) |
Ejendomsret (Procent) |
Δ Ejerskab (Procent) |
|
|---|---|---|---|---|---|---|---|---|
| 2026-04-17 | PZENA INVESTMENT MANAGEMENT LLC | 2,325,476 | 1,593,133 | -31.49 | 6.90 | -31.68 | ||
| 2026-04-14 | Allspring Global Investments Holdings, LLC | 2,371,391 | 2,058,359 | -13.20 | 8.90 | -13.76 | ||
| 2026-03-26 | VANGUARD GROUP INC | 1,353,360 | 0 | -100.00 | 0.00 | -100.00 |
13F og NPORT arkivering
Detaljer om 13F-arkivering er gratis. Detaljer om NP-ansøgninger kræver et premium-medlemskab. Grønne rækker angiver nye positioner. Røde rækker angiver lukkede positioner. Klik på linket ikon for at se den fulde transaktionshistorik.
Opgrader
for at låse premium-data op og eksportere til Excel ![]() .
.
| Fil dato | Kilde | Investor | Type | Gennemsnitlig pris (Øst) |
Aktier | Δ Aktier (%) |
Rapporteret Værdi ($1000) |
Δ Værdi (%) |
Port Alloc (%) |
|
|---|---|---|---|---|---|---|---|---|---|---|
| 2026-02-13 | 13F | Charles Schwab Investment Management Inc | 330.556 | 11,24 | 10.793 | 16,19 | ||||
| 2026-02-10 | 13F | Intech Investment Management Llc | 8.158 | -14,90 | 266 | -11,04 | ||||
| 2026-02-11 | 13F | Simplex Trading, Llc | 2.241 | 73 | ||||||
| 2025-11-14 | 13F | Alta Fox Capital Management, Llc | 0 | -100,00 | 0 | -100,00 | ||||
| 2026-02-11 | 13F | Simplex Trading, Llc | Call | 2.100 | 69 | |||||
| 2026-02-13 | 13F | Manufacturers Life Insurance Company, The | 0 | -100,00 | 0 | |||||
| 2026-02-09 | 13F | Royce & Associates Lp | 247.328 | -8,24 | 8.075 | -4,15 | ||||
| 2026-01-29 | 13F | Comerica Bank | 15.996 | 2,61 | 522 | 7,19 | ||||
| 2026-02-13 | 13F | American Century Companies Inc | 197.744 | -20,45 | 6.456 | -16,91 | ||||
| 2026-02-13 | 13F | First Trust Advisors Lp | 130.609 | 5,89 | 4.264 | 10,61 | ||||
| 2026-02-17 | 13F | Royal Bank Of Canada | 39.875 | -42,71 | 1.301 | -40,21 | ||||
| 2026-02-05 | 13F | Gamco Investors, Inc. Et Al | 90.893 | -6,51 | 2.968 | -2,37 | ||||
| 2026-02-17 | 13F | Canada Pension Plan Investment Board | 3.000 | 98 | ||||||
| 2026-01-14 | 13F | Hennion & Walsh Asset Management, Inc. | 13.833 | 83,88 | 452 | 91,91 | ||||
| 2026-02-12 | 13F | Jane Street Group, Llc | 32.071 | -69,89 | 1.047 | -68,55 | ||||
| 2026-02-17 | 13F | Tower Research Capital LLC (TRC) | 1.069 | 2,20 | 35 | 6,25 | ||||
| 2026-02-09 | 13F | Hartland & Co., LLC | 300 | 50,00 | 10 | 50,00 | ||||
| 2026-02-12 | 13F | Federated Hermes, Inc. | 151 | 20,80 | 5 | 33,33 | ||||
| 2026-02-13 | 13F | Police & Firemen's Retirement System of New Jersey | 6.257 | 0,00 | 204 | 4,62 | ||||
| 2026-04-24 | 13F | Root Financial Partners, LLC | 74 | 3 | ||||||
| 2026-02-12 | 13F | Systematic Alpha Investments, LLC | 14.000 | 0,00 | 457 | 4,58 | ||||
| 2025-11-13 | 13F | Jump Financial, LLC | 0 | -100,00 | 0 | |||||
| 2026-02-09 | 13F | Jefferies Financial Group Inc. | 0 | -100,00 | 0 | |||||
| 2026-02-04 | 13F | Pacific Ridge Capital Partners, LLC | 31.787 | 4,68 | 1.038 | 9,27 | ||||
| 2026-01-29 | 13F | UBS Group AG | 15.804 | -71,55 | 516 | -70,28 | ||||
| 2026-02-06 | 13F | Covestor Ltd | 1 | 0 | ||||||
| 2026-02-17 | 13F | Ameriprise Financial Inc | 38.487 | -39,96 | 1.257 | -37,29 | ||||
| 2026-02-17 | 13F | Dean Investment Associates, Llc | 20.217 | -74,06 | 660 | -72,91 | ||||
| 2026-02-05 | 13F | Allworth Financial LP | 86 | 405,88 | 3 | |||||
| 2026-02-17 | 13F | Boothbay Fund Management, Llc | 0 | -100,00 | 0 | |||||
| 2026-01-29 | 13F | Vanguard Group Inc | 1.478.522 | 0,37 | 48.274 | 4,83 | ||||
| 2026-02-13 | 13F | Arrowstreet Capital, Limited Partnership | 235.592 | 0,22 | 7.692 | 4,68 | ||||
| 2025-11-13 | 13F | Marshall Wace, Llp | 65.085 | -14,70 | 2.035 | -9,52 | ||||
| 2026-04-09 | 13F | Tompkins Financial Corp | 2.000 | 0,00 | 84 | 29,23 | ||||
| 2026-02-12 | 13F | BlackRock, Inc. | 1.787.572 | 2,06 | 58.364 | 6,60 | ||||
| 2026-02-05 | 13F | Gabelli Funds Llc | 108.034 | 2,74 | 3.527 | 7,30 | ||||
| 2026-02-19 | 13F | Mcguire Capital Advisors Inc | 500 | 16 | ||||||
| 2026-01-28 | 13F | Klp Kapitalforvaltning As | 4.700 | 0,00 | 153 | 4,79 | ||||
| 2026-04-08 | 13F | NorthCrest Asset Manangement, LLC | 11.129 | 0,32 | 466 | 24,60 | ||||
| 2026-02-13 | 13F | Panagora Asset Management Inc | 9.802 | 320 | ||||||
| 2026-02-17 | 13F | Aster Capital Management (DIFC) Ltd | 120 | 4 | ||||||
| 2026-04-08 | 13F | Wealth Enhancement Advisory Services, Llc | 14.146 | 524,27 | 126 | 34,04 | ||||
| 2026-02-17 | 13F | Russell Investments Group, Ltd. | 219.822 | -2,64 | 7.177 | 1,69 | ||||
| 2026-02-17 | 13F | Kemnay Advisory Services Inc. | 2.776 | 91 | ||||||
| 2026-02-13 | 13F | Y-Intercept (Hong Kong) Ltd | 40.688 | 47,19 | 1.328 | 53,70 | ||||
| 2026-02-05 | 13F | Plante Moran Financial Advisors, LLC | 295 | 10 | ||||||
| 2026-02-13 | 13F | Citigroup Inc | 892 | -64,65 | 29 | -62,82 | ||||
| 2026-02-17 | 13F | Magnetar Financial LLC | 8.633 | 282 | ||||||
| 2026-02-17 | 13F | Price T Rowe Associates Inc /md/ | 21.652 | 4,59 | 1 | |||||
| 2026-04-23 | 13F | MQS Management LLC | 7.270 | -10,93 | 306 | 14,66 | ||||
| 2026-04-13 | 13F | IFP Advisors, Inc | 9 | 0,00 | 0 | |||||
| 2026-02-09 | 13F | Harbour Investments, Inc. | 239 | 0,00 | 8 | 0,00 | ||||
| 2026-02-06 | 13F | Pnc Financial Services Group, Inc. | 2.609 | 18,11 | 85 | 23,19 | ||||
| 2026-02-17 | 13F | Two Sigma Advisers, Lp | 13.314 | -6,33 | 435 | -2,25 | ||||
| 2026-04-14 | 13F | Nbc Securities, Inc. | 428 | -13,88 | 18 | 12,50 | ||||
| 2026-02-17 | 13F | Blair William & Co/il | 6.214 | 203 | ||||||
| 2026-02-17 | 13F | Bank Of America Corp /de/ | 271.835 | -12,24 | 8.875 | -8,34 | ||||
| 2026-02-17 | 13F | Qube Research & Technologies Ltd | 123.929 | 19,42 | 4.046 | 24,76 | ||||
| 2026-02-13 | 13F | Pathstone Holdings, LLC | 12.693 | -40,80 | 414 | -38,21 | ||||
| 2026-02-04 | 13F | Provident Investment Management, Inc. | 28.935 | 945 | ||||||
| 2026-02-12 | 13F | Wealthspire Advisors, LLC | 0 | -100,00 | 0 | |||||
| 2026-02-17 | 13F | Advisor Group Holdings, Inc. | 662 | -71,88 | 22 | -72,73 | ||||
| 2026-04-23 | 13F | Lakewood Asset Management LLC | 5.311 | 224 | ||||||
| 2026-02-17 | 13F | Monimus Capital Management, Lp | 60.152 | -43,61 | 1.964 | -41,12 | ||||
| 2026-02-17 | 13F | Alliancebernstein L.p. | 17.360 | 0,00 | 567 | 4,43 | ||||
| 2026-02-17 | 13F | Silvercrest Asset Management Group Llc | 641.149 | -5,92 | 20.934 | -1,74 | ||||
| 2026-02-13 | 13F | Barclays Plc | 57.184 | 8,81 | 1.867 | 13,70 | ||||
| 2026-04-07 | 13F | CoreCap Advisors, LLC | 4 | 0 | ||||||
| 2026-01-15 | 13F | Nisa Investment Advisors, Llc | 98 | 0,00 | 3 | 0,00 | ||||
| 2026-02-17 | 13F | Schonfeld Strategic Advisors LLC | 8.057 | 263 | ||||||
| 2026-04-24 | 13F | Pzena Investment Management Llc | 1.593.133 | -25,09 | 67.055 | -3,43 | ||||
| 2026-02-13 | 13F | Verition Fund Management LLC | 14.559 | 475 | ||||||
| 2026-02-17 | 13F | Man Group plc | 7.742 | 253 | ||||||
| 2026-02-13 | 13F | Stifel Financial Corp | 8.411 | 10,82 | 275 | 15,61 | ||||
| 2026-02-09 | 13F | Geode Capital Management, Llc | 535.981 | -0,74 | 17.503 | 3,67 | ||||
| 2026-02-17 | 13F | Creative Planning | 6.617 | 216 | ||||||
| 2026-01-30 | 13F | New York State Teachers Retirement System | 2.070 | 0,00 | 0 | |||||
| 2026-02-13 | 13F | Ranger Investment Management, L.P. | 261.495 | -6,77 | 8.538 | -2,62 | ||||
| 2026-02-12 | 13F | Campbell & CO Investment Adviser LLC | 37.742 | 111,49 | 1.232 | 121,18 | ||||
| 2026-02-17 | 13F | Algert Global Llc | 280.047 | 9 | ||||||
| 2026-02-17 | 13F | Janus Henderson Group Plc | 79.494 | -31,72 | 2.596 | -28,69 | ||||
| 2026-04-22 | 13F | BluePath Capital Management, LLC | 30.501 | -7,88 | 1.284 | 18,69 | ||||
| 2026-02-11 | 13F | Jpmorgan Chase & Co | 302.437 | -2,80 | 9.875 | 1,51 | ||||
| 2026-02-13 | 13F | State Street Corp | 629.795 | 0,45 | 20.563 | 4,91 | ||||
| 2026-02-11 | 13F | Group One Trading, L.p. | Call | 700 | 250,00 | 23 | 266,67 | |||
| 2026-02-14 | 13F | Rockefeller Capital Management L.P. | 487 | 616,18 | 16 | 650,00 | ||||
| 2026-02-13 | 13F | Squarepoint Ops LLC | 12.483 | 408 | ||||||
| 2026-02-12 | 13F | Steward Partners Investment Advisory, Llc | 1.043 | 0,00 | 34 | 6,25 | ||||
| 2026-01-30 | 13F | Us Bancorp \de\ | 2.990 | -0,13 | 98 | 4,30 | ||||
| 2026-02-17 | 13F | Tudor Investment Corp Et Al | 119.363 | 3,17 | 3.897 | 7,77 | ||||
| 2026-02-11 | 13F | Inceptionr Llc | 11.516 | 376 | ||||||
| 2026-02-13 | 13F | BNP Paribas Asset Management Holding S.A. | 559 | 35,68 | 0 | |||||
| 2025-10-30 | 13F | Twin Peaks Wealth Advisors, LLC | 0 | -100,00 | 0 | |||||
| 2026-02-12 | 13F | Dimensional Fund Advisors Lp | 974.951 | -0,85 | 31.833 | 3,56 | ||||
| 2026-02-13 | 13F | Bollard Group LLC | 922 | 0,88 | 0 | |||||
| 2026-02-12 | 13F | Nuveen, LLC | 349.929 | 485,31 | 11.425 | 511,62 | ||||
| 2026-02-06 | 13F | Legato Capital Management LLC | 7.269 | -81,95 | 237 | -81,16 | ||||
| 2026-02-17 | 13F | Ararat Capital Management, LP | 457.720 | 5,22 | 14.945 | 9,90 | ||||
| 2026-02-18 | 13F | Vident Advisory, LLC | 0 | -100,00 | 0 | |||||
| 2026-01-29 | 13F | Sanctuary Advisors, LLC | 20.589 | 2,81 | 672 | 7,35 | ||||
| 2026-02-17 | 13F | Aquatic Capital Management LLC | 7.685 | 7,26 | 251 | 12,11 | ||||
| 2026-02-13 | 13F | Epoch Investment Partners, Inc. | 23.136 | -18,16 | 755 | -14,50 | ||||
| 2026-02-10 | 13F | Bank of New York Mellon Corp | 231.857 | -14,96 | 7.570 | -11,18 | ||||
| 2026-02-13 | 13F | Baird Financial Group, Inc. | 11.953 | -7,48 | 390 | -3,23 | ||||
| 2026-02-10 | 13F | Hillsdale Investment Management Inc. | 139.500 | 3,79 | 4.555 | 8,40 | ||||
| 2026-02-13 | 13F | Prudential Financial Inc | 170.867 | -1,27 | 5.579 | 3,12 | ||||
| 2026-02-17 | 13F | Quantinno Capital Management LP | 22.913 | 0,22 | 748 | 4,76 | ||||
| 2026-04-16 | 13F | Ellsworth Advisors, LLC | 24.659 | -1,04 | 1.038 | 12,84 | ||||
| 2026-02-17 | 13F | Gumshoe Capital Management LLC | 77.995 | 2.547 | ||||||
| 2026-02-05 | 13F | Amalgamated Bank | 712 | -8,48 | 0 | |||||
| 2026-01-30 | 13F | R Squared Ltd | 9.559 | 312 | ||||||
| 2026-02-09 | 13F | Systematic Financial Management Lp | 334.028 | 7,76 | 10.906 | 12,56 | ||||
| 2026-02-13 | 13F | Smartleaf Asset Management LLC | 1 | 0 | ||||||
| 2026-02-13 | 13F | Ieq Capital, Llc | 9.730 | -13,73 | 318 | -9,94 | ||||
| 2026-02-12 | 13F | Triumph Capital Management | 73 | 0,00 | 2 | 0,00 | ||||
| 2026-04-06 | 13F | Versant Capital Management, Inc | 1.309 | 0,00 | 55 | 30,95 | ||||
| 2026-02-13 | 13F | Parkside Financial Bank & Trust | 60 | 0,00 | 2 | 0,00 | ||||
| 2026-02-13 | 13F | Segall Bryant & Hamill, Llc | 87.995 | -0,08 | 2.873 | 4,40 | ||||
| 2026-02-13 | 13F | Dynamic Technology Lab Private Ltd | 0 | -100,00 | 0 | -100,00 | ||||
| 2026-02-12 | 13F | Integrated Quantitative Investments LLC | 0 | -100,00 | 0 | |||||
| 2026-02-17 | 13F | T. Rowe Price Investment Management, Inc. | 299.307 | -64,65 | 10 | -65,38 | ||||
| 2026-04-24 | 13F | Strs Ohio | 3.200 | -82,42 | 135 | -62,25 | ||||
| 2026-01-28 | 13F | Universal- Beteiligungs- und Servicegesellschaft mbH | 8.002 | 261 | ||||||
| 2026-01-28 | 13F | Teacher Retirement System Of Texas | 36.700 | -58,82 | 1.198 | -57,00 | ||||
| 2026-02-17 | 13F | MIRAE ASSET GLOBAL ETFS HOLDINGS Ltd. | 10.483 | 0,80 | 342 | 5,23 | ||||
| 2026-02-06 | 13F | EverSource Wealth Advisors, LLC | 1.380 | 9,00 | 45 | 15,38 | ||||
| 2026-02-12 | 13F | Swiss National Bank | 45.000 | 0,00 | 1.469 | 4,48 | ||||
| 2026-02-13 | 13F | Wells Fargo & Company/mn | 66.800 | 177,12 | 2.181 | 189,64 | ||||
| 2026-01-14 | 13F | USA Financial Portformulas Corp | 0 | -100,00 | 0 | |||||
| 2026-02-12 | 13F | Quadrant Capital Group Llc | 21 | 0,00 | 1 | |||||
| 2026-02-17 | 13F | Citadel Advisors Llc | 63.374 | 251,88 | 2.069 | 268,15 | ||||
| 2026-02-20 | 13F | Dean Capital Management | 13.770 | -78,59 | 450 | -77,66 | ||||
| 2025-11-14 | 13F | Oxford Asset Management Llp | 12.366 | 387 | ||||||
| 2026-02-12 | 13F | New York State Common Retirement Fund | 7.490 | 0,00 | 245 | 4,27 | ||||
| 2026-02-17 | 13F | Lazard Asset Management Llc | 66.903 | 2.184 | ||||||
| 2026-03-06 | 13F | Hsbc Holdings Plc | 17.771 | 101,33 | 582 | 111,64 | ||||
| 2026-02-13 | 13F | SRS Capital Advisors, Inc. | 6 | -99,14 | 0 | -100,00 | ||||
| 2025-11-12 | 13F/A | Norges Bank | 26.100 | -48,62 | 720 | -39,48 | ||||
| 2026-04-20 | 13F | State of Alaska, Department of Revenue | 3.175 | 0,00 | 0 | |||||
| 2026-02-13 | 13F | Quarry LP | 117 | 4 | ||||||
| 2025-10-27 | 13F | First Horizon Corp | 0 | -100,00 | 0 | |||||
| 2026-02-17 | 13F | nVerses Capital, LLC | 9.057 | 296 | ||||||
| 2026-04-23 | 13F | Harbor Investment Advisory, Llc | 0 | -100,00 | 0 | |||||
| 2026-02-11 | 13F | Ameritas Investment Partners, Inc. | 1.893 | 62 | ||||||
| 2026-02-17 | 13F | Point72 Asset Management, L.P. | 87.893 | 383,89 | 2.870 | 406,00 | ||||
| 2026-04-07 | 13F | Signaturefd, Llc | 260 | 0,00 | 11 | 25,00 | ||||
| 2026-02-10 | 13F | Rothschild Investment Llc | 66 | 1,54 | 2 | 0,00 | ||||
| 2026-02-12 | 13F | CIBC Private Wealth Group, LLC | 365 | -69,68 | 12 | -70,27 | ||||
| 2026-02-17 | 13F | Aqr Capital Management Llc | 101.090 | -3,34 | 3.301 | 0,95 | ||||
| 2026-04-14 | 13F | West Branch Capital LLC | 800 | 0,00 | 34 | 26,92 | ||||
| 2026-02-17 | 13F | California State Teachers Retirement System | 21.303 | -0,08 | 696 | 4,35 | ||||
| 2026-04-13 | 13F | True Wealth Design, LLC | 227 | 0,00 | 10 | 28,57 | ||||
| 2026-02-11 | 13F | Parallel Advisors, LLC | 13 | 0 | ||||||
| 2026-02-17 | 13F | Engineers Gate Manager LP | 19.002 | -4,33 | 620 | 0,00 | ||||
| 2026-02-10 | 13F | Quantbot Technologies LP | 5.887 | -58,82 | 192 | -56,95 | ||||
| 2026-02-17 | 13F | Polymer Capital Management (US) LLC | 9.809 | 320 | ||||||
| 2026-02-09 | 13F | Legal & General Group Plc | 22.524 | -16,38 | 735 | -12,60 | ||||
| 2026-02-17 | 13F | Jones Financial Companies Lllp | 0 | -100,00 | 0 | |||||
| 2026-02-13 | 13F | Great West Life Assurance Co /can/ | 5.604 | 20,62 | 0 | |||||
| 2026-02-17 | 13F | Northern Trust Corp | 204.769 | -3,91 | 6.686 | 0,36 | ||||
| 2026-02-12 | 13F | Commonwealth Equity Services, Llc | 20.174 | 0,53 | 659 | |||||
| 2025-11-06 | 13F | D.B. Root & Company, LLC | 0 | -100,00 | 0 | |||||
| 2026-02-17 | 13F | Susquehanna International Group, Llp | 71.948 | 746,05 | 2.349 | 786,42 | ||||
| 2026-02-18 | 13F | EP Wealth Advisors, Inc. | 10.080 | -1,43 | 329 | 9,30 | ||||
| 2026-02-13 | 13F | Caitong International Asset Management Co., Ltd | 0 | -100,00 | 0 | |||||
| 2026-02-20 | 13F | Sunbelt Securities, Inc. | 0 | -100,00 | 0 | |||||
| 2026-02-18 | 13F | GWM Advisors LLC | 6.287 | 205 | ||||||
| 2026-02-17 | 13F | Advisory Services Network, LLC | 0 | -100,00 | 0 | |||||
| 2026-04-06 | 13F | GAMMA Investing LLC | 1.007 | 27,31 | 42 | 68,00 | ||||
| 2026-01-27 | 13F | TD Waterhouse Canada Inc. | 0 | -100,00 | 0 | |||||
| 2026-02-17 | 13F | Punch & Associates Investment Management, Inc. | 614.706 | -0,02 | 20.070 | 4,43 | ||||
| 2026-02-17 | 13F | Sovereign's Capital Management, LLC | 128.823 | -18,82 | 4.206 | -15,20 | ||||
| 2026-04-22 | 13F | Janney Montgomery Scott LLC | 31.145 | 2,43 | 1 | |||||
| 2026-01-26 | 13F | Whittier Trust Co | 2.450 | 0,00 | 86 | 11,84 | ||||
| 2026-02-12 | 13F | State Board Of Administration Of Florida Retirement System | 6.436 | 0,00 | 210 | 4,48 | ||||
| 2026-02-11 | 13F | Deutsche Bank Ag\ | 15.316 | -34,09 | 500 | -31,13 | ||||
| 2025-11-14 | 13F | Point72 (DIFC) Ltd | 0 | -100,00 | 0 | |||||
| 2026-02-10 | 13F | State of Wyoming | 2.122 | 2,76 | 69 | 7,81 | ||||
| 2026-02-06 | 13F | Gsa Capital Partners Llp | 24.317 | -59,65 | 1 | -100,00 | ||||
| 2026-01-30 | 13F | ARGA Investment Management, LP | 16.386 | 0,00 | 535 | 4,49 | ||||
| 2026-02-13 | 13F | Morgan Stanley | 183.242 | 25,28 | 5.983 | 30,84 | ||||
| 2026-02-17 | 13F | Raymond James Financial Inc | 17.943 | -13,60 | 586 | -9,86 | ||||
| 2025-11-14 | 13F | Cubist Systematic Strategies, LLC | 76.276 | 392,10 | 2.384 | 422,81 | ||||
| 2026-02-13 | 13F | Ubs Asset Management Americas Inc | 73.933 | -0,59 | 2.414 | 3,83 | ||||
| 2026-02-12 | 13F | MetLife Investment Management, LLC | 13.076 | 0,00 | 427 | 4,41 | ||||
| 2026-02-13 | 13F | Virtus ETF Advisers LLC | 15.250 | 0,00 | 498 | 4,41 | ||||
| 2026-04-21 | 13F | Olstein Capital Management, L.P. | 17.543 | -41,52 | 1 | |||||
| 2025-11-14 | 13F | Citadel Advisors Llc | Call | 0 | -100,00 | 0 | -100,00 | |||
| 2026-02-17 | 13F | Brevan Howard Capital Management LP | 0 | -100,00 | 0 | |||||
| 2026-01-27 | 13F | Zurcher Kantonalbank (Zurich Cantonalbank) | 6.953 | 0,00 | 227 | 4,61 | ||||
| 2026-02-11 | 13F | Mcmorgan & Co Llc | 8.367 | -85,17 | 273 | -84,52 | ||||
| 2026-04-22 | 13F | 1492 Capital Management LLC | 88.702 | 4,00 | 3.733 | 34,09 | ||||
| 2026-02-13 | 13F | Rhumbline Advisers | 28.777 | -15,50 | 940 | -11,75 | ||||
| 2026-02-03 | 13F | McIlrath & Eck, LLC | 2.538 | 0,00 | 83 | 3,80 | ||||
| 2026-02-17 | 13F | Atom Investors LP | 46.632 | -4,16 | 1.523 | 0,07 | ||||
| 2026-04-13 | 13F | Wedge Capital Management L L P/nc | 51.396 | -24,58 | 2.163 | -2,79 | ||||
| 2026-04-16 | 13F | SG Americas Securities, LLC | 56.916 | 47,33 | 2 | 100,00 | ||||
| 2026-02-11 | 13F | Allianz Asset Management GmbH | 21.737 | 710 | ||||||
| 2026-04-23 | 13F | TFC Financial Management | 1 | 0,00 | 0 | |||||
| 2026-04-07 | 13F | Farther Finance Advisors, LLC | 28 | 7,69 | 1 | |||||
| 2026-02-03 | 13F | SBI Securities Co., Ltd. | 9 | -18,18 | 0 | |||||
| 2026-02-17 | 13F | Fmr Llc | 2.295 | 36,44 | 75 | 42,31 | ||||
| 2026-02-13 | 13F | Rice Hall James & Associates, Llc | 54.732 | -2,42 | 1.787 | 1,94 | ||||
| 2026-02-17 | 13F | Df Dent & Co Inc | 0 | -100,00 | 0 | |||||
| 2026-02-17 | 13F | Two Sigma Investments, Lp | 26.098 | 35,95 | 852 | 42,00 | ||||
| 2026-04-20 | 13F | Ronald Blue Trust, Inc. | 450 | 0,00 | 19 | 28,57 | ||||
| 2026-04-23 | 13F | Oppenheimer Asset Management Inc. | 0 | -100,00 | 0 | |||||
| 2026-01-26 | 13F | Cwm, Llc | 6.546 | -3,42 | 0 | |||||
| 2026-02-13 | 13F | MAI Capital Management | 199 | 6 | ||||||
| 2026-02-12 | 13F | Renaissance Technologies Llc | 0 | -100,00 | 0 | |||||
| 2026-02-06 | 13F | Tortoise Investment Management, LLC | 0 | -100,00 | 0 | |||||
| 2026-02-10 | 13F | Goldman Sachs Group Inc | 322.284 | -11,03 | 10.523 | -7,07 | ||||
| 2026-04-20 | 13F | Kestra Private Wealth Services, Llc | 24.242 | 1,13 | 1.020 | 30,43 | ||||
| 2026-02-17 | 13F | Optiver Holding B.V. | 134 | 0,00 | 4 | 0,00 | ||||
| 2026-02-03 | 13F | Wilson Asset Management (international) Pty Ltd | 20.000 | 653 | ||||||
| 2026-02-04 | 13F | Bailard, Inc. | 8.700 | 0,00 | 284 | 4,80 | ||||
| 2026-02-04 | 13F | Versor Investments LP | 27.779 | 23,37 | 907 | 28,88 | ||||
| 2026-02-11 | 13F | Los Angeles Capital Management Llc | 11.154 | 0,00 | 343 | -1,72 | ||||
| 2026-02-10 | 13F | Globeflex Capital L P | 81.017 | 0,00 | 2.645 | 4,46 | ||||
| 2026-02-17 | 13F | Cetera Investment Advisers | 12.176 | -3,37 | 398 | 1,02 | ||||
| 2026-02-19 | 13F | Invesco Ltd. | 45.840 | -7,06 | 1.497 | -2,92 | ||||
| 2025-11-12 | 13F | Simplex Trading, Llc | Put | 0 | -100,00 | 0 | ||||
| 2026-02-10 | 13F | Envestnet Asset Management Inc | 18.127 | -2,17 | 592 | 2,07 | ||||
| 2026-01-15 | 13F | Allspring Global Investments Holdings, LLC | 2.394.617 | -1,58 | 78.998 | 3,93 | ||||
| 2026-02-17 | 13F | Hotchkis & Wiley Capital Management Llc | 207.244 | 0,00 | 6.767 | 4,45 | ||||
| 2026-02-06 | 13F | First Business Financial Services, Inc. | 0 | -100,00 | 0 | |||||
| 2026-02-17 | 13F | Millennium Management Llc | 65.266 | 277,57 | 2.131 | 294,44 | ||||
| 2026-02-11 | 13F | Franklin Resources Inc | 10.797 | -73,71 | 353 | -72,56 | ||||
| 2026-02-13 | 13F | Victory Capital Management Inc | 26.700 | -4,64 | 872 | -0,46 | ||||
| 2026-02-06 | 13F | Lsv Asset Management | 77.303 | 0,00 | 3 | 0,00 | ||||
| 2026-02-10 | 13F | Bnp Paribas Arbitrage, Sa | 32.210 | -19,67 | 1.052 | -16,12 | ||||
| 2026-01-28 | 13F | Arizona State Retirement System | 6.418 | -6,54 | 210 | -2,34 | ||||
| 2026-02-17 | 13F | Public Employees Retirement System Of Ohio | 567 | -6,90 | 19 | -5,26 | ||||
| 2026-02-18 | 13F | Mackenzie Financial Corp | 0 | -100,00 | 0 | |||||
| 2026-02-02 | 13F | Principal Financial Group Inc | 28.265 | 43,56 | 923 | 49,92 | ||||
| 2025-11-14 | 13F | Invenomic Capital Management LP | 0 | -100,00 | 0 | -100,00 | ||||
| 2026-01-20 | 13F | Harbor Capital Advisors, Inc. | 96.525 | -8,66 | 3 | 0,00 | ||||
| 2026-02-09 | 13F | Quest Partners LLC | 22.594 | -11,22 | 738 | -7,30 | ||||
| 2026-02-17 | 13F | Graham Capital Management, L.P. | 6.624 | -17,14 | 216 | -13,25 | ||||
| 2026-04-22 | 13F | Sterling Capital Management LLC | 226 | -26,62 | 10 | -10,00 | ||||
| 2026-01-26 | 13F | Private Trust Co Na | 555 | 18 | ||||||
| 2026-04-16 | 13F | Annex Advisory Services, LLC | 6.115 | -29,51 | 257 | -9,19 | ||||
| 2026-02-13 | 13F | Sei Investments Co | 188.917 | 167,02 | 6.168 | 178,97 |
Other Listings
| DE:5D4 | 39,40 € |