Grundlæggende statistik
| Institutionelle ejere | 240 total, 240 long only, 0 short only, 0 long/short - change of -2,03% MRQ |
| Gennemsnitlig porteføljeallokering | 0.1572 % - change of -16,42% MRQ |
| Institutionelle aktier (lange) | 4.858.876 (ex 13D/G) - change of -0,03MM shares -0,55% MRQ |
| Institutionel værdi (lang) | $ 632.246 USD ($1000) |
Institutionelt ejerskab og aktionærer
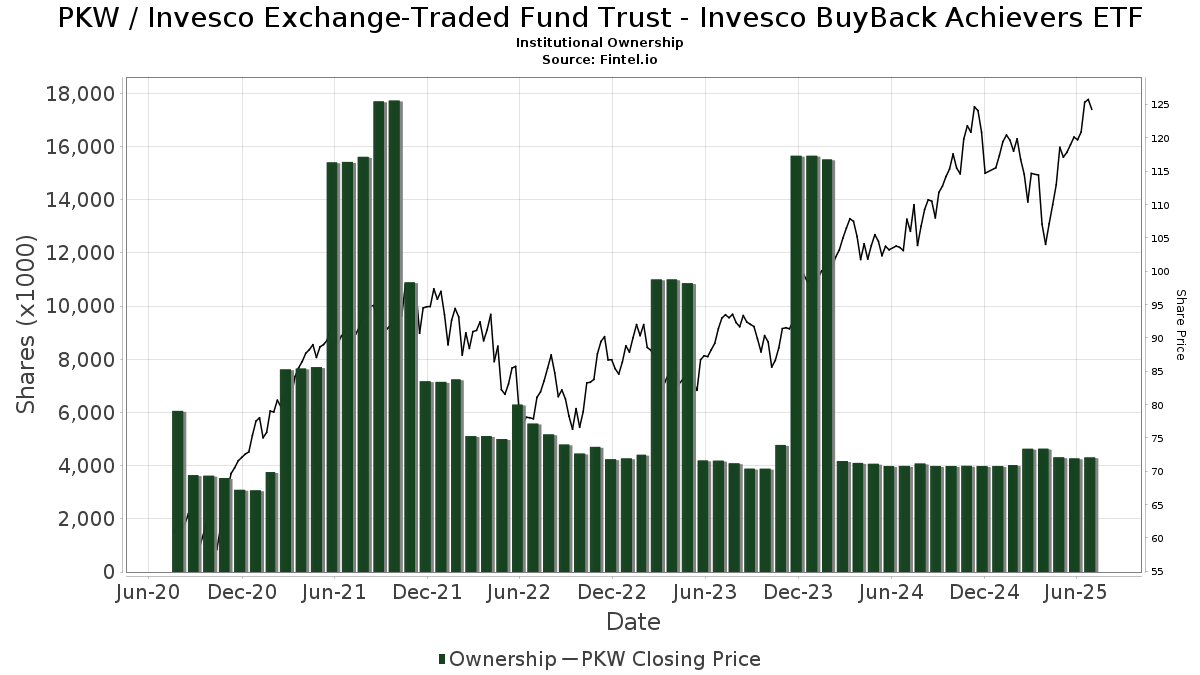
Invesco Exchange-Traded Fund Trust - Invesco BuyBack Achievers ETF (US:PKW) har 240 institutionelle ejere og aktionærer, der har indsendt 13D/G- eller 13F-formularer til Securities Exchange Commission (SEC). Disse institutioner har i alt 4,858,876 aktier. Største aktionærer omfatter Bank Of America Corp /de/, LPL Financial LLC, Wells Fargo & Company/mn, Morgan Stanley, Raymond James Financial Inc, UBS Group AG, Cambridge Investment Research Advisors, Inc., Curtis Advisory Group, LLC, Mariner, LLC, and Triton Wealth Management, PLLC .
Invesco Exchange-Traded Fund Trust - Invesco BuyBack Achievers ETF (NasdaqGM:PKW) institutionel ejerskabsstruktur viser aktuelle positioner i virksomheden efter institutioner og fonde, samt seneste ændringer i positionsstørrelse. Større aktionærer kan omfatte individuelle investorer, investeringsforeninger, hedgefonde eller institutioner. Skema 13D angiver, at investoren besidder (eller besidder) mere end 5 % af virksomheden og har til hensigt (eller har til hensigt at) aktivt at forfølge en ændring i forretningsstrategi. Skema 13G indikerer en passiv investering på over 5%.
The share price as of February 20, 2026 is 139,41 / share. Previously, on February 24, 2025, the share price was 116,96 / share. This represents an increase of 19,19% over that period.
Fondens stemningsscore
Fund Sentiment Score (fka Ownership Accumulation Score) finder de aktier, der bliver mest købt af fonde. Det er resultatet af en sofistikeret, multi-faktor kvantitativ model, der identificerer virksomheder med de højeste niveauer af institutionel akkumulering. Scoringsmodellen bruger en kombination af den samlede stigning i oplyste ejere, ændringerne i porteføljeallokeringer i disse ejere og andre målinger. Tallet går fra 0 til 100, hvor højere tal indikerer et højere niveau af akkumulering for sine jævnaldrende, og 50 er gennemsnittet.
Opdateringsfrekvens: Dagligt
Se Ownership Explorer, som giver en liste over højest rangerende virksomheder.
AI+ Ask Fintel’s AI assistant about Invesco Exchange-Traded Fund Trust - Invesco BuyBack Achievers ETF.
Select a question to share a public post with an AI-crafted answer.
Thinking of good questions…
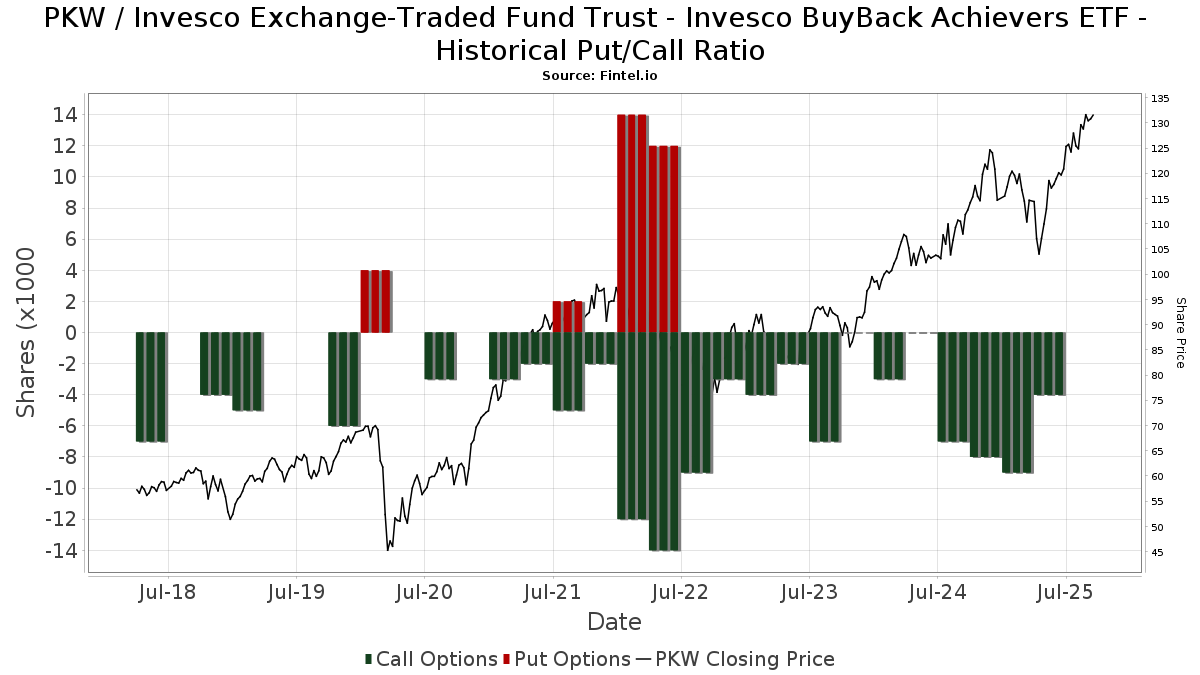
Institutionel Put/Call-forhold
Ud over at indberette standardaktie- og gældsudstedelser skal institutter med mere end 100 mill. aktiver under forvaltning også oplyse deres put- og call-optionsbeholdninger. Da salgsoptioner generelt indikerer negativ stemning, og købsoptioner indikerer positiv stemning, kan vi få en fornemmelse af den overordnede institutionelle stemning ved at plotte forholdet mellem put og kald. Diagrammet til højre viser det historiske put/call-forhold for dette instrument.
Brug af Put/Call Ratio som en indikator for investorernes stemning overvinder en af de vigtigste mangler ved at bruge totalt institutionelt ejerskab, som er, at en betydelig mængde af aktiver under forvaltning investeres passivt for at spore indekser. Passivt forvaltede fonde køber typisk ikke optioner, så indikatoren for put/call-forholdet følger mere nøje følelsen af aktivt forvaltede fonde.
13F og NPORT arkivering
Detaljer om 13F-arkivering er gratis. Detaljer om NP-ansøgninger kræver et premium-medlemskab. Grønne rækker angiver nye positioner. Røde rækker angiver lukkede positioner. Klik på linket ikon for at se den fulde transaktionshistorik.
Opgrader
for at låse premium-data op og eksportere til Excel ![]() .
.
| Fil dato | Kilde | Investor | Type | Gennemsnitlig pris (Øst) |
Aktier | Δ Aktier (%) |
Rapporteret Værdi ($1000) |
Δ Værdi (%) |
Port Alloc (%) |
|
|---|---|---|---|---|---|---|---|---|---|---|
| 2026-02-02 | 13F | Fifth Third Bancorp | 750 | 0,00 | 101 | 1,01 | ||||
| 2026-02-05 | 13F | Cambridge Investment Research Advisors, Inc. | 83.315 | 12,73 | 11 | 22,22 | ||||
| 2026-02-19 | 13F | CI Private Wealth, LLC | 9.003 | 0,02 | 1.209 | 1,43 | ||||
| 2026-02-11 | 13F | Tradition Wealth Management, LLC | 9.233 | -0,41 | 1.240 | 0,98 | ||||
| 2026-01-30 | 13F | Smart Portfolios, LLC | 22.750 | 23,66 | 3.056 | 25,36 | ||||
| 2026-02-10 | 13F | Lido Advisors, LLC | 2.066 | 0,00 | 274 | 0,00 | ||||
| 2026-01-22 | 13F | Vista Investment Partners Ii, Llc | 0 | -100,00 | 0 | -100,00 | ||||
| 2026-02-17 | 13F | Mercer Global Advisors Inc /adv | 7.455 | 0,73 | 1.001 | 2,14 | ||||
| 2026-01-23 | 13F | Freestone Capital Holdings, LLC | 0 | -100,00 | 0 | |||||
| 2026-02-17 | 13F | NorthRock Partners, LLC | 5.000 | -0,02 | 672 | 1,36 | ||||
| 2026-02-13 | 13F | MAI Capital Management | 5.948 | 5,05 | 799 | 6,40 | ||||
| 2025-11-14 | 13F | Jane Street Group, Llc | 0 | -100,00 | 0 | -100,00 | ||||
| 2026-02-06 | 13F | Global Retirement Partners, LLC | 567 | 0,00 | 76 | 1,33 | ||||
| 2026-01-26 | 13F | Main Street Group, LTD | 0 | -100,00 | 0 | |||||
| 2026-01-16 | 13F | Park Edge Advisors, LLC | 0 | -100,00 | 0 | |||||
| 2026-02-10 | 13F | Thoroughbred Financial Services, Llc | 36.362 | 0,86 | 5 | 0,00 | ||||
| 2025-11-14 | 13F | Gts Securities Llc | 0 | -100,00 | 0 | -100,00 | ||||
| 2026-02-17 | 13F | Equitable Holdings, Inc. | 43.939 | -3,13 | 5.902 | -1,78 | ||||
| 2026-02-18 | 13F | Hershey Financial Advisers, LLC | 0 | -100,00 | 0 | |||||
| 2026-02-17 | 13F | Bank Of America Corp /de/ | 865.959 | 4,99 | 116.316 | 6,45 | ||||
| 2026-01-26 | 13F | Cwm, Llc | 4.657 | 1,09 | 1 | |||||
| 2026-02-06 | 13F | IFP Advisors, Inc | 1.033 | 443,68 | 139 | 452,00 | ||||
| 2026-02-13 | 13F | Independent Family Office, LLC | 0 | -100,00 | 0 | |||||
| 2026-01-26 | 13F | Means Investment Co., Inc. | 3.235 | 0,03 | 435 | 1,40 | ||||
| 2025-11-06 | 13F | Financial Advocates Investment Management | 0 | -100,00 | 0 | -100,00 | ||||
| 2026-02-02 | 13F | Holistic Planning, LLC | 9.782 | -2,98 | 1.314 | -1,65 | ||||
| 2026-02-12 | 13F | Hudock, Inc. | 41.793 | 105,31 | 5.614 | 108,20 | ||||
| 2026-01-23 | 13F | DHJJ Financial Advisors, Ltd. | 4 | 0,00 | 1 | |||||
| 2026-02-06 | 13F | Larson Financial Group LLC | 300 | 0,00 | 40 | 2,56 | ||||
| 2026-02-10 | 13F | CIBC World Markets Inc. | 7.167 | -1,38 | 963 | 0,00 | ||||
| 2026-02-17 | 13F | Citadel Advisors Llc | 0 | -100,00 | 0 | |||||
| 2026-01-09 | 13F | Breakwater Capital Group | 20.500 | 1,63 | 2.754 | 3,03 | ||||
| 2026-02-17 | 13F | Advisory Services Network, LLC | 2.347 | -6,16 | 315 | -4,83 | ||||
| 2026-02-12 | 13F | Moneta Group Investment Advisors Llc | 4.576 | -7,95 | 615 | -6,69 | ||||
| 2026-02-04 | 13F | Madison Asset Management, LLC | 15.839 | -6,66 | 2.127 | -5,38 | ||||
| 2026-02-12 | 13F | Scotia Capital Inc. | 15.482 | 0,01 | 2.079 | 1,41 | ||||
| 2026-01-27 | 13F | GHP Investment Advisors, Inc. | 25.643 | -0,15 | 3.444 | 1,23 | ||||
| 2026-01-23 | 13F | Curtis Advisory Group, LLC | 81.820 | 4,82 | 10.990 | 6,28 | ||||
| 2026-02-17 | 13F | Cardiff Park Advisors, Llc | 0 | -100,00 | 0 | |||||
| 2026-02-17 | 13F | Ancora Advisors, LLC | 5.613 | 0,00 | 754 | 1,35 | ||||
| 2026-02-09 | 13F | Huntington National Bank | 35 | -60,67 | ||||||
| 2026-02-17 | 13F | Aqr Capital Management Llc | 1.600 | 215 | ||||||
| 2026-02-04 | 13F | Win Advisors, Inc | 0 | -100,00 | 0 | |||||
| 2026-02-06 | 13F | GPS Wealth Strategies Group, LLC | 0 | -100,00 | 0 | |||||
| 2026-02-06 | 13F | HighTower Advisors, LLC | 19.966 | -0,81 | 2.682 | 0,56 | ||||
| 2026-02-11 | 13F | Tiaa Trust, National Association | 2.269 | -15,87 | 305 | -14,85 | ||||
| 2026-02-06 | 13F | Vestmark Advisory Solutions, Inc. | 4.331 | 582 | ||||||
| 2026-01-12 | 13F | Kozak & Associates, Inc. | 60 | 0,00 | 8 | 14,29 | ||||
| 2026-01-20 | 13F | Steel Peak Wealth Management LLC | 4.101 | 551 | ||||||
| 2026-01-26 | 13F | AE Wealth Management LLC | 15 | 0,00 | 2 | 100,00 | ||||
| 2026-02-03 | 13F | RWM Asset Management, LLC | 8.618 | -4,24 | 1.173 | -1,59 | ||||
| 2026-01-09 | 13F | Capstone Wealth Management Group LLC | 4.069 | 0,05 | 547 | 1,49 | ||||
| 2026-01-12 | 13F | AllSquare Wealth Management LLC | 7.629 | -4,53 | 1.011 | 2,33 | ||||
| 2026-02-17 | 13F | Quantinno Capital Management LP | 6.575 | 98,64 | 883 | 101,60 | ||||
| 2026-02-17 | 13F | Hyundai Investments Co., Ltd. | 3.762 | 509 | ||||||
| 2025-10-20 | 13F | Ergawealth Advisors, Inc. | 0 | -100,00 | 0 | |||||
| 2026-02-11 | 13F | Vestor Capital, Llc | 1.683 | 0 | ||||||
| 2026-02-12 | 13F | Ankerstar Wealth, LLC | 101 | 14 | ||||||
| 2026-01-05 | 13F | Noble Wealth Management PBC | 233 | 0,00 | 31 | 3,33 | ||||
| 2026-02-12 | 13F | Hm Payson & Co | 125 | 0,00 | 17 | 0,00 | ||||
| 2026-01-21 | 13F | Wealthbridge Capital Management, Llc | 0 | -100,00 | 0 | |||||
| 2026-02-12 | 13F | BlackRock, Inc. | 620 | 0,00 | 83 | 1,22 | ||||
| 2026-01-26 | 13F | Roman Butler Fullerton & Co | 8.943 | 0,03 | 1.228 | 4,87 | ||||
| 2026-02-13 | 13F | Citigroup Inc | 14.959 | -1,35 | 2.009 | 0,05 | ||||
| 2026-02-14 | 13F | Rockefeller Capital Management L.P. | 4.347 | -8,06 | 584 | -6,71 | ||||
| 2026-01-21 | 13F | Crews Bank & Trust | 400 | 0,00 | 54 | 1,92 | ||||
| 2026-01-29 | 13F | Nbc Securities, Inc. | 2.171 | 0,00 | 292 | 1,39 | ||||
| 2026-02-12 | 13F | CIBC Private Wealth Group, LLC | 2.656 | 0,00 | 357 | 1,42 | ||||
| 2026-01-28 | 13F | Geneos Wealth Management Inc. | 2.228 | 122,80 | 299 | 126,52 | ||||
| 2026-01-20 | 13F | AdvisorNet Financial, Inc | 37 | 0,00 | 5 | 0,00 | ||||
| 2026-02-10 | 13F | IFG Advisory, LLC | 12.678 | 1.703 | ||||||
| 2026-01-20 | 13F | Mendota Financial Group, LLC | 512 | 0,00 | 69 | 1,49 | ||||
| 2026-02-06 | 13F | EverSource Wealth Advisors, LLC | 100 | 0,00 | 13 | 0,00 | ||||
| 2025-11-03 | 13F | Foundations Investment Advisors, LLC | 0 | -100,00 | 0 | |||||
| 2025-11-14 | 13F | Guardian Wealth Advisors, Llc / Nc | 0 | -100,00 | 0 | |||||
| 2026-02-09 | 13F | Harbour Investments, Inc. | 394 | 0,00 | 53 | 0,00 | ||||
| 2026-02-17 | 13F | Jones Financial Companies Lllp | 25.884 | 23,57 | 3.477 | 25,26 | ||||
| 2026-02-02 | 13F | Mutual Advisors, LLC | 1.590 | -94,99 | 214 | -90,27 | ||||
| 2026-01-27 | 13F | TD Waterhouse Canada Inc. | 250 | -28,57 | 34 | -28,26 | ||||
| 2026-02-05 | 13F | Triton Wealth Management, PLLC | 70.934 | 565,48 | 9.585 | 593,56 | ||||
| 2026-02-17 | 13F | Raymond James Financial Inc | 226.646 | 6,46 | 30.443 | 7,94 | ||||
| 2026-02-17 | 13F | First Manhattan Co | 2.900 | 0,00 | 390 | 1,30 | ||||
| 2026-02-10 | 13F | Essex Financial Services, Inc. | 16.152 | -2,72 | 2.170 | -1,36 | ||||
| 2026-01-29 | 13F | Sanctuary Advisors, LLC | 1.987 | 18,20 | 267 | 19,82 | ||||
| 2026-02-17 | 13F | Ameriprise Financial Inc | 34.276 | -12,09 | 4.604 | -11,12 | ||||
| 2026-01-23 | 13F | Aspect Partners, LLC | 2.108 | 0,19 | 283 | 1,80 | ||||
| 2026-02-17 | 13F | Strive Financial Group ,LLC | 112 | 15 | ||||||
| 2026-02-13 | 13F | Aptus Capital Advisors, LLC | 100 | 0,00 | 13 | 0,00 | ||||
| 2026-01-27 | 13F | BigSur Wealth Management LLC | 4.900 | 0,00 | 658 | 1,39 | ||||
| 2026-01-29 | 13F | Concurrent Investment Advisors, LLC | 3.054 | 410 | ||||||
| 2026-01-16 | 13F | First Community Trust Na | 110 | 0,00 | 15 | 0,00 | ||||
| 2026-01-26 | 13F | Whittier Trust Co | 503 | 0,20 | 69 | 4,55 | ||||
| 2026-02-11 | 13F | O'shaughnessy Asset Management, Llc | 223 | 0,00 | 30 | 0,00 | ||||
| 2026-02-10 | 13F/A | Northwestern Mutual Wealth Management Co | 68.412 | 5,29 | 9.189 | 6,76 | ||||
| 2025-09-29 | NP | HECA - Hedgeye Capital Allocation ETF | 4.802 | 600 | ||||||
| 2026-01-28 | 13F | Salomon & Ludwin, LLC | 484 | 0,00 | 67 | 3,13 | ||||
| 2026-02-13 | 13F | Gator Capital Management, LLC | 8.183 | 0,33 | 1.099 | 1,76 | ||||
| 2026-02-05 | 13F | Western Wealth Management, LLC | 1.827 | 245 | ||||||
| 2026-02-03 | 13F | International Assets Investment Management, Llc | 649 | 87 | ||||||
| 2026-02-11 | 13F | LPL Financial LLC | 463.308 | 9,48 | 62.232 | 11,00 | ||||
| 2026-01-08 | 13F | Chesapeake Asset Management Llc | 250 | 34 | ||||||
| 2026-02-17 | 13F | D. E. Shaw & Co., Inc. | 2.140 | 0,00 | 287 | 1,41 | ||||
| 2026-01-14 | 13F | Wealthcare Advisory Partners LLC | 4.634 | 0,56 | 622 | 1,97 | ||||
| 2026-02-10 | 13F | Tidemark, LLC | 2.384 | 0,04 | 320 | 1,59 | ||||
| 2025-10-01 | 13F | Caldwell Trust Co | 0 | -100,00 | 0 | -100,00 | ||||
| 2026-01-20 | 13F | Stratos Wealth Partners, LTD. | 6.651 | 7,57 | 893 | 9,04 | ||||
| 2026-02-12 | 13F | Mount Yale Investment Advisors, LLC | 4.331 | 582 | ||||||
| 2026-01-29 | 13F | TBH Global Asset Management, LLC | 6.487 | -2,51 | 871 | -1,14 | ||||
| 2026-01-23 | 13F | Carnegie Capital Asset Management, LLC | 15.232 | 0,00 | 2.046 | 1,39 | ||||
| 2026-01-29 | 13F | Resonant Capital Advisors, LLC | 59.999 | 0,00 | 8.059 | 1,40 | ||||
| 2026-02-05 | 13F | Pacific Sun Financial Corp | 15.421 | 1,02 | 2.071 | 2,42 | ||||
| 2026-01-16 | 13F | Empirical Financial Services, LLC d.b.a. Empirical Wealth Management | 2.500 | 0,00 | 336 | 1,21 | ||||
| 2026-02-09 | 13F | Collaborative Wealth Managment Inc. | 6.959 | -6,89 | 935 | -5,66 | ||||
| 2026-02-12 | 13F | Commonwealth Equity Services, Llc | 49.129 | -15,90 | 6.599 | 94.157,14 | ||||
| 2026-02-17 | 13F | Private Advisor Group, LLC | 33.498 | -2,16 | 4.499 | -0,79 | ||||
| 2026-01-06 | 13F | JBR Co Financial Management Inc | 4.127 | -0,53 | 554 | 0,91 | ||||
| 2026-02-17 | 13F | Blair William & Co/il | 17 | -97,49 | 2 | -97,75 | ||||
| 2026-01-28 | 13F | Caliber Wealth Management, LLC / KS | 6.329 | 0,02 | 850 | 1,43 | ||||
| 2026-02-18 | 13F | EP Wealth Advisors, Inc. | 6.000 | 806 | ||||||
| 2026-01-22 | 13F | Campbell Deegan Wealth Management, LLC | 4.382 | 0,09 | 589 | 1,55 | ||||
| 2025-11-14 | 13F | 1858 Wealth Management, Llc | 2.295 | 0,00 | 304 | 7,42 | ||||
| 2026-01-16 | 13F | Tempus Wealth Planning, LLC | 10.944 | -1,02 | 1.470 | 0,34 | ||||
| 2026-01-14 | 13F | Nova Wealth Management, Inc. | 1.303 | 38,18 | 175 | 41,13 | ||||
| 2026-01-15 | 13F | Bernard Wealth Management Corp. | 130 | 0,00 | 17 | 0,00 | ||||
| 2026-01-29 | 13F | Dunhill Financial, LLC | 1.005 | 0,00 | 135 | 0,75 | ||||
| 2026-01-12 | 13F | National Wealth Management Group, LLC | 0 | -100,00 | 0 | |||||
| 2026-02-04 | 13F | Tsfg, Llc | 6.502 | 0,00 | 1 | |||||
| 2026-02-18 | 13F | Garton & Associates Financial Advisors LLC | 207 | 28 | ||||||
| 2026-01-21 | 13F | Capital Advisors, Ltd. LLC | 4.206 | 4,71 | 1 | |||||
| 2026-02-12 | 13F | Wealthspire Advisors, LLC | 0 | -100,00 | 0 | |||||
| 2026-01-26 | 13F | Wbh Advisory Inc | 2.909 | -3,96 | 391 | -2,74 | ||||
| 2026-02-13 | 13F | Glen Eagle Advisors, LLC | 75 | 0,00 | 10 | 11,11 | ||||
| 2026-02-04 | 13F | Atlantic Union Bankshares Corp | 1.534 | 0,00 | 206 | 1,48 | ||||
| 2026-02-04 | 13F | Ameritas Advisory Services, LLC | 0 | -100,00 | 0 | |||||
| 2026-02-09 | 13F | Integrity Alliance, Llc. | 1.701 | 228 | ||||||
| 2026-02-13 | 13F | Luminist Capital LLC | 521 | 0,00 | 70 | 1,47 | ||||
| 2026-02-10 | 13F | Savant Capital, LLC | 1.632 | -4,56 | 219 | -3,10 | ||||
| 2026-02-11 | 13F | Jpmorgan Chase & Co | 32.972 | 0,64 | 4.429 | 2,03 | ||||
| 2026-02-02 | 13F | Total Clarity Wealth Management, Inc. | 2.311 | 310 | ||||||
| 2026-02-13 | 13F | Mml Investors Services, Llc | 12.884 | 16,17 | 1.731 | 17,77 | ||||
| 2026-02-13 | 13F/A | Abound Financial, Llc | 1.980 | 0,00 | 266 | 1,15 | ||||
| 2025-11-12 | 13F | CIBC Bancorp USA Inc. | 2.656 | 352 | ||||||
| 2026-02-13 | 13F | Wells Fargo & Company/mn | 372.416 | 11,20 | 50.023 | 12,74 | ||||
| 2026-01-21 | 13F | Banque de Luxembourg S.A. | 11.925 | 0,00 | 1.602 | 1,39 | ||||
| 2026-02-17 | 13F | Cetera Investment Advisers | 57.610 | 60,17 | 7.738 | 62,39 | ||||
| 2026-02-17 | 13F | Modern Wealth Management, LLC | 3.926 | 10,10 | 527 | 11,65 | ||||
| 2026-01-16 | 13F | Bangor Savings Bank | 765 | 0,00 | 103 | 0,99 | ||||
| 2026-02-06 | 13F | Axxcess Wealth Management, Llc | 1.818 | -0,60 | 244 | 0,83 | ||||
| 2026-02-12 | 13F | Bank Of Montreal /can/ | 11.581 | 1,27 | 1.556 | 2,64 | ||||
| 2026-02-06 | 13F | Pnc Financial Services Group, Inc. | 3.995 | 0,03 | 537 | 1,32 | ||||
| 2026-02-17 | 13F | Warren Averett Asset Management, LLC | 48.893 | 6,90 | 6.567 | 8,38 | ||||
| 2026-02-13 | 13F | Morgan Stanley | 339.899 | 4,80 | 45.655 | 6,25 | ||||
| 2026-02-03 | 13F | Koshinski Asset Management, Inc. | 70.184 | 2,32 | 9.427 | 3,74 | ||||
| 2026-01-21 | 13F | Avantra Family Wealth, Inc. | 2.961 | -3,14 | 398 | -1,98 | ||||
| 2026-01-27 | 13F | Belpointe Asset Management LLC | 9.268 | 1,19 | 1.245 | 2,56 | ||||
| 2026-02-06 | 13F | Gsa Capital Partners Llp | 0 | -100,00 | 0 | |||||
| 2026-02-17 | 13F | Stokes Family Office, LLC | 4.040 | 6,18 | 543 | 7,54 | ||||
| 2026-02-03 | 13F | Retirement Planning Group | 1.513 | 203 | ||||||
| 2026-02-12 | 13F | Steward Partners Investment Advisory, Llc | 24.184 | 1,07 | 3.248 | 2,49 | ||||
| 2025-11-06 | 13F | Providence Capital Advisors, LLC | 0 | -100,00 | 0 | |||||
| 2026-01-08 | 13F | True Wealth Design, LLC | 1.080 | 0,00 | 145 | 1,40 | ||||
| 2026-01-26 | 13F | Whittier Trust Co Of Nevada Inc | 9.600 | 0,00 | 1.324 | 3,36 | ||||
| 2026-02-12 | 13F | Federation des caisses Desjardins du Quebec | 5.091 | -1,05 | 684 | 0,29 | ||||
| 2026-02-17 | 13F | Susquehanna International Group, Llp | 3.236 | 46,82 | 435 | 49,14 | ||||
| 2026-01-29 | 13F | Comerica Bank | 2.131 | 100,28 | 286 | 104,29 | ||||
| 2026-02-06 | 13F | Addison Advisors LLC | 264 | 0,00 | 35 | 2,94 | ||||
| 2026-01-23 | 13F | Creative Capital Management Investments LLC | 288 | 0,00 | 39 | 0,00 | ||||
| 2026-02-17 | 13F | Russell Investments Group, Ltd. | 291 | 0,00 | 39 | 2,63 | ||||
| 2026-02-12 | 13F | Summit Financial, LLC | 7.980 | -6,11 | 1.072 | -4,80 | ||||
| 2026-02-17 | 13F | Creative Planning | 19.337 | -5,50 | 2.597 | -4,17 | ||||
| 2026-02-17 | 13F | Royal Bank Of Canada | 49.649 | 1,67 | 6.668 | 3,06 | ||||
| 2026-01-21 | 13F | Flagship Harbor Advisors, Llc | 18.334 | -3,36 | 2.463 | -2,03 | ||||
| 2026-01-08 | 13F | Grove Bank & Trust | 300 | 0,00 | 40 | 2,56 | ||||
| 2026-01-26 | 13F | Kelman-Lazarov, Inc. | 1.984 | 0,00 | 266 | 1,53 | ||||
| 2026-01-08 | 13F | Wealth Enhancement Advisory Services, Llc | 38.165 | -3,57 | 5.267 | 0,23 | ||||
| 2026-02-13 | 13F | Integrated Wealth Concepts LLC | 0 | -100,00 | 0 | |||||
| 2026-01-16 | 13F | Trust Co Of Vermont | 1.751 | 0,00 | 235 | 1,73 | ||||
| 2026-01-23 | 13F | Farther Finance Advisors, LLC | 7.750 | 2,62 | 1.041 | 4,10 | ||||
| 2026-01-15 | 13F | SILVER OAK SECURITIES, Inc | 0 | -100,00 | 0 | |||||
| 2026-02-17 | 13F | Fmr Llc | 42.255 | 2,91 | 5.676 | 4,34 | ||||
| 2026-01-27 | 13F | Fortitude Financial, LLC | 0 | -100,00 | 0 | |||||
| 2026-01-29 | 13F | UBS Group AG | 111.345 | -18,96 | 14.956 | -17,84 | ||||
| 2026-02-12 | 13F | Financial Engines Advisors L.L.C. | 2.908 | 0,00 | 391 | 1,30 | ||||
| 2026-02-13 | 13F | Banco Santander, S.A. | 2.554 | 0,00 | 343 | 1,48 | ||||
| 2026-02-12 | 13F | Brinker Capital Investments, LLC | 1.934 | 22,48 | 260 | 23,92 | ||||
| 2026-02-13 | 13F | Kestra Advisory Services, LLC | 0 | -100,00 | 0 | |||||
| 2026-01-27 | 13F | Novem Group | 1.720 | -7,68 | 231 | -6,10 | ||||
| 2026-01-21 | 13F | Runnymede Capital Advisors, Inc. | 0 | -100,00 | 0 | |||||
| 2026-01-21 | 13F | Sound Income Strategies, LLC | 813 | 0,00 | 111 | 3,74 | ||||
| 2026-01-30 | 13F | Reicon Wealth Advisors, Llc | 1.601 | 215 | ||||||
| 2026-02-17 | 13F | Citadel Advisors Llc | Call | 2.300 | 15,00 | 309 | 16,67 | |||
| 2026-01-21 | 13F | Aaron Wealth Advisors LLC | 2.238 | -9,10 | 301 | -7,98 | ||||
| 2026-02-12 | 13F | Principal Securities, Inc. | 4.803 | 10,87 | 645 | 12,57 | ||||
| 2026-02-13 | 13F | Fiduciary Trust Co | 1.654 | 0,00 | 222 | 1,37 | ||||
| 2026-01-27 | 13F | BankPlus Trust Department | 10.368 | -0,78 | 1.393 | 0,58 | ||||
| 2026-01-28 | 13F | Chicago Partners Investment Group LLC | 4.515 | 8,80 | 615 | 10,43 | ||||
| 2026-02-13 | 13F | National Bank Of Canada /fi/ | 5.220 | -3,96 | 701 | -2,64 | ||||
| 2026-01-20 | 13F | Sovran Advisors, LLC | 63.769 | -0,39 | 8.804 | 6,74 | ||||
| 2026-01-28 | 13F | Key Client Fiduciary Advisors, LLC | 4.327 | 15,14 | 581 | 16,90 | ||||
| 2026-01-09 | 13F | Tactive Advisors, LLC | 1.653 | 222 | ||||||
| 2026-01-26 | 13F | Elevation Capital Advisory, LLC | 0 | -100,00 | 0 | |||||
| 2026-02-11 | 13F | J.w. Cole Advisors, Inc. | 17.685 | 3,42 | 2.375 | 4,86 | ||||
| 2026-01-21 | 13F | Paladin Advisory Group, LLC | 45 | 0,00 | 6 | 20,00 | ||||
| 2026-02-09 | 13F | Prospera Financial Services Inc | 3.070 | 0,00 | 413 | 1,23 | ||||
| 2026-02-17 | 13F | Tower Research Capital LLC (TRC) | 0 | -100,00 | 0 | |||||
| 2026-02-17 | 13F | Clark Capital Management Group, Inc. | 1.842 | 0,00 | 247 | 1,23 | ||||
| 2026-02-03 | 13F | Costello Asset Management, INC | 216 | 0,00 | 29 | 3,57 | ||||
| 2026-02-17 | 13F | Northern Trust Corp | 0 | -100,00 | 0 | |||||
| 2026-02-02 | 13F | Truist Financial Corp | 54.875 | 11,63 | 7.371 | 13,18 | ||||
| 2026-01-16 | 13F | Sentry LLC | 1.825 | 0,00 | 245 | 1,66 | ||||
| 2026-02-10 | 13F | Goldman Sachs Group Inc | 0 | -100,00 | 0 | |||||
| 2026-02-13 | 13F | Barclays Plc | 0 | -100,00 | 0 | |||||
| 2026-02-13 | 13F | Stifel Financial Corp | 17.821 | -1,36 | 2.394 | 0,00 | ||||
| 2026-02-09 | 13F | Pacific Wealth Strategies Group, Inc. | 21.252 | -73,20 | 2.855 | -72,83 | ||||
| 2026-02-10 | 13F | Calton & Associates, Inc. | 5.940 | -2,91 | 798 | -1,60 | ||||
| 2026-01-13 | 13F | Fort Washington Investment Advisors Inc /oh/ | 0 | -100,00 | 0 | |||||
| 2026-02-02 | 13F | CX Institutional | 534 | 0,19 | 0 | |||||
| 2026-01-29 | 13F | S.A. Mason LLC | 6.721 | -1,75 | 903 | -0,44 | ||||
| 2026-02-17 | 13F | Two Sigma Investments, Lp | 0 | -100,00 | 0 | |||||
| 2026-02-06 | 13F | Fortis Group Advisors, LLC | 19.678 | -1,01 | 2.667 | 3,45 | ||||
| 2026-02-11 | 13F | Parallel Advisors, LLC | 1.422 | 0,00 | 191 | 1,60 | ||||
| 2026-02-10 | 13F | Bnp Paribas Arbitrage, Sa | 20.000 | 100,00 | 2.686 | 102,87 | ||||
| 2026-02-04 | 13F | H&H Retirement Design & Management INC | 12.369 | 4,49 | 1.694 | 10,29 | ||||
| 2026-01-20 | 13F | Thurston, Springer, Miller, Herd & Titak, Inc. | 41 | 6 | ||||||
| 2026-02-05 | 13F | Allworth Financial LP | 2.728 | 7,74 | 366 | 9,25 | ||||
| 2026-02-13 | 13F | Colony Group, LLC | 16.101 | 2.163 | ||||||
| 2026-01-26 | 13F | Asset Dedication, LLC | 4.019 | 0,93 | 540 | 2,28 | ||||
| 2026-02-05 | 13F | Cornerstone Wealth Management, LLC | 29.640 | 41,84 | 3.981 | 43,82 | ||||
| 2026-02-05 | 13F | Mission Wealth Management, Lp | 2.000 | 0,00 | 269 | 1,52 | ||||
| 2026-01-21 | 13F | Prime Capital Investment Advisors, LLC | 46.947 | 4,18 | 6.306 | 5,61 | ||||
| 2026-02-17 | 13F | Vertex Planning Partners, LLC | 1.500 | 201 | ||||||
| 2026-02-02 | 13F | Del-Sette Capital Management, LLC | 6.417 | -2,93 | 862 | -1,60 | ||||
| 2026-01-08 | 13F | NorthCrest Asset Manangement, LLC | 14.326 | 6,26 | 1.974 | 10,22 | ||||
| 2026-02-17 | 13F | Wiley Bros.-aintree Capital, Llc | 6.662 | 12,17 | 892 | 13,36 | ||||
| 2026-02-11 | 13F | Janney Montgomery Scott LLC | 4.046 | -18,85 | 1 | |||||
| 2026-02-10 | 13F | Envestnet Asset Management Inc | 52.654 | 23,79 | 7.073 | 25,52 | ||||
| 2026-01-30 | 13F | Kohmann Bosshard Financial Services, LLC | 800 | 107 | ||||||
| 2026-02-05 | 13F | Dana Investment Advisors, Inc. | 5.403 | 726 | ||||||
| 2026-01-30 | 13F | Ktf Investments, Llc | 1.595 | 214 | ||||||
| 2026-02-11 | 13F | Miller Investment Management, LP | 2.675 | 0,00 | 359 | 1,41 | ||||
| 2026-01-16 | 13F | Legacy Capital Wealth Partners, LLC | 58.755 | -8,98 | 7.102 | -8,77 | ||||
| 2026-02-12 | 13F | StoneX Group Inc. | 0 | -100,00 | 0 | |||||
| 2026-01-26 | 13F | Merit Financial Group, LLC | 3.764 | 1,65 | 506 | 3,06 | ||||
| 2026-02-10 | 13F | Measured Wealth Private Client Group, LLC | 2.497 | -0,64 | 335 | 0,90 | ||||
| 2026-02-10 | 13F | Bank of New York Mellon Corp | 10.264 | -57,72 | 1.379 | -57,14 | ||||
| 2026-02-10 | 13F | Argent Trust Co | 9.412 | 0,00 | 1.264 | 1,44 | ||||
| 2026-01-27 | 13F | PFG Advisors | 2.125 | -50,00 | 285 | -49,38 | ||||
| 2026-02-17 | 13F | Advisor Group Holdings, Inc. | 52.854 | 10,79 | 7.102 | 13,09 | ||||
| 2026-02-10 | 13F | Hazlett, Burt & Watson, Inc. | 8.129 | 0,63 | 1 | 0,00 | ||||
| 2026-01-21 | 13F | Capital Investment Advisory Services, LLC | 4.869 | 0,91 | 654 | 2,19 | ||||
| 2026-02-17 | 13F | North Capital, Inc. | 0 | -100,00 | 0 | |||||
| 2026-01-16 | 13F | Ronald Blue Trust, Inc. | 0 | -100,00 | 0 | |||||
| 2025-11-10 | 13F | Lion Street Advisors, LLC | 0 | -100,00 | 0 | -100,00 | ||||
| 2026-01-20 | 13F | Investment Research & Advisory Group, Inc. | 50 | 0,00 | 7 | 0,00 | ||||
| 2026-02-13 | 13F | Navis Wealth Advisors, LLC | 1.500 | 201 | ||||||
| 2026-01-21 | 13F | TPG Advisors LLC | 1.609 | 0,00 | 216 | 1,41 | ||||
| 2026-01-26 | 13F | Independent Wealth Network Inc. | 4.908 | -1,31 | 659 | 0,15 | ||||
| 2026-02-18 | 13F | GWM Advisors LLC | 18.813 | -48,90 | 2.527 | -48,21 | ||||
| 2026-02-12 | 13F | Rossby Financial, LCC | 104 | 0,00 | 14 | 0,00 | ||||
| 2026-02-13 | 13F | Level Four Advisory Services, Llc | 1.883 | 0,00 | 253 | 1,20 | ||||
| 2026-02-17 | 13F | Qube Research & Technologies Ltd | 127 | -13,01 | 17 | -10,53 | ||||
| 2026-02-04 | 13F | American Institute for Advanced Investment Management, LLP | 2.880 | 0,00 | 387 | 1,31 | ||||
| 2026-01-23 | 13F | Assetmark, Inc | 488 | 0,00 | 66 | 1,56 | ||||
| 2026-02-17 | 13F | truNorth Financial Services, Inc. | 7.636 | 1.026 | ||||||
| 2026-01-30 | 13F | Us Bancorp \de\ | 2.253 | 0,00 | 303 | 1,34 | ||||
| 2026-01-30 | 13F/A | M&t Bank Corp | 3.250 | 0,00 | 437 | 1,40 | ||||
| 2026-01-09 | 13F | Dynamic Advisor Solutions LLC | 1.690 | 0,06 | 227 | 1,79 | ||||
| 2026-01-30 | 13F | Archer Investment Corp | 3.218 | -2,84 | 432 | -1,37 | ||||
| 2026-01-16 | 13F | Kendall Capital Management | 8.082 | 121,61 | 1.086 | 124,64 | ||||
| 2026-01-20 | 13F | Ethos Financial Group, LLC | 4.334 | -7,96 | 582 | -6,58 | ||||
| 2026-02-17 | 13F | Regal Investment Advisors LLC | 2.575 | -17,15 | 346 | -16,06 | ||||
| 2026-02-17 | 13F | WFA of San Diego, LLC | 0 | -100,00 | 0 | |||||
| 2026-02-06 | 13F | Creative Financial Designs Inc /adv | 464 | -2,32 | 62 | 0,00 | ||||
| 2026-02-17 | 13F | Cahill Financial Advisors Inc | 47.721 | -0,91 | 6.410 | 0,45 | ||||
| 2026-01-26 | 13F | Private Trust Co Na | 851 | 143,14 | 114 | 147,83 | ||||
| 2026-02-02 | 13F | Millstone Evans Group, LLC | 382 | -9,05 | 51 | -7,27 | ||||
| 2026-01-14 | 13F | Stegent Equity Advisors, Inc. | 14.045 | 1.886 | ||||||
| 2026-01-23 | 13F | Optima Capital Llc | 4.961 | 0,20 | 666 | 1,68 | ||||
| 2026-02-04 | 13F | Pure Financial Advisors, Inc. | 3.083 | 0,00 | 414 | 1,47 | ||||
| 2026-02-09 | 13F | Sensible Money, LLC | 4.019 | 0,00 | 540 | 1,32 | ||||
| 2026-02-13 | 13F | Mariner, LLC | 81.595 | 1,41 | 10.960 | 2,81 | ||||
| 2026-02-20 | 13F | Kovitz Investment Group Partners, LLC | 0 | -100,00 | 0 |