Grundlæggende statistik
| Institutionelle ejere | 159 total, 159 long only, 0 short only, 0 long/short - change of 1,91% MRQ |
| Gennemsnitlig porteføljeallokering | 0.2750 % - change of 2,78% MRQ |
| Institutionelle aktier (lange) | 15.924.910 (ex 13D/G) - change of 3,38MM shares 26,98% MRQ |
| Institutionel værdi (lang) | $ 492.553 USD ($1000) |
Institutionelt ejerskab og aktionærer
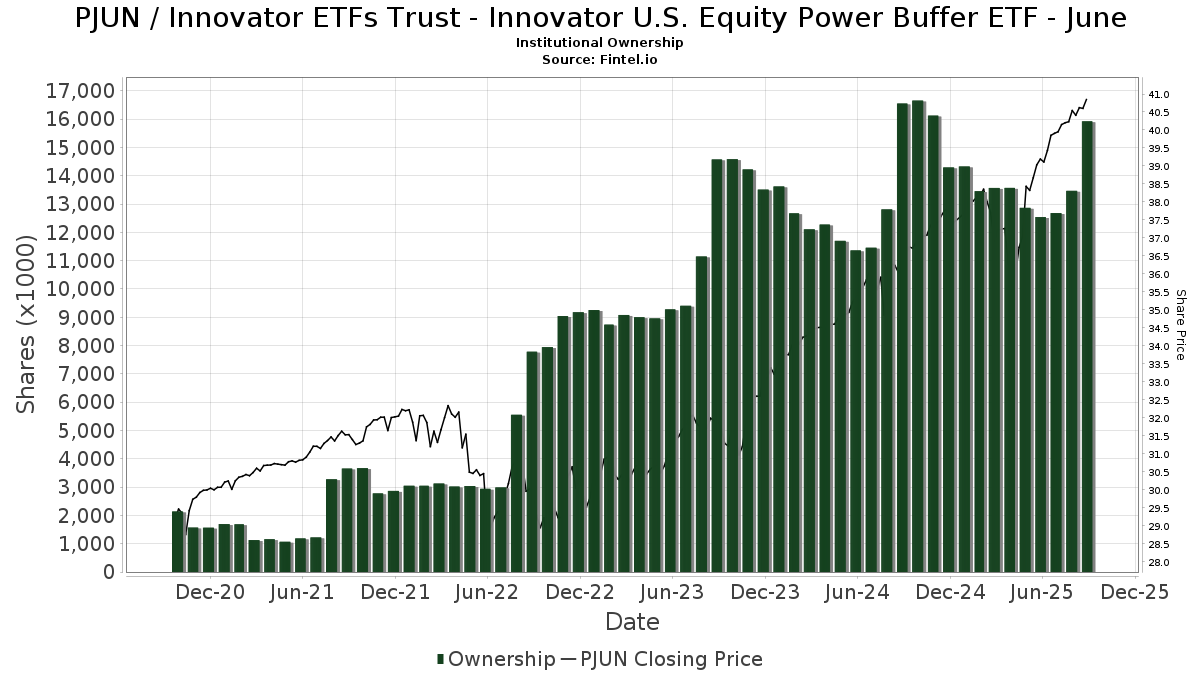
Innovator ETFs Trust - Innovator U.S. Equity Power Buffer ETF - June (US:PJUN) har 159 institutionelle ejere og aktionærer, der har indsendt 13D/G- eller 13F-formularer til Securities Exchange Commission (SEC). Disse institutioner har i alt 15,924,910 aktier. Største aktionærer omfatter Alliancebernstein L.p., Commonwealth Equity Services, Llc, Penserra Capital Management LLC, Innovator ETFs Trust - Innovator Laddered Fund of U.S. Equity Power Buffer ETFs, Berkshire Money Management, Inc., Advisor Group Holdings, Inc., HighTower Advisors, LLC, Kovitz Investment Group Partners, LLC, Wealth Enhancement Advisory Services, Llc, and Raymond James Financial Inc .
Innovator ETFs Trust - Innovator U.S. Equity Power Buffer ETF - June (BATS:PJUN) institutionel ejerskabsstruktur viser aktuelle positioner i virksomheden efter institutioner og fonde, samt seneste ændringer i positionsstørrelse. Større aktionærer kan omfatte individuelle investorer, investeringsforeninger, hedgefonde eller institutioner. Skema 13D angiver, at investoren besidder (eller besidder) mere end 5 % af virksomheden og har til hensigt (eller har til hensigt at) aktivt at forfølge en ændring i forretningsstrategi. Skema 13G indikerer en passiv investering på over 5%.
The share price as of September 12, 2025 is 40,90 / share. Previously, on September 13, 2024, the share price was 36,42 / share. This represents an increase of 12,30% over that period.
Fondens stemningsscore
Fund Sentiment Score (fka Ownership Accumulation Score) finder de aktier, der bliver mest købt af fonde. Det er resultatet af en sofistikeret, multi-faktor kvantitativ model, der identificerer virksomheder med de højeste niveauer af institutionel akkumulering. Scoringsmodellen bruger en kombination af den samlede stigning i oplyste ejere, ændringerne i porteføljeallokeringer i disse ejere og andre målinger. Tallet går fra 0 til 100, hvor højere tal indikerer et højere niveau af akkumulering for sine jævnaldrende, og 50 er gennemsnittet.
Opdateringsfrekvens: Dagligt
Se Ownership Explorer, som giver en liste over højest rangerende virksomheder.
Institutionel Put/Call-forhold
Ud over at indberette standardaktie- og gældsudstedelser skal institutter med mere end 100 mill. aktiver under forvaltning også oplyse deres put- og call-optionsbeholdninger. Da salgsoptioner generelt indikerer negativ stemning, og købsoptioner indikerer positiv stemning, kan vi få en fornemmelse af den overordnede institutionelle stemning ved at plotte forholdet mellem put og kald. Diagrammet til højre viser det historiske put/call-forhold for dette instrument.
Brug af Put/Call Ratio som en indikator for investorernes stemning overvinder en af de vigtigste mangler ved at bruge totalt institutionelt ejerskab, som er, at en betydelig mængde af aktiver under forvaltning investeres passivt for at spore indekser. Passivt forvaltede fonde køber typisk ikke optioner, så indikatoren for put/call-forholdet følger mere nøje følelsen af aktivt forvaltede fonde.
13F og NPORT arkivering
Detaljer om 13F-arkivering er gratis. Detaljer om NP-ansøgninger kræver et premium-medlemskab. Grønne rækker angiver nye positioner. Røde rækker angiver lukkede positioner. Klik på linket ikon for at se den fulde transaktionshistorik.
Opgrader
for at låse premium-data op og eksportere til Excel ![]() .
.
| Fil dato | Kilde | Investor | Type | Gennemsnitlig pris (Øst) |
Aktier | Δ Aktier (%) |
Rapporteret Værdi ($1000) |
Δ Værdi (%) |
Port Alloc (%) |
|
|---|---|---|---|---|---|---|---|---|---|---|
| 2025-08-13 | 13F | Cresset Asset Management, LLC | 54.746 | 46,96 | 2.177 | 57,91 | ||||
| 2025-07-25 | 13F | NorthRock Partners, LLC | 1.629 | 0,00 | 65 | 6,67 | ||||
| 2025-08-04 | 13F | Spire Wealth Management | 19.609 | 9,41 | 780 | 17,50 | ||||
| 2025-08-14 | 13F | Beck Capital Management, Llc | 12.882 | 0,01 | 512 | 7,56 | ||||
| 2025-07-25 | 13F | Atria Wealth Solutions, Inc. | 9.665 | -28,88 | 384 | -23,51 | ||||
| 2025-07-22 | 13F | Merit Financial Group, LLC | 10.720 | 426 | ||||||
| 2025-07-15 | 13F | McAdam, LLC | 201.951 | -1,20 | 8.030 | 6,15 | ||||
| 2025-07-23 | 13F | Valmark Advisers, Inc. | 16.399 | 24,08 | 652 | 33,33 | ||||
| 2025-08-11 | 13F | Atlantic Private Wealth, LLC | 0 | -100,00 | 0 | |||||
| 2025-08-12 | 13F | LPL Financial LLC | 196.618 | 10,32 | 7.818 | 18,51 | ||||
| 2025-04-08 | 13F | Lantz Financial LLC | 0 | -100,00 | 0 | |||||
| 2025-08-08 | 13F | Wealth Alliance | 51.065 | 1,90 | 2.030 | 9,49 | ||||
| 2025-05-06 | 13F | Assetmark, Inc | 0 | -100,00 | 0 | |||||
| 2025-08-04 | 13F | Integrity Alliance, Llc. | 0 | -100,00 | 0 | |||||
| 2025-08-14 | 13F | Wells Fargo & Company/mn | 879 | 0,00 | 35 | 6,25 | ||||
| 2025-08-15 | 13F | Kestra Advisory Services, LLC | 171.760 | 36,41 | 6.829 | 46,55 | ||||
| 2025-08-14 | 13F | Ambassador Advisors, LLC | 16.335 | 11,62 | 649 | 19,96 | ||||
| 2025-08-01 | 13F | FSA Advisors, Inc. | 12.067 | 8,29 | 480 | 17,11 | ||||
| 2025-08-01 | 13F | Corrado Advisors, Llc | 41.353 | 1.644 | ||||||
| 2025-08-06 | 13F | New Millennium Group LLC | 0 | -100,00 | 0 | |||||
| 2025-08-11 | 13F | Blue Bell Private Wealth Management, Llc | 11.603 | 1,75 | 461 | 9,24 | ||||
| 2025-07-25 | 13F | We Are One Seven, LLC | 15.276 | 607 | ||||||
| 2025-08-11 | 13F | Annis Gardner Whiting Capital Advisors, LLC | 20.875 | 830 | ||||||
| 2025-07-17 | 13F | Clear Point Advisors Inc. | 89.850 | -3,30 | 3.572 | 3,90 | ||||
| 2025-08-14 | 13F | Visionary Wealth Advisors | 6.242 | -0,14 | 248 | 7,36 | ||||
| 2025-07-09 | 13F | Fragasso Group Inc. | 18.268 | -4,41 | 726 | 2,69 | ||||
| 2025-08-12 | 13F | SRS Capital Advisors, Inc. | 7.962 | -46,66 | 317 | -42,75 | ||||
| 2025-07-30 | 13F | Brookstone Capital Management | 203.841 | -45,68 | 8.105 | -41,64 | ||||
| 2025-08-06 | 13F | Rps Advisory Solutions Llc | 49.591 | 139,32 | 1.972 | 157,31 | ||||
| 2025-08-14 | 13F | CoreCap Advisors, LLC | 202.489 | 105,68 | 8.051 | 120,97 | ||||
| 2025-07-30 | 13F | Retirement Planning Group | 7.620 | 0,00 | 303 | 7,09 | ||||
| 2025-08-07 | 13F | Resources Investment Advisors, LLC. | 82.206 | 74,56 | 3.269 | 87,60 | ||||
| 2025-08-14 | 13F | Colony Group, LLC | 69.914 | 1,85 | 2.780 | 9,41 | ||||
| 2025-07-21 | 13F | Ameriflex Group, Inc. | 133 | 0,00 | 5 | 25,00 | ||||
| 2025-07-22 | 13F | Berkshire Money Management, Inc. | 623.576 | 2.852,12 | 24.793 | 3.074,52 | ||||
| 2025-07-25 | 13F | Cwm, Llc | 1.950 | 22,41 | 0 | |||||
| 2025-05-15 | 13F | Two Sigma Securities, Llc | 0 | -100,00 | 0 | -100,00 | ||||
| 2025-08-11 | 13F | Bellwether Advisors, LLC | 127.427 | 17,90 | 5.066 | 26,68 | ||||
| 2025-08-04 | 13F | Atria Investments Llc | 24.297 | 966 | ||||||
| 2025-08-12 | 13F | MAI Capital Management | 55.251 | 127,74 | 2.197 | 144,82 | ||||
| 2025-08-13 | 13F | Continuum Advisory, LLC | 0 | -100,00 | 0 | |||||
| 2025-07-10 | 13F | Atticus Wealth Management, Llc | 15.838 | 77,78 | 630 | 91,19 | ||||
| 2025-08-12 | 13F | Jacobi Capital Management LLC | 10.850 | 0,00 | 431 | 7,48 | ||||
| 2025-08-05 | 13F | Sigma Planning Corp | 5.677 | 226 | ||||||
| 2025-08-11 | 13F | Nations Financial Group Inc, /ia/ /adv | 37.875 | 1,55 | 1.506 | 9,06 | ||||
| 2025-08-14 | 13F | Bank Of America Corp /de/ | 568 | 23 | ||||||
| 2025-08-08 | 13F | Avantax Advisory Services, Inc. | 21.114 | 89,07 | 839 | 103,15 | ||||
| 2025-07-17 | 13F | Wagner Wealth Management, Llc | 1.990 | 0,00 | 79 | 8,22 | ||||
| 2025-07-29 | 13F | Chicago Partners Investment Group LLC | 32.845 | -7,62 | 1.319 | 0,15 | ||||
| 2025-08-14 | 13F | Financial Network Wealth Advisors LLC | 3.055 | 9,03 | 121 | 17,48 | ||||
| 2025-08-08 | 13F | Thoroughbred Financial Services, Llc | 26.406 | -7,03 | 1 | 0,00 | ||||
| 2025-08-14 | 13F | Mml Investors Services, Llc | 120.549 | 179,70 | 5 | 300,00 | ||||
| 2025-07-28 | 13F | Elmwood Wealth Management, Inc. | 6.950 | -12,58 | 276 | -6,12 | ||||
| 2025-08-13 | 13F | Barclays Plc | 0 | -100,00 | 0 | |||||
| 2025-07-28 | 13F | Cypress Wealth Services, LLC | 9.684 | -15,59 | 385 | -9,20 | ||||
| 2025-08-01 | 13F | Advisory Alpha, LLC | 149.897 | -2,18 | 5.960 | 5,08 | ||||
| 2025-07-17 | 13F | Fort Washington Investment Advisors Inc /oh/ | 6.950 | -21,02 | 276 | -15,08 | ||||
| 2025-08-14 | 13F | Jane Street Group, Llc | 33.247 | 1.322 | ||||||
| 2025-07-24 | 13F | Weaver Capital Management LLC | 138.697 | 0,40 | 5.515 | 7,86 | ||||
| 2025-05-08 | 13F | Arkadios Wealth Advisors | 0 | -100,00 | 0 | |||||
| 2025-08-05 | 13F | Tsfg, Llc | 0 | -100,00 | 0 | |||||
| 2025-04-01 | 13F/A | Family Wealth Group, LLC | 0 | -100,00 | 0 | |||||
| 2025-07-22 | 13F | Global Strategic Investment Solutions, LLC | 14.932 | -0,08 | 594 | 7,23 | ||||
| 2025-05-06 | 13F | Retirement Income Solutions, Inc | 0 | -100,00 | 0 | |||||
| 2025-07-28 | 13F | Harbour Investments, Inc. | 24.896 | 2,73 | 990 | 10,38 | ||||
| 2025-07-09 | 13F | Fiduciary Alliance LLC | 5.674 | 226 | ||||||
| 2025-05-09 | 13F | Mitchell Capital Management Co | 0 | -100,00 | 0 | -100,00 | ||||
| 2025-08-12 | 13F | Proequities, Inc. | 0 | 0 | ||||||
| 2025-07-23 | 13F | Castle Rock Wealth Management, LLC | 45.035 | 0,69 | 1.804 | 9,00 | ||||
| 2025-07-16 | 13F | Dakota Wealth Management | 12.817 | 0,00 | 510 | 7,38 | ||||
| 2025-08-11 | 13F | WPWealth LLP | 30.176 | -72,38 | 1.200 | -70,34 | ||||
| 2025-08-01 | 13F | Bessemer Group Inc | 0 | -100,00 | 0 | |||||
| 2025-08-06 | 13F | Penserra Capital Management LLC | 1.493.506 | 15,39 | 59 | 25,53 | ||||
| 2025-08-14 | 13F | Kovitz Investment Group Partners, LLC | 416.018 | 34,28 | 16.541 | 44,25 | ||||
| 2025-08-05 | 13F | Bank Of Montreal /can/ | 16.587 | 0,00 | 659 | 7,50 | ||||
| 2025-04-10 | 13F | Sugar Maple Asset Management, LLC | 0 | -100,00 | 0 | |||||
| 2025-07-25 | 13F | Sequoia Financial Advisors, LLC | 8.974 | 0,00 | 357 | 7,23 | ||||
| 2025-08-06 | 13F | Commonwealth Equity Services, Llc | 1.670.634 | 274,26 | 66 | 312,50 | ||||
| 2025-08-13 | 13F | Beacon Pointe Advisors, LLC | 138.703 | 58,90 | 5.515 | 70,71 | ||||
| 2025-08-14 | 13F | First Commonwealth Financial Corp /pa/ | 17.908 | 8,70 | 712 | 16,91 | ||||
| 2025-08-12 | 13F | Weaver Consulting Group | 107.594 | 3,55 | 4.278 | 11,24 | ||||
| 2025-06-24 | NP | Innovator ETFs Trust - Innovator Laddered Fund of U.S. Equity Power Buffer ETFs | 1.304.988 | 12,03 | 47.932 | 8,17 | ||||
| 2025-07-14 | 13F | Chris Bulman Inc | 155.187 | -45,96 | 6.170 | -41,94 | ||||
| 2025-08-14 | 13F | UBS Group AG | 0 | -100,00 | 0 | |||||
| 2025-08-08 | 13F | Kingsview Wealth Management, LLC | 12.760 | -1,54 | 507 | 5,85 | ||||
| 2025-08-15 | 13F | First Heartland Consultants, Inc. | 25.648 | 1.020 | ||||||
| 2025-08-06 | 13F | AE Wealth Management LLC | 43.662 | -3,54 | 1.736 | 3,64 | ||||
| 2025-07-14 | 13F | Kfg Wealth Management, Llc | 59.227 | 25,73 | 2.355 | 35,05 | ||||
| 2025-07-21 | 13F | DHJJ Financial Advisors, Ltd. | 21.471 | 27,45 | 854 | 36,92 | ||||
| 2025-05-14 | 13F | Valtinson Bruner Financial Planning LLC | 0 | -100,00 | 0 | |||||
| 2025-08-06 | 13F | Stone House Investment Management, LLC | 1.450 | 58 | ||||||
| 2025-08-15 | 13F | Chapman Financial Group, Llc | 3.100 | -8,82 | 123 | -3,15 | ||||
| 2025-08-11 | 13F | Brown Brothers Harriman & Co | 272 | 0,00 | 11 | 0,00 | ||||
| 2025-04-22 | 13F | Continuum Wealth Advisors, Llc | 0 | -100,00 | 0 | |||||
| 2025-08-07 | 13F | Tfo-tdc, Llc | 0 | -100,00 | 0 | |||||
| 2025-08-12 | 13F | Tradition Wealth Management, LLC | 20.174 | -3,23 | 802 | 4,02 | ||||
| 2025-08-19 | 13F | Advisory Services Network, LLC | 23.000 | 138,34 | 924 | 158,82 | ||||
| 2025-08-11 | 13F | HighTower Advisors, LLC | 431.695 | -1,70 | 17.164 | 5,61 | ||||
| 2025-05-12 | 13F | Fmr Llc | 0 | -100,00 | 0 | |||||
| 2025-07-29 | 13F | Balboa Wealth Partners | 0 | -100,00 | 0 | |||||
| 2025-08-14 | 13F | Raymond James Financial Inc | 331.546 | 76,98 | 13.182 | 90,13 | ||||
| 2025-08-14 | 13F | Alliancebernstein L.p. | 2.943.205 | 10,53 | 117.022 | 18,74 | ||||
| 2025-07-31 | 13F | Cardinal Point Capital Management, ULC | 16.230 | 0,00 | 645 | 7,50 | ||||
| 2025-07-15 | 13F | BCS Wealth Management | 31.131 | 11,54 | 1 | 0,00 | ||||
| 2025-07-18 | 13F | Truist Financial Corp | 178.359 | 4,92 | 7.092 | 12,72 | ||||
| 2025-08-05 | 13F | Huntington National Bank | 20 | |||||||
| 2025-08-13 | 13F | Capital Analysts, Inc. | 8.288 | 9,07 | 0 | |||||
| 2025-05-01 | 13F | Quest 10 Wealth Builders, Inc. | 19.090 | 0,00 | 713 | -0,42 | ||||
| 2025-05-13 | 13F | Coldstream Capital Management Inc | 0 | -100,00 | 0 | |||||
| 2025-08-14 | 13F | Garden State Investment Advisory Services LLC | 13.585 | 0,00 | 540 | 7,57 | ||||
| 2025-07-25 | 13F | Yarger Wealth Strategies, Llc | 75.696 | 3,43 | 3.010 | 11,12 | ||||
| 2025-07-17 | 13F | Janney Montgomery Scott LLC | 35.792 | -4,06 | 1 | 0,00 | ||||
| 2025-08-12 | 13F | Wood Tarver Financial Group, LLC | 3.326 | 0,00 | 0 | -100,00 | ||||
| 2025-07-10 | 13F | Focus Financial Network, Inc. | 21.770 | 4,25 | 866 | 12,05 | ||||
| 2025-08-13 | 13F | Cerity Partners LLC | 11.941 | -28,71 | 475 | -23,42 | ||||
| 2025-07-24 | 13F | Bernard Wealth Management Corp. | 920 | 0,99 | 37 | 9,09 | ||||
| 2025-07-29 | 13F | Straight Path Wealth Management | 5.354 | -16,30 | 213 | -10,17 | ||||
| 2025-08-12 | 13F | Steward Partners Investment Advisory, Llc | 3.949 | 0,00 | 157 | 7,53 | ||||
| 2025-08-19 | 13F | Cape Investment Advisory, Inc. | 41.825 | -9,32 | 1.663 | -2,64 | ||||
| 2025-07-24 | 13F | IFP Advisors, Inc | 43.123 | 32,38 | 1.715 | 42,24 | ||||
| 2025-08-12 | 13F | Bedel Financial Consulting, Inc. | 0 | -100,00 | 0 | |||||
| 2025-07-31 | 13F | Orion Capital Management LLC | 13.720 | -6,79 | 546 | 0,18 | ||||
| 2025-08-05 | 13F | Integrity Financial Corp /WA | 5.284 | -17,41 | 210 | -11,02 | ||||
| 2025-07-17 | 13F | City Holding Co | 430 | 0,00 | 17 | 13,33 | ||||
| 2025-08-14 | 13F | Susquehanna International Group, Llp | 26.098 | -76,20 | 1.038 | -74,44 | ||||
| 2025-07-14 | 13F | AdvisorNet Financial, Inc | 1.848 | -11,32 | 73 | -5,19 | ||||
| 2025-08-11 | 13F | Outlook Wealth Advisors, LLC | 38.994 | -3,70 | 1.550 | 3,47 | ||||
| 2025-08-12 | 13F | Park Square Financial Group, LLC | 138 | 0,00 | 5 | 0,00 | ||||
| 2025-07-10 | 13F | ARS Wealth Advisors Group, LLC | 114.802 | 4,53 | 4.565 | 12,30 | ||||
| 2025-08-08 | 13F | Cetera Investment Advisers | 212.948 | 6,70 | 8.467 | 14,62 | ||||
| 2025-08-05 | 13F | WorthPointe, LLC | 16.451 | 3,27 | 654 | 11,04 | ||||
| 2025-08-08 | 13F | Gts Securities Llc | 7.900 | 314 | ||||||
| 2025-08-12 | 13F | Tableaux Llc | 6.714 | 2.847 | ||||||
| 2025-07-28 | 13F | WealthPlan Investment Management, LLC | 5.444 | 0,00 | 216 | 7,46 | ||||
| 2025-08-04 | 13F | JDM Financial Group LLC | 21.447 | 0,00 | 853 | 7,44 | ||||
| 2025-07-28 | 13F | RFG Advisory, LLC | 27.724 | -17,87 | 1.102 | -11,77 | ||||
| 2025-07-10 | 13F | Wealth Enhancement Advisory Services, Llc | 368.519 | 389,97 | 14.697 | 428,06 | ||||
| 2025-08-12 | 13F | Change Path, LLC | 30.655 | 73,08 | 1.219 | 85,95 | ||||
| 2025-08-13 | 13F | BCJ Capital Management, LLC | 7.331 | -0,33 | 291 | 6,99 | ||||
| 2025-07-31 | 13F | Cambridge Investment Research Advisors, Inc. | 91.125 | 19,80 | 4 | 50,00 | ||||
| 2025-04-22 | 13F | Worth Financial Advisory Group, LLC | 0 | -100,00 | 0 | -100,00 | ||||
| 2025-08-08 | 13F | Emerald Investment Partners, Llc | 842 | 155,15 | 33 | 175,00 | ||||
| 2025-07-29 | 13F | BKD Wealth Advisors, LLC | 56.829 | -16,54 | 2.260 | -10,32 | ||||
| 2025-08-01 | 13F | Envestnet Asset Management Inc | 251.711 | 93,36 | 10.008 | 107,76 | ||||
| 2025-07-17 | 13F | Clay Northam Wealth Management, LLC | 6.960 | 4,11 | 277 | 11,74 | ||||
| 2025-07-31 | 13F | Blue Sky Capital Consultants Group, Inc. | 7.925 | 315 | ||||||
| 2025-08-11 | 13F | Principal Securities, Inc. | 5.065 | 23,09 | 201 | 30,52 | ||||
| 2025-07-31 | 13F | Pinnacle Wealth Management Group, Inc. | 63.535 | 16,62 | 2.526 | 25,30 | ||||
| 2025-07-11 | 13F | Farther Finance Advisors, LLC | 6.227 | 2,47 | 248 | 9,78 | ||||
| 2025-08-19 | 13F | National Asset Management, Inc. | 7.500 | -63,99 | 298 | -61,84 | ||||
| 2025-07-14 | 13F | U.S. Capital Wealth Advisors, LLC | 12.457 | 29,36 | 495 | 39,04 | ||||
| 2025-08-14 | 13F | GWM Advisors LLC | 36.668 | 149,09 | 1.458 | 167,83 | ||||
| 2025-07-14 | 13F | Southland Equity Partners LLC | 94.166 | -0,00 | 3.744 | 7,43 | ||||
| 2025-07-31 | 13F | Gill Capital Partners, Llc | 19.407 | 42,94 | 772 | 53,59 | ||||
| 2025-07-24 | 13F | Riverchase Wealth Management, Llc | 27.250 | 0,00 | 1.083 | 7,44 | ||||
| 2025-07-30 | 13F | Strategic Blueprint, LLC | 23.053 | -36,50 | 917 | -31,79 | ||||
| 2025-08-14 | 13F | AllSquare Wealth Management LLC | 350 | 0,00 | 14 | 8,33 | ||||
| 2025-08-04 | 13F | Pensionmark Financial Group, Llc | 22.588 | 31,69 | 898 | 41,64 | ||||
| 2025-08-13 | 13F | M Holdings Securities, Inc. | 13.967 | 1 | ||||||
| 2025-07-28 | 13F | Cornerstone Wealth Group, LLC | 28.913 | -5,56 | 1.150 | 1,41 | ||||
| 2025-08-05 | 13F | BCGM Wealth Management, LLC | 9.979 | 0,00 | 397 | 7,32 | ||||
| 2025-08-04 | 13F | Creative Financial Designs Inc /adv | 4.820 | 2,53 | 192 | 10,40 | ||||
| 2025-08-14 | 13F | Citadel Advisors Llc | 0 | -100,00 | 0 | |||||
| 2025-07-30 | 13F | Phoenix Holdings Ltd. | 9.920 | 394 | ||||||
| 2025-08-14 | 13F | Hrt Financial Lp | 7.920 | -43,00 | 0 | |||||
| 2025-08-14 | 13F | Old Mission Capital Llc | 99.564 | 622,00 | 3.959 | 676,08 | ||||
| 2025-08-08 | 13F | Foundations Investment Advisors, LLC | 12.413 | 29,19 | 494 | 38,87 | ||||
| 2025-08-13 | 13F | Townsquare Capital Llc | 0 | -100,00 | 0 | |||||
| 2025-08-11 | 13F | Brown Wealth Management, Llc | 32.215 | -1,89 | 1.281 | 5,35 | ||||
| 2025-08-15 | 13F | Nikulski Financial, Inc. | 15.420 | 30,07 | 613 | 39,95 | ||||
| 2025-05-07 | 13F | Keystone Financial Group, Inc. | 0 | -100,00 | 0 | |||||
| 2025-07-22 | 13F | Belpointe Asset Management LLC | 10.789 | 429 | ||||||
| 2025-07-21 | 13F | Patriot Financial Group Insurance Agency, LLC | 28.608 | 4,95 | 1.137 | 12,80 | ||||
| 2025-07-28 | 13F | Axxcess Wealth Management, Llc | 9.646 | 0,00 | 384 | 7,58 | ||||
| 2025-08-08 | 13F | Capital Investment Advisory Services, LLC | 574 | 28,70 | 23 | 37,50 | ||||
| 2025-08-14 | 13F | Aqr Capital Management Llc | 0 | -100,00 | 0 | |||||
| 2025-07-14 | 13F | CRA Financial Services, LLC | 24.770 | -5,35 | 985 | 1,65 | ||||
| 2025-07-22 | 13F | Diligent Investors, LLC | 17.652 | 55,50 | 702 | 66,90 | ||||
| 2025-08-12 | 13F | Jpmorgan Chase & Co | 3.230 | -74,77 | 128 | -72,94 | ||||
| 2025-09-04 | 13F/A | Advisor Group Holdings, Inc. | 494.108 | 25,35 | 19.646 | 34,67 | ||||
| 2025-07-24 | 13F | Blair William & Co/il | 97.837 | -38,00 | 3.890 | -33,41 | ||||
| 2025-08-11 | 13F | Anfield Capital Management, LLC | 327 | 13 | ||||||
| 2025-08-08 | 13F | Firestone Capital Management | 6.005 | 0,00 | 239 | 7,21 | ||||
| 2025-07-22 | 13F | Beacon Financial Advisory LLC | 9.600 | 23,87 | 382 | 33,22 | ||||
| 2025-08-14 | 13F | Benjamin Edwards Inc | 24.229 | 5,62 | 963 | 13,43 | ||||
| 2025-07-09 | 13F | Lineweaver Wealth Advisors, LLC | 310.594 | -0,96 | 12.349 | 6,40 | ||||
| 2025-07-29 | 13F | Stratos Wealth Advisors, LLC | 11.875 | -1,66 | 472 | 5,83 | ||||
| 2025-08-12 | 13F | Leigh Baldwin & Co., Llc | 10.525 | 11,08 | 418 | 19,43 | ||||
| 2025-08-15 | 13F | Captrust Financial Advisors | 39.846 | 43,14 | 1.584 | 53,79 |