Grundlæggende statistik
| Institutionelle ejere | 226 total, 226 long only, 0 short only, 0 long/short - change of 9,18% MRQ |
| Gennemsnitlig porteføljeallokering | 0.2543 % - change of 20,74% MRQ |
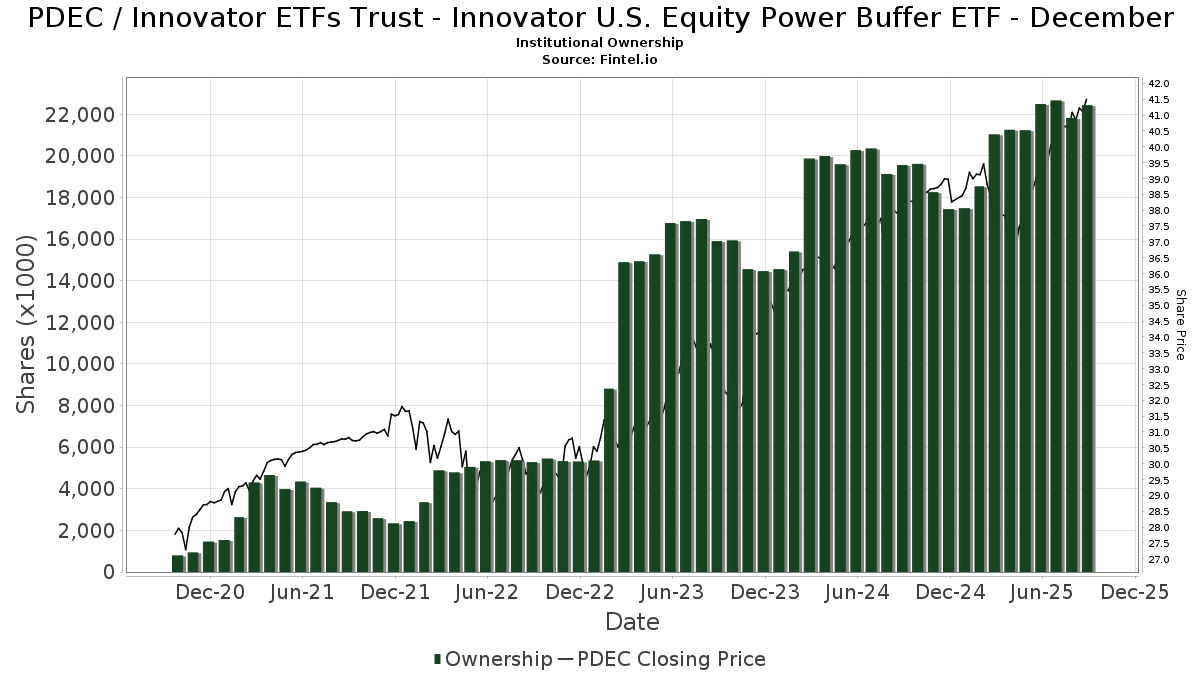
| Institutionelle aktier (lange) | 19.841.581 (ex 13D/G) - change of -1,32MM shares -6,22% MRQ |
| Institutionel værdi (lang) | $ 775.631 USD ($1000) |
Institutionelt ejerskab og aktionærer
Innovator ETFs Trust - Innovator U.S. Equity Power Buffer ETF - December (US:PDEC) har 226 institutionelle ejere og aktionærer, der har indsendt 13D/G- eller 13F-formularer til Securities Exchange Commission (SEC). Disse institutioner har i alt 19,841,581 aktier. Største aktionærer omfatter Alliancebernstein L.p., Innovator ETFs Trust - Innovator Laddered Fund of U.S. Equity Power Buffer ETFs, Penserra Capital Management LLC, Colony Group, LLC, Brookstone Capital Management, Advisor Group Holdings, Inc., Blair William & Co/il, Commonwealth Equity Services, Llc, LPL Financial LLC, and HighTower Advisors, LLC .
Innovator ETFs Trust - Innovator U.S. Equity Power Buffer ETF - December (BATS:PDEC) institutionel ejerskabsstruktur viser aktuelle positioner i virksomheden efter institutioner og fonde, samt seneste ændringer i positionsstørrelse. Større aktionærer kan omfatte individuelle investorer, investeringsforeninger, hedgefonde eller institutioner. Skema 13D angiver, at investoren besidder (eller besidder) mere end 5 % af virksomheden og har til hensigt (eller har til hensigt at) aktivt at forfølge en ændring i forretningsstrategi. Skema 13G indikerer en passiv investering på over 5%.
The share price as of March 6, 2026 is 43,17 / share. Previously, on March 7, 2025, the share price was 38,16 / share. This represents an increase of 13,13% over that period.
Fondens stemningsscore
Fund Sentiment Score (fka Ownership Accumulation Score) finder de aktier, der bliver mest købt af fonde. Det er resultatet af en sofistikeret, multi-faktor kvantitativ model, der identificerer virksomheder med de højeste niveauer af institutionel akkumulering. Scoringsmodellen bruger en kombination af den samlede stigning i oplyste ejere, ændringerne i porteføljeallokeringer i disse ejere og andre målinger. Tallet går fra 0 til 100, hvor højere tal indikerer et højere niveau af akkumulering for sine jævnaldrende, og 50 er gennemsnittet.
Opdateringsfrekvens: Dagligt
Se Ownership Explorer, som giver en liste over højest rangerende virksomheder.
AI+ Ask Fintel’s AI assistant about Innovator ETFs Trust - Innovator U.S. Equity Power Buffer ETF - December.
Select a question to share a public post with an AI-crafted answer.
Thinking of good questions…
Institutionel Put/Call-forhold
Ud over at indberette standardaktie- og gældsudstedelser skal institutter med mere end 100 mill. aktiver under forvaltning også oplyse deres put- og call-optionsbeholdninger. Da salgsoptioner generelt indikerer negativ stemning, og købsoptioner indikerer positiv stemning, kan vi få en fornemmelse af den overordnede institutionelle stemning ved at plotte forholdet mellem put og kald. Diagrammet til højre viser det historiske put/call-forhold for dette instrument.
Brug af Put/Call Ratio som en indikator for investorernes stemning overvinder en af de vigtigste mangler ved at bruge totalt institutionelt ejerskab, som er, at en betydelig mængde af aktiver under forvaltning investeres passivt for at spore indekser. Passivt forvaltede fonde køber typisk ikke optioner, så indikatoren for put/call-forholdet følger mere nøje følelsen af aktivt forvaltede fonde.
13F og NPORT arkivering
Detaljer om 13F-arkivering er gratis. Detaljer om NP-ansøgninger kræver et premium-medlemskab. Grønne rækker angiver nye positioner. Røde rækker angiver lukkede positioner. Klik på linket ikon for at se den fulde transaktionshistorik.
Opgrader
for at låse premium-data op og eksportere til Excel ![]() .
.
| Fil dato | Kilde | Investor | Type | Gennemsnitlig pris (Øst) |
Aktier | Δ Aktier (%) |
Rapporteret Værdi ($1000) |
Δ Værdi (%) |
Port Alloc (%) |
|
|---|---|---|---|---|---|---|---|---|---|---|
| 2026-01-23 | 13F | DHJJ Financial Advisors, Ltd. | 8.507 | -26,81 | 369 | -24,39 | ||||
| 2026-01-30 | 13F | Wagner Wealth Management, Llc | 1.980 | 0,00 | 86 | 2,41 | ||||
| 2026-02-10 | 13F | Evolution Wealth Management Inc. | 4.309 | 187 | ||||||
| 2026-02-12 | 13F | Principal Securities, Inc. | 0 | -100,00 | 0 | |||||
| 2026-02-05 | 13F | Allworth Financial LP | 7.208 | 156,97 | 313 | 166,67 | ||||
| 2026-02-09 | 13F | Atticus Wealth Management, Llc | 47.638 | -0,19 | 2.067 | 3,04 | ||||
| 2026-02-13 | 13F | McAdam, LLC | 9.314 | 32,91 | 404 | 37,41 | ||||
| 2026-02-14 | 13F | Whipplewood Advisors, LLC | 870 | 0,00 | 38 | 2,78 | ||||
| 2026-01-22 | 13F | City Holding Co | 17.975 | -4,77 | 780 | -1,77 | ||||
| 2026-02-17 | 13F | Advisor Group Holdings, Inc. | 786.638 | -38,29 | 34.124 | -35,37 | ||||
| 2026-02-03 | 13F | AssuredPartners Investment Advisors, LLC | 5.966 | 259 | ||||||
| 2026-01-14 | 13F | Lineweaver Wealth Advisors, LLC | 12.979 | 563 | ||||||
| 2026-02-13 | 13F | Financial Network Wealth Advisors LLC | 2.437 | 10,47 | 106 | 14,13 | ||||
| 2026-02-19 | 13F | ATX Financial Planning, LLC | 6.959 | 302 | ||||||
| 2026-01-28 | 13F | Evergreen Private Wealth LLC | 0 | -100,00 | 0 | |||||
| 2025-11-10 | 13F | Frisch Financial Group, Inc. | 0 | -100,00 | 0 | |||||
| 2025-11-14 | 13F | CI Private Wealth, LLC | 0 | -100,00 | 0 | |||||
| 2026-02-05 | 13F | Northwestern Mutual Wealth Management Co | 3 | -99,66 | 0 | -100,00 | ||||
| 2026-02-18 | 13F | Beacon Pointe Advisors, LLC | 176.952 | 10,31 | 7.676 | 13,89 | ||||
| 2026-02-20 | 13F | Sunbelt Securities, Inc. | 27 | 0,00 | 1 | 0,00 | ||||
| 2026-02-13 | 13F | Morgan Stanley | 1.575 | 0,00 | 68 | 3,03 | ||||
| 2026-02-10 | 13F | Goldstein Advisors, LLC | 4.679 | 203 | ||||||
| 2026-02-11 | 13F | Cerity Partners LLC | 66.269 | 2,71 | 2.875 | 6,01 | ||||
| 2026-02-18 | 13F | GWM Advisors LLC | 57.254 | 0,05 | 2.484 | 3,29 | ||||
| 2026-01-22 | 13F | Yarger Wealth Strategies, Llc | 74.230 | -0,97 | 3.220 | 2,25 | ||||
| 2026-02-17 | 13F | Cape Investment Advisory, Inc. | 5.200 | 226 | ||||||
| 2025-10-22 | 13F | Keystone Wealth Services, LLC | 0 | -100,00 | 0 | |||||
| 2026-01-23 | 13F | Castellan Group, LLC | 12.186 | -31,00 | 529 | -28,84 | ||||
| 2026-01-29 | 13F | Global Strategic Investment Solutions, LLC | 153.303 | -4,86 | 6.650 | -1,79 | ||||
| 2026-02-03 | 13F | RFG Advisory, LLC | 12.324 | -0,31 | 535 | 2,89 | ||||
| 2026-02-17 | 13F | Mercer Global Advisors Inc /adv | 25.547 | 0,00 | 1.108 | 3,26 | ||||
| 2026-02-03 | 13F | Capstone Triton Financial Group, LLC | 16.205 | 0,00 | 703 | 3,24 | ||||
| 2026-01-09 | 13F | Dynamic Advisor Solutions LLC | 13.472 | 2,64 | 584 | 5,99 | ||||
| 2026-02-09 | 13F | Blue Bell Private Wealth Management, Llc | 2.018 | -12,38 | 88 | -9,37 | ||||
| 2026-02-17 | 13F | Advisory Services Network, LLC | 36.992 | 3,47 | 1.605 | 6,79 | ||||
| 2026-01-23 | 13F | Retirement Guys Formula Llc | 40.103 | 1.740 | ||||||
| 2026-02-17 | 13F | IHT Wealth Management, LLC | 4.769 | 208 | ||||||
| 2026-02-03 | 13F | Allegiance Financial Group Advisory Services LLC | 11.458 | 28,24 | 497 | 32,53 | ||||
| 2026-01-23 | 13F | Blue Sky Capital Consultants Group, Inc. | 17.049 | 249,65 | 740 | 262,25 | ||||
| 2025-11-14 | 13F | Snowden Capital Advisors LLC | 0 | -100,00 | 0 | |||||
| 2026-01-26 | 13F | Nations Financial Group Inc, /ia/ /adv | 25.348 | -36,92 | 1.100 | -34,89 | ||||
| 2026-01-16 | 13F | CRA Financial Services, LLC | 135.214 | -17,36 | 5.866 | -14,69 | ||||
| 2026-02-11 | 13F | Capital Analysts, Inc. | 84.937 | -32,08 | 4 | -40,00 | ||||
| 2026-02-17 | 13F | Gladstone Institutional Advisory LLC | 4.700 | 204 | ||||||
| 2026-02-06 | 13F | Brown Wealth Management, Llc | 11.292 | -62,78 | 490 | -61,62 | ||||
| 2025-11-13 | 13F | UBS Group AG | 0 | -100,00 | 0 | |||||
| 2026-01-23 | 13F | Galvin, Gaustad & Stein, LLC | 10.371 | 450 | ||||||
| 2026-02-12 | 13F | Brown Brothers Harriman & Co | 5.766 | 0,00 | 250 | 3,31 | ||||
| 2026-02-09 | 13F | Keating Financial Advisory Services, Inc. | 80.678 | 3.500 | ||||||
| 2026-02-13 | 13F | Resources Investment Advisors, LLC. | 84.355 | 3,69 | 3.659 | 7,05 | ||||
| 2026-01-02 | 13F | Global Wealth Strategies & Associates | 165 | -93,07 | 7 | -93,00 | ||||
| 2026-02-11 | 13F | Tradition Wealth Management, LLC | 48.580 | 6,47 | 2.107 | 9,91 | ||||
| 2026-02-17 | 13F | Alliancebernstein L.p. | 3.273.654 | -26,24 | 142.011 | -23,85 | ||||
| 2026-01-14 | 13F | Chris Bulman Inc | 57.698 | 39,60 | 2.503 | 44,12 | ||||
| 2026-02-11 | 13F | Atlantic Private Wealth, LLC | 877 | 38 | ||||||
| 2026-02-17 | 13F | Susquehanna International Group, Llp | 41.811 | -89,67 | 1.814 | -89,33 | ||||
| 2026-02-13 | 13F | Barclays Plc | 0 | -100,00 | 0 | |||||
| 2026-02-13 | 13F | Capital Square, LLC | 7.336 | 42,97 | 318 | 47,91 | ||||
| 2026-02-09 | 13F | Coldstream Capital Management Inc | 6.162 | -42,09 | 267 | -40,27 | ||||
| 2026-02-11 | 13F | Outlook Wealth Advisors, LLC | 110.881 | 0,33 | 4.810 | 3,60 | ||||
| 2026-02-17 | 13F | Ameriflex Group, Inc. | 5.969 | -50,00 | 259 | -48,50 | ||||
| 2026-02-10 | 13F | Envestnet Asset Management Inc | 229.687 | -12,65 | 9.964 | -9,83 | ||||
| 2026-01-12 | 13F | Focus Financial Network, Inc. | 8.190 | 0,00 | 355 | 3,20 | ||||
| 2026-02-13 | 13F | Gts Securities Llc | 0 | -100,00 | 0 | |||||
| 2026-01-15 | 13F | SILVER OAK SECURITIES, Inc | 25.735 | 188,02 | 1.121 | 198,67 | ||||
| 2026-01-23 | 13F/A | Greenup Street Wealth Management Llc | 7.639 | 0,00 | 331 | 3,44 | ||||
| 2026-01-30 | 13F | Sigma Planning Corp | 10.327 | -16,97 | 448 | -14,37 | ||||
| 2026-02-05 | 13F | Cambridge Investment Research Advisors, Inc. | 137.174 | -18,80 | 6 | -28,57 | ||||
| 2026-02-12 | 13F | Jane Street Group, Llc | 46.437 | 605,30 | 2.014 | 629,71 | ||||
| 2026-02-12 | 13F | BlackRock, Inc. | 1.928 | 84 | ||||||
| 2026-02-12 | 13F | CIBC Private Wealth Group, LLC | 539 | 0,00 | 23 | 4,55 | ||||
| 2026-01-12 | 13F | Certified Advisory Corp | 0 | -100,00 | 0 | |||||
| 2026-02-17 | 13F | Aqr Capital Management Llc | 9.479 | 75,24 | 411 | 81,06 | ||||
| 2026-02-17 | 13F | Royal Bank Of Canada | 0 | -100,00 | 0 | |||||
| 2026-01-22 | 13F | Weaver Capital Management LLC | 68.667 | -12,68 | 2.979 | -9,87 | ||||
| 2026-02-10 | 13F | Continuum Advisory, LLC | 17.266 | 0,02 | 749 | 3,17 | ||||
| 2026-02-12 | 13F | Hrt Financial Lp | 0 | -100,00 | 0 | |||||
| 2026-02-13 | 13F | Kestra Advisory Services, LLC | 0 | -100,00 | 0 | |||||
| 2026-02-18 | 13F | Garton & Associates Financial Advisors LLC | 800 | 35 | ||||||
| 2026-01-21 | 13F | MBL Wealth, LLC | 130.205 | 8,08 | 5.648 | 11,58 | ||||
| 2026-02-06 | 13F | IFP Advisors, Inc | 32.413 | -17,09 | 1.406 | -14,37 | ||||
| 2026-01-14 | 13F | Southland Equity Partners LLC | 60.874 | -5,71 | 2.641 | -2,65 | ||||
| 2026-01-20 | 13F | AdvisorNet Financial, Inc | 21.264 | 23,66 | 922 | 27,70 | ||||
| 2026-02-13 | 13F | MAI Capital Management | 68.927 | 55,05 | 2.990 | 60,06 | ||||
| 2025-09-24 | NP | Innovator ETFs Trust - Innovator Laddered Fund of U.S. Equity Power Buffer ETFs | 1.495.201 | 16,73 | 60.675 | 26,49 | ||||
| 2026-02-02 | 13F | Grantvest Financial Group LLC | 6.837 | -0,78 | 297 | 2,42 | ||||
| 2026-01-23 | 13F | U.S. Capital Wealth Advisors, LLC | 15.480 | 19,55 | 672 | 23,35 | ||||
| 2026-02-13 | 13F | Integrated Wealth Concepts LLC | 10.125 | 0,00 | 439 | 3,29 | ||||
| 2026-02-13 | 13F | Clay Northam Wealth Management, LLC | 11.200 | 58,87 | 486 | 63,85 | ||||
| 2026-01-20 | 13F | Signaturefd, Llc | 54.072 | 0,00 | 2.346 | 3,21 | ||||
| 2026-02-11 | 13F | Townsquare Capital Llc | 0 | -100,00 | 0 | -100,00 | ||||
| 2026-02-06 | 13F | Vestmark Advisory Solutions, Inc. | 8.000 | -4,19 | 347 | -0,86 | ||||
| 2026-01-14 | 13F | First City Capital Management, Inc. | 22.480 | 356,45 | 975 | 373,30 | ||||
| 2026-01-08 | 13F | Sound View Wealth Advisors Group, LLC | 7.008 | 6,13 | 304 | 9,75 | ||||
| 2026-01-28 | 13F | HB Wealth Management, LLC | 21.701 | 0,00 | 941 | 3,29 | ||||
| 2026-02-10 | 13F | Ritter Daniher Financial Advisory LLC / DE | 2.485 | 108 | ||||||
| 2026-01-15 | 13F | Three Seasons Wealth, LLC | 22.950 | 0,00 | 996 | 3,22 | ||||
| 2026-02-13 | 13F | Jacobi Capital Management LLC | 62.916 | 0,00 | 2.729 | 3,25 | ||||
| 2026-02-03 | 13F | Anfield Capital Management, LLC | 322 | 0,00 | 14 | 0,00 | ||||
| 2026-02-10 | 13F | Weaver Consulting Group | 55.106 | 0,95 | 2.390 | 4,23 | ||||
| 2026-01-20 | 13F | Hubbell Strickland Wealth Management, LLC | 5.231 | 0,00 | 227 | 3,20 | ||||
| 2026-02-11 | 13F | XML Financial, LLC | 5.810 | 252 | ||||||
| 2026-02-04 | 13F | BCJ Capital Management, LLC | 93.007 | -7,04 | 4.035 | -4,02 | ||||
| 2026-02-05 | 13F | Blue Water Asset Management | 11.262 | 489 | ||||||
| 2026-01-28 | 13F | Milestone Asset Management, Llc | 55.852 | -4,46 | 2.423 | -1,38 | ||||
| 2026-01-09 | 13F | Ptm Wealth Management, Llc | 32.444 | -0,12 | 1.414 | 3,21 | ||||
| 2026-01-30 | 13F | Archer Investment Corp | 0 | -100,00 | 0 | -100,00 | ||||
| 2026-01-15 | 13F | Bernard Wealth Management Corp. | 3.021 | -0,53 | 131 | 3,15 | ||||
| 2026-01-29 | 13F | Concurrent Investment Advisors, LLC | 46.259 | 4,65 | 2.007 | 8,02 | ||||
| 2026-02-11 | 13F | Waddell & Associates, Llc | 5.030 | 0,00 | 218 | 3,32 | ||||
| 2026-02-09 | 13F | Integrity Advisory Solutions, LLC | 13.195 | 572 | ||||||
| 2026-01-28 | 13F | Bedel Financial Consulting, Inc. | 5.908 | 0,00 | 256 | 3,23 | ||||
| 2026-01-26 | 13F | WorthPointe, LLC | 4.914 | 0,00 | 213 | 3,40 | ||||
| 2026-02-03 | 13F | Liberty Atlantic Advisors LLC | 39.693 | 1.722 | ||||||
| 2026-02-06 | 13F | HighTower Advisors, LLC | 520.988 | 3,65 | 22.600 | 7,01 | ||||
| 2026-02-10 | 13F | Rothschild Investment Llc | 330 | 0,00 | 14 | 7,69 | ||||
| 2025-11-14 | 13F | Citadel Advisors Llc | 0 | -100,00 | 0 | -100,00 | ||||
| 2026-01-28 | 13F | Crown Wealth Group, LLC | 5.224 | -90,05 | 227 | -89,75 | ||||
| 2026-02-13 | 13F | Ausdal Financial Partners, Inc. | 5.068 | -35,60 | 220 | -33,64 | ||||
| 2026-01-21 | 13F | Sowell Financial Services LLC | 5.240 | 6,07 | 227 | 9,66 | ||||
| 2026-02-13 | 13F | SRS Capital Advisors, Inc. | 8.077 | 350 | ||||||
| 2026-02-09 | 13F | Integrity Alliance, Llc. | 4.698 | 204 | ||||||
| 2026-02-06 | 13F | Axxcess Wealth Management, Llc | 9.257 | 0,00 | 402 | 3,35 | ||||
| 2026-01-30 | 13F | Strategic Blueprint, LLC | 0 | -100,00 | 0 | |||||
| 2026-01-16 | 13F | PFS Partners, LLC | 3.200 | 0,00 | 139 | 2,99 | ||||
| 2026-01-29 | 13F | Quest 10 Wealth Builders, Inc. | 17.030 | 0,00 | 739 | 3,22 | ||||
| 2026-02-02 | 13F | Mutual Advisors, LLC | 15.720 | 49,57 | 682 | 53,38 | ||||
| 2025-11-13 | 13F | West Michigan Advisors, Llc | 0 | -100,00 | 0 | |||||
| 2026-02-13 | 13F | Wealth Alliance | 38.717 | 4,68 | 1.680 | 8,04 | ||||
| 2026-01-26 | 13F | AE Wealth Management LLC | 41.599 | 37,25 | 1.805 | 41,71 | ||||
| 2026-02-17 | 13F | First Commonwealth Financial Corp /pa/ | 106.359 | 14,13 | 4.614 | 17,83 | ||||
| 2026-01-30 | 13F | Delta Investment Management, LLC | 5.818 | 252 | ||||||
| 2026-01-12 | 13F | ARS Wealth Advisors Group, LLC | 11.601 | 0,00 | 503 | 3,29 | ||||
| 2026-02-10 | 13F | Gill Capital Partners, Llc | 116.124 | 7,77 | 5.037 | 11,27 | ||||
| 2026-01-15 | 13F | Nikulski Financial, Inc. | 9.326 | 60,79 | 405 | 66,26 | ||||
| 2026-01-28 | 13F | CAPROCK Group, Inc. | 259.763 | 11.269 | ||||||
| 2026-01-23 | 13F | Pinnacle Wealth Management Group, Inc. | 72.255 | 7,46 | 3.134 | 10,94 | ||||
| 2026-01-29 | 13F | Nbc Securities, Inc. | 581 | 98,97 | 25 | 108,33 | ||||
| 2025-11-06 | 13F | Ameritas Advisory Services, LLC | 0 | -100,00 | 0 | -100,00 | ||||
| 2026-01-12 | 13F | Evolution Wealth Advisors, LLC | 14.305 | 0,00 | 621 | 3,16 | ||||
| 2026-02-11 | 13F | Jessup Wealth Management, Inc | 3.870 | -37,47 | 168 | -35,77 | ||||
| 2026-02-10 | 13F | Madison Wealth Partners, Inc | 4.868 | 0,00 | 211 | 3,43 | ||||
| 2025-10-22 | 13F | Stuart Chaussee & Associates, Inc. | 0 | -100,00 | 0 | |||||
| 2026-02-13 | 13F | Visionary Wealth Advisors | 23.435 | -1,99 | 1.017 | 1,20 | ||||
| 2026-02-09 | 13F | TrustBank | 17.346 | 752 | ||||||
| 2026-02-05 | 13F | ORBA Wealth Advisors, L.L.C. | 0 | -100,00 | 0 | |||||
| 2026-02-05 | 13F | Castle Rock Wealth Management, LLC | 83.898 | -3,54 | 3.651 | -0,16 | ||||
| 2026-01-22 | 13F | Castle Wealth Management Llc | 7.096 | 308 | ||||||
| 2026-02-10 | 13F | COFG Advisors, LLC | 5.268 | 229 | ||||||
| 2025-10-24 | 13F | ORG Partners LLC | 0 | -100,00 | 0 | |||||
| 2026-02-09 | 13F | Firestone Capital Management | 5.164 | -48,97 | 224 | -47,29 | ||||
| 2026-01-14 | 13F | Spire Wealth Management | 21.622 | 11,97 | 938 | 15,54 | ||||
| 2026-02-09 | 13F | Harbour Investments, Inc. | 50.123 | -9,57 | 2.174 | -6,66 | ||||
| 2026-02-02 | 13F | Chapman Financial Group, Llc | 300 | 0,00 | 13 | 8,33 | ||||
| 2026-01-26 | 13F | Patriot Financial Group Insurance Agency, LLC | 30.907 | 5,15 | 1.341 | 8,50 | ||||
| 2026-02-17 | 13F | Private Advisor Group, LLC | 11.555 | 501 | ||||||
| 2026-02-12 | 13F | TopTier Wealth Management, LLC | 19.310 | 838 | ||||||
| 2026-02-06 | 13F | EverSource Wealth Advisors, LLC | 1.985 | 0,00 | 86 | 3,61 | ||||
| 2026-01-07 | 13F | Lakeridge Wealth Management LLC | 14.729 | 39,39 | 639 | 43,69 | ||||
| 2026-02-02 | 13F | Ascent Wealth Partners, LLC | 32.911 | 14,53 | 1.428 | 18,23 | ||||
| 2026-02-09 | 13F | William Mack & Associates, Inc. | 4.760 | 206 | ||||||
| 2026-01-08 | 13F | Old Port Advisors | 12.380 | 16,24 | 537 | 20,13 | ||||
| 2026-01-22 | 13F | Evermay Wealth Management Llc | 2.235 | 97 | ||||||
| 2026-02-17 | 13F | Raymond James Financial Inc | 258.350 | 30,18 | 11.207 | 34,41 | ||||
| 2026-02-02 | 13F | Miracle Mile Advisors, LLC | 8.352 | 0,00 | 362 | 3,43 | ||||
| 2026-02-13 | 13F | Pathstone Holdings, LLC | 211.271 | -0,04 | 9.536 | 2,91 | ||||
| 2026-02-17 | 13F | Blair William & Co/il | 755.492 | 1,47 | 32.773 | 4,75 | ||||
| 2026-01-14 | 13F | Cypress Financial Planning Llc | 6.837 | -49,41 | 298 | -47,62 | ||||
| 2026-02-06 | 13F | Advisory Alpha, LLC | 12.030 | -58,94 | 522 | -57,71 | ||||
| 2026-02-12 | 13F | Helium Advisors LLC | 0 | -100,00 | 0 | |||||
| 2026-02-27 | 13F | Compass Financial Services Inc | 1.968 | 0,00 | 85 | 3,66 | ||||
| 2026-02-10 | 13F | Calton & Associates, Inc. | 7.738 | 28,71 | 336 | 32,94 | ||||
| 2026-02-13 | 13F | Change Path, LLC | 23.382 | 21,67 | 1.014 | 25,65 | ||||
| 2026-02-13 | 13F | Mml Investors Services, Llc | 140.124 | 65,74 | 6.079 | 71,11 | ||||
| 2026-02-13 | 13F | Mariner, LLC | 123.009 | -20,70 | 5.336 | -18,12 | ||||
| 2026-02-11 | 13F | Fortune Financial Group, Inc. | 56.677 | 2 | ||||||
| 2026-02-10 | 13F | BKD Wealth Advisors, LLC | 64.864 | -6,21 | 2.814 | -3,17 | ||||
| 2026-02-09 | 13F | Bellwether Advisors, LLC | 248.755 | 24,99 | 10.791 | 29,02 | ||||
| 2026-02-05 | 13F | Phoenix Holdings Ltd. | 18.680 | 0,21 | 812 | 3,97 | ||||
| 2026-01-13 | 13F | CoreCap Advisors, LLC | 131.734 | 20,59 | 5.715 | 24,49 | ||||
| 2026-01-26 | 13F | Cwm, Llc | 5.082 | -5,96 | 0 | |||||
| 2026-01-13 | 13F | Dakota Wealth Management | 10.942 | 112,59 | 475 | 119,44 | ||||
| 2026-01-27 | 13F | Belpointe Asset Management LLC | 154.903 | 10,80 | 6.720 | 14,39 | ||||
| 2026-02-05 | 13F | AlphaCore Capital LLC | 65.800 | 0,00 | 2.854 | 3,26 | ||||
| 2026-02-17 | 13F | Garden State Investment Advisory Services LLC | 11.404 | 2,92 | 495 | 6,24 | ||||
| 2026-02-13 | 13F | WPWealth LLP | 15.320 | 0,00 | 665 | 3,27 | ||||
| 2026-01-20 | 13F | Stratos Wealth Advisors, LLC | 10.948 | 475 | ||||||
| 2026-01-23 | 13F | Diligent Investors, LLC | 66.056 | 4,97 | 2.866 | 8,36 | ||||
| 2026-02-17 | 13F | Old Mission Capital Llc | 0 | -100,00 | 0 | |||||
| 2026-01-26 | 13F | BCS Wealth Management | 105.022 | 113,31 | 4.556 | 120,26 | ||||
| 2026-02-12 | 13F | Commonwealth Equity Services, Llc | 661.697 | 11,99 | 28.704 | 119.500,00 | ||||
| 2026-01-23 | 13F | Farther Finance Advisors, LLC | 44.248 | -13,23 | 1.919 | -10,41 | ||||
| 2026-01-21 | 13F | Modera Wealth Management, LLC | 11.531 | 0,00 | 500 | 3,31 | ||||
| 2026-02-11 | 13F | LPL Financial LLC | 628.763 | 17,39 | 27.276 | 21,19 | ||||
| 2026-02-12 | 13F | Wedbush Securities Inc | 7.482 | -9,29 | 0 | |||||
| 2026-01-21 | 13F | Kfg Wealth Management, Llc | 78.722 | -19,32 | 3.415 | -16,73 | ||||
| 2025-11-10 | 13F | Siligmueller & Norvid Wealth Advisors LLC | 0 | -100,00 | 0 | |||||
| 2026-01-21 | 13F | Long Island Wealth Management, Inc. | 26.524 | 0,00 | 1.151 | 3,23 | ||||
| 2026-02-17 | 13F | Cetera Investment Advisers | 348.330 | 19,27 | 15.111 | 23,13 | ||||
| 2026-02-03 | 13F | Emerald Investment Partners, Llc | 5.582 | 59,49 | 242 | 64,63 | ||||
| 2025-11-14 | 13F | Bank Of America Corp /de/ | 0 | -100,00 | 0 | |||||
| 2026-01-07 | 13F | Sagespring Wealth Partners, Llc | 39.080 | 145,54 | 1.695 | 153,74 | ||||
| 2026-02-02 | 13F | FSA Advisors, Inc. | 29.385 | 0,91 | 1.275 | 4,17 | ||||
| 2026-01-26 | 13F | Cornerstone Wealth Group, LLC | 10.964 | -8,35 | 476 | -5,38 | ||||
| 2026-01-26 | 13F | Merit Financial Group, LLC | 11.218 | 128,52 | 487 | 135,92 | ||||
| 2026-01-05 | 13F | Noble Wealth Management PBC | 58.749 | -16,14 | 2.549 | -13,42 | ||||
| 2026-02-19 | 13F | BFI Wealth Solutions, LLC | 15.456 | 670 | ||||||
| 2025-10-28 | 13F | Phoenix Wealth Advisors | 0 | -100,00 | 0 | |||||
| 2026-02-12 | 13F | Steward Partners Investment Advisory, Llc | 69.833 | 1,72 | 3.029 | 5,03 | ||||
| 2026-02-02 | 13F | Vantage Point Financial LLC | 6.777 | 0,68 | 294 | 3,90 | ||||
| 2026-02-02 | 13F | Truist Financial Corp | 153.094 | 2,78 | 6.641 | 6,12 | ||||
| 2026-02-05 | 13F | Atria Investments Llc | 107.551 | -25,18 | 4.666 | -22,75 | ||||
| 2025-10-16 | 13F | HBW Advisory Services LLC | 0 | -100,00 | 0 | -100,00 | ||||
| 2026-02-04 | 13F | HORAN Wealth, LLC | 11.838 | 0,00 | 514 | 3,22 | ||||
| 2025-11-12 | 13F | Kingsview Wealth Management, LLC | 0 | -100,00 | 0 | |||||
| 2026-01-23 | 13F | Diversify Advisory Services, LLC | 10.225 | -3,76 | 447 | -1,11 | ||||
| 2026-02-20 | 13F | Kovitz Investment Group Partners, LLC | 0 | -100,00 | 0 | |||||
| 2026-02-12 | 13F | Wood Tarver Financial Group, LLC | 7.470 | -0,39 | 0 | |||||
| 2026-02-11 | 13F | Gwn Securities Inc. | 0 | -100,00 | 0 | |||||
| 2026-01-16 | 13F | Catalina Capital Group, LLC | 117.640 | 5.103 | ||||||
| 2026-02-05 | 13F | WealthPlan Investment Management, LLC | 5.136 | 0,00 | 223 | 3,26 | ||||
| 2026-01-26 | 13F | Key Capital Management, INC | 1.065 | 46 | ||||||
| 2026-01-07 | 13F | BCGM Wealth Management, LLC | 5.752 | 0,00 | 250 | 3,32 | ||||
| 2026-02-17 | 13F | Captrust Financial Advisors | 44.543 | 174,28 | 1.932 | 183,28 | ||||
| 2026-02-17 | 13F | SageView Advisory Group, LLC | 3.363 | -98,18 | 146 | -98,13 | ||||
| 2026-02-10 | 13F | Foundations Investment Advisors, LLC | 46.156 | -77,78 | 2.002 | -77,06 | ||||
| 2026-02-13 | 13F | TSG Advice Partners, LLC | 13.906 | 603 | ||||||
| 2026-01-08 | 13F | Wealth Enhancement Advisory Services, Llc | 202.000 | 182,67 | 8.813 | 193,08 | ||||
| 2026-01-26 | 13F | Valmark Advisers, Inc. | 25.876 | 13,38 | 1.123 | 17,00 | ||||
| 2026-02-11 | 13F | Jpmorgan Chase & Co | 874 | -0,23 | 38 | 2,78 | ||||
| 2026-02-06 | 13F | Csenge Advisory Group | 16.250 | 0,00 | 705 | 3,23 | ||||
| 2026-02-10 | 13F | Corrado Advisors, Llc | 79.075 | 10,93 | 3.430 | 14,52 | ||||
| 2026-01-21 | 13F | Compass Advisory Group LLC | 72.674 | 6,07 | 3.153 | 9,52 | ||||
| 2026-02-04 | 13F | Pensionmark Financial Group, Llc | 13.982 | 6,45 | 550 | -0,18 | ||||
| 2026-01-16 | 13F | Keystone Financial Group, Inc. | 9.826 | 0,00 | 426 | 3,40 | ||||
| 2026-01-26 | 13F | O'Connor Financial Group LLC | 0 | -100,00 | 0 | |||||
| 2026-02-13 | 13F | Colony Group, LLC | 1.112.771 | 4.413,19 | 48.272 | 4.559,46 | ||||
| 2026-02-11 | 13F | Buckingham Strategic Partners | 0 | -100,00 | 0 | -100,00 | ||||
| 2026-02-13 | 13F | Arkadios Wealth Advisors | 26.595 | 354,07 | 1.154 | 368,70 | ||||
| 2026-02-03 | 13F | We Are One Seven, LLC | 29.354 | 2,83 | 1.273 | 6,17 | ||||
| 2026-01-14 | 13F | Cypress Wealth Services, LLC | 7.232 | 0,00 | 314 | 3,30 | ||||
| 2026-01-21 | 13F | Capital Investment Advisory Services, LLC | 8.293 | 1,78 | 360 | 4,97 | ||||
| 2026-02-03 | 13F | Orion Capital Management LLC | 20.988 | 5,49 | 910 | 8,98 | ||||
| 2026-02-10 | 13F | Waterloo Capital, L.P. | 13.582 | -0,91 | 589 | 2,43 | ||||
| 2026-02-11 | 13F | Janney Montgomery Scott LLC | 124.609 | 24,50 | 5 | 25,00 | ||||
| 2026-02-17 | 13F | Cresset Asset Management, LLC | 51.902 | 5,40 | 2.251 | 8,80 | ||||
| 2026-01-15 | 13F | Brookstone Capital Management | 840.921 | 411,99 | 36.479 | 428,60 | ||||
| 2026-02-05 | 13F | Soltis Investment Advisors LLC | 264.142 | 4,91 | 11.458 | 8,31 | ||||
| 2026-02-12 | 13F | Penserra Capital Management LLC | 1.450.062 | -2,70 | 63 | 0,00 | ||||
| 2026-01-27 | 13F | Elevated Capital Advisors, LLC | 176 | 8 | ||||||
| 2026-02-03 | 13F | Mma Asset Management Llc | 12.470 | -49,96 | 541 | -48,42 | ||||
| 2026-02-10 | 13F | NewCorp Financial Services, Inc. | 15.538 | 674 | ||||||
| 2025-10-07 | 13F | Sanders Morris Harris Llc | 0 | -100,00 | 0 | |||||
| 2026-02-06 | 13F | Creative Financial Designs Inc /adv | 2.775 | -1,07 | 120 | 2,56 | ||||
| 2026-01-30 | 13F | Pacific Park Financial, Inc. | 9.620 | 417 | ||||||
| 2026-02-09 | 13F | Valtinson Bruner Financial Planning LLC | 9.038 | 3,29 | 392 | 6,81 | ||||
| 2026-02-09 | 13F | Annis Gardner Whiting Capital Advisors, LLC | 16.164 | 0,00 | 701 | 3,24 | ||||
| 2026-02-13 | 13F | Beacon Financial Advisory LLC | 13.212 | 3,32 | 573 | 6,70 | ||||
| 2026-01-27 | 13F | Retirement Income Solutions, Inc | 29.708 | -23,19 | 1.289 | -20,74 | ||||
| 2026-02-13 | 13F | Maia Wealth LLC | 4.761 | 0,00 | 206 | 1,48 |