Grundlæggende statistik
| Institutionelle ejere | 58 total, 57 long only, 0 short only, 1 long/short - change of -10,77% MRQ |
| Gennemsnitlig porteføljeallokering | 0.0248 % - change of 19,97% MRQ |
| Institutionelle aktier (lange) | 4.562.571 (ex 13D/G) - change of -1,64MM shares -26,46% MRQ |
| Institutionel værdi (lang) | $ 7.818 USD ($1000) |
Institutionelt ejerskab og aktionærer
Oxford Square Capital Corp. (US:OXSQ) har 58 institutionelle ejere og aktionærer, der har indsendt 13D/G- eller 13F-formularer til Securities Exchange Commission (SEC). Disse institutioner har i alt 4,562,571 aktier. Største aktionærer omfatter Legal & General Group Plc, Two Sigma Investments, Lp, BlackRock, Inc., Squarepoint Ops LLC, Two Sigma Advisers, Lp, UBS Group AG, Virtus Investment Advisers, Inc., VPC - Virtus Private Credit Strategy ETF, Bank Of America Corp /de/, and Moloney Securities Asset Management, LLC .
Oxford Square Capital Corp. (NasdaqGS:OXSQ) institutionel ejerskabsstruktur viser aktuelle positioner i virksomheden efter institutioner og fonde, samt seneste ændringer i positionsstørrelse. Større aktionærer kan omfatte individuelle investorer, investeringsforeninger, hedgefonde eller institutioner. Skema 13D angiver, at investoren besidder (eller besidder) mere end 5 % af virksomheden og har til hensigt (eller har til hensigt at) aktivt at forfølge en ændring i forretningsstrategi. Skema 13G indikerer en passiv investering på over 5%.
The share price as of March 12, 2026 is 1,75 / share. Previously, on March 13, 2025, the share price was 2,67 / share. This represents a decline of 34,46% over that period.

Fondens stemningsscore
Fund Sentiment Score (fka Ownership Accumulation Score) finder de aktier, der bliver mest købt af fonde. Det er resultatet af en sofistikeret, multi-faktor kvantitativ model, der identificerer virksomheder med de højeste niveauer af institutionel akkumulering. Scoringsmodellen bruger en kombination af den samlede stigning i oplyste ejere, ændringerne i porteføljeallokeringer i disse ejere og andre målinger. Tallet går fra 0 til 100, hvor højere tal indikerer et højere niveau af akkumulering for sine jævnaldrende, og 50 er gennemsnittet.
Opdateringsfrekvens: Dagligt
Se Ownership Explorer, som giver en liste over højest rangerende virksomheder.
AI+ Ask Fintel’s AI assistant about Oxford Square Capital Corp..
Select a question to share a public post with an AI-crafted answer.
Thinking of good questions…
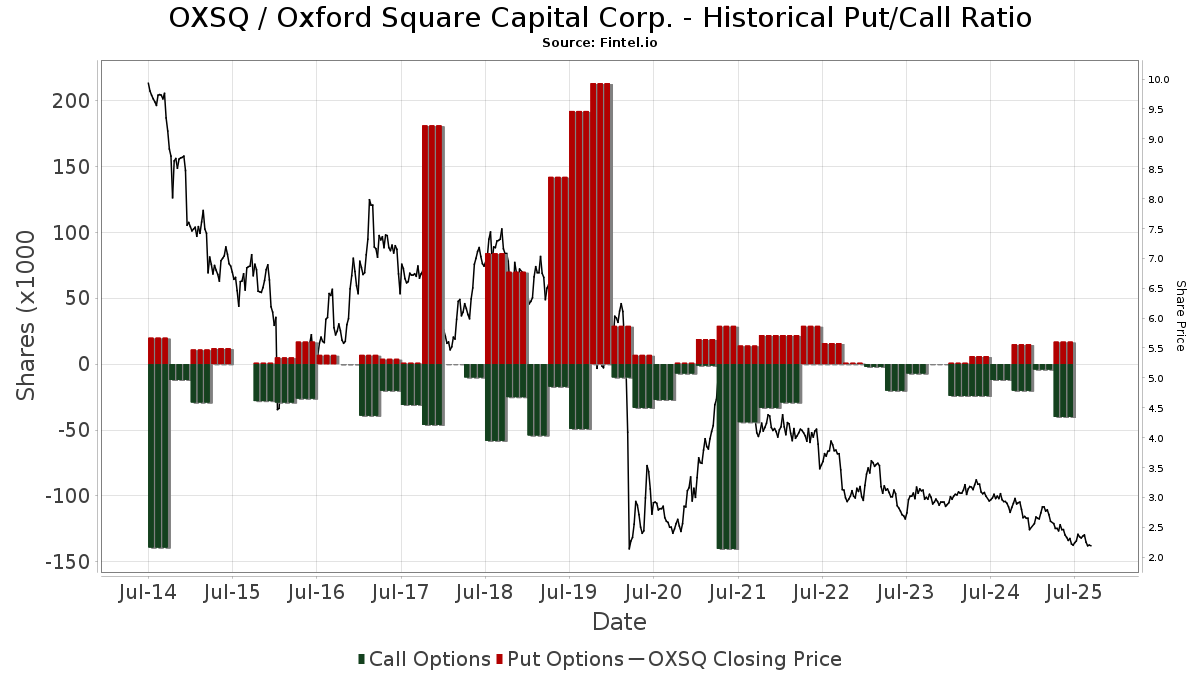
Institutionel Put/Call-forhold
Ud over at indberette standardaktie- og gældsudstedelser skal institutter med mere end 100 mill. aktiver under forvaltning også oplyse deres put- og call-optionsbeholdninger. Da salgsoptioner generelt indikerer negativ stemning, og købsoptioner indikerer positiv stemning, kan vi få en fornemmelse af den overordnede institutionelle stemning ved at plotte forholdet mellem put og kald. Diagrammet til højre viser det historiske put/call-forhold for dette instrument.
Brug af Put/Call Ratio som en indikator for investorernes stemning overvinder en af de vigtigste mangler ved at bruge totalt institutionelt ejerskab, som er, at en betydelig mængde af aktiver under forvaltning investeres passivt for at spore indekser. Passivt forvaltede fonde køber typisk ikke optioner, så indikatoren for put/call-forholdet følger mere nøje følelsen af aktivt forvaltede fonde.
13F og NPORT arkivering
Detaljer om 13F-arkivering er gratis. Detaljer om NP-ansøgninger kræver et premium-medlemskab. Grønne rækker angiver nye positioner. Røde rækker angiver lukkede positioner. Klik på linket ikon for at se den fulde transaktionshistorik.
Opgrader
for at låse premium-data op og eksportere til Excel ![]() .
.
| Fil dato | Kilde | Investor | Type | Gennemsnitlig pris (Øst) |
Aktier | Δ Aktier (%) |
Rapporteret Værdi ($1000) |
Δ Værdi (%) |
Port Alloc (%) |
|
|---|---|---|---|---|---|---|---|---|---|---|
| 2026-02-11 | 13F | Tiaa Trust, National Association | 0 | -100,00 | 0 | -100,00 | ||||
| 2026-02-17 | 13F | Susquehanna International Group, Llp | 29.260 | -25,91 | 51 | -17,74 | ||||
| 2026-02-17 | 13F | Northern Trust Corp | 27.872 | -11,89 | 49 | -2,00 | ||||
| 2026-02-17 | 13F | Two Sigma Investments, Lp | 556.568 | 32,17 | 980 | 46,34 | ||||
| 2026-02-13 | 13F | Morgan Stanley | 58.780 | -18,95 | 103 | -10,43 | ||||
| 2026-02-23 | 13F | Virtu Financial LLC | 45.546 | -39,19 | 0 | |||||
| 2025-11-14 | 13F | Brevan Howard Capital Management LP | 0 | -100,00 | 0 | |||||
| 2025-11-14 | 13F | Oxford Asset Management Llp | 28.022 | 45 | ||||||
| 2026-02-13 | 13F | Parkside Financial Bank & Trust | 22.170 | 0,00 | 39 | 11,43 | ||||
| 2026-02-09 | 13F | Legal & General Group Plc | 563.575 | 29,47 | 995 | 44,27 | ||||
| 2026-02-13 | 13F | Squarepoint Ops LLC | 455.138 | -11,13 | 801 | -1,60 | ||||
| 2026-02-12 | 13F | Jane Street Group, Llc | 23.865 | -91,99 | 42 | -91,12 | ||||
| 2025-09-29 | NP | VPC - Virtus Private Credit Strategy ETF | 220.488 | 4,23 | 514 | -4,47 | ||||
| 2025-11-20 | 13F | First Affirmative Financial Network | 19.981 | 23,76 | 32 | -13,89 | ||||
| 2026-02-12 | 13F | Marex Group plc | 0 | -100,00 | 0 | |||||
| 2026-02-12 | 13F | BlackRock, Inc. | 500.589 | -7,88 | 881 | 1,97 | ||||
| 2026-02-03 | 13F | International Assets Investment Management, Llc | 37.470 | -9,65 | 66 | -29,35 | ||||
| 2026-02-11 | 13F | LPL Financial LLC | 53.582 | -24,48 | 94 | -16,07 | ||||
| 2026-02-13 | 13F | Dynamic Technology Lab Private Ltd | 0 | -100,00 | 0 | -100,00 | ||||
| 2026-01-23 | 13F | Farther Finance Advisors, LLC | 458 | 5,77 | 1 | |||||
| 2026-01-29 | 13F | UBS Group AG | 231.643 | 134,97 | 408 | 160,90 | ||||
| 2026-02-12 | 13F | Commonwealth Equity Services, Llc | 10.056 | 18 | ||||||
| 2026-02-13 | 13F | Wells Fargo & Company/mn | 1.153 | -3,43 | 2 | 100,00 | ||||
| 2025-11-14 | 13F | Raymond James Financial Inc | 0 | -100,00 | 0 | |||||
| 2026-02-11 | 13F | Simplex Trading, Llc | Call | 0 | -100,00 | 0 | ||||
| 2026-02-11 | 13F | Jpmorgan Chase & Co | 1.320 | 0,00 | 2 | 0,00 | ||||
| 2025-11-14 | 13F | Northwestern Mutual Wealth Management Co | 0 | -100,00 | 0 | |||||
| 2026-02-17 | 13F | Advisor Group Holdings, Inc. | 556 | -9,45 | 1 | -100,00 | ||||
| 2026-02-17 | 13F | Two Sigma Advisers, Lp | 319.913 | -56,45 | 563 | -51,80 | ||||
| 2026-02-17 | 13F | Royal Bank Of Canada | 11.802 | -4,82 | 21 | 5,00 | ||||
| 2025-10-30 | 13F | Traub Capital Management LLC | 0 | -100,00 | 0 | |||||
| 2026-02-11 | 13F | Simplex Trading, Llc | 832 | 1 | ||||||
| 2026-02-13 | 13F/A | Virtus ETF Advisers LLC | 0 | -100,00 | 0 | |||||
| 2026-02-11 | 13F | Simplex Trading, Llc | Put | 300 | 0,00 | 1 | ||||
| 2026-02-10 | 13F | Acorn Wealth Advisors, LLC | 12.057 | 21 | ||||||
| 2026-01-13 | 13F | CoreCap Advisors, LLC | 1.041 | 2.439,02 | 2 | |||||
| 2026-02-13 | 13F | Alerus Financial Na | 10.000 | 0,00 | 18 | 13,33 | ||||
| 2026-02-17 | 13F | Bank Of America Corp /de/ | 204.827 | 360 | ||||||
| 2026-02-10 | 13F | Goldman Sachs Group Inc | 0 | -100,00 | 0 | |||||
| 2025-11-12 | 13F | Group One Trading, L.p. | Call | 0 | -100,00 | 0 | -100,00 | |||
| 2026-01-13 | 13F | BostonPremier Wealth LLC | 35.226 | 0,00 | 62 | 8,93 | ||||
| 2026-02-05 | 13F | United Bank | 15.420 | -11,98 | 27 | 0,00 | ||||
| 2026-02-13 | 13F | SRS Capital Advisors, Inc. | 0 | -100,00 | 0 | |||||
| 2026-02-02 | 13F | Fifth Third Bancorp | 2.000 | 4 | ||||||
| 2026-01-14 | 13F | Eastern Bank | 2.400 | 0,00 | 4 | 33,33 | ||||
| 2026-02-11 | 13F | LeClair Wealth Partners LLC | 18.122 | 0,00 | 32 | 10,71 | ||||
| 2026-02-13 | 13F | Mariner, LLC | 0 | -100,00 | 0 | |||||
| 2025-10-23 | 13F | Moisand Fitzgerald Tamayo, LLC | 0 | -100,00 | 0 | -100,00 | ||||
| 2026-01-12 | 13F | Silverberg Bernstein Capital Management LLC | 74.845 | -6,97 | 132 | 3,15 | ||||
| 2026-02-17 | 13F | Jones Financial Companies Lllp | 1.611 | 8,19 | 3 | 0,00 | ||||
| 2026-02-12 | 13F | Founders Financial Alliance, LLC | 84.865 | 0,00 | 149 | 11,19 | ||||
| 2026-01-29 | 13F | Comerica Bank | 0 | -100,00 | 0 | |||||
| 2026-02-12 | 13F | Triumph Capital Management | 3.600 | -35,71 | 6 | -25,00 | ||||
| 2026-02-11 | 13F | Group One Trading, L.p. | 0 | -100,00 | 0 | |||||
| 2026-02-05 | 13F | Allworth Financial LP | 0 | -100,00 | 0 | |||||
| 2026-02-03 | 13F | Legacy Wealth Managment, LLC/ID | 17 | 6,25 | 0 | |||||
| 2026-02-06 | 13F | Reliant Investment Partners, LLC | 11.852 | 6,03 | 21 | 11,11 | ||||
| 2026-02-11 | 13F | Group One Trading, L.p. | Put | 0 | -100,00 | 0 | ||||
| 2025-11-06 | 13F | Stratos Wealth Partners, LTD. | 0 | -100,00 | 0 | |||||
| 2026-02-04 | 13F | Ameritas Advisory Services, LLC | 0 | -100,00 | 0 | |||||
| 2026-02-09 | 13F | Kingsview Wealth Management, LLC | 65.425 | 0,00 | 115 | 10,58 | ||||
| 2026-02-12 | 13F | StoneX Group Inc. | 16.359 | 29 | ||||||
| 2025-11-05 | 13F | Moloney Securities Asset Management, LLC | 163.418 | 4,93 | 260 | -25,36 | ||||
| 2026-02-17 | 13F | Two Sigma Securities, Llc | 0 | -100,00 | 0 | |||||
| 2026-01-21 | 13F | Crews Bank & Trust | 0 | -100,00 | 0 | |||||
| 2026-02-13 | 13F | Marshall Wace, Llp | 73.821 | 130 | ||||||
| 2026-01-30 | 13F | Sigma Planning Corp | 21.011 | 0,00 | 37 | 9,09 | ||||
| 2026-02-17 | 13F | Millennium Management Llc | 0 | -100,00 | 0 | |||||
| 2026-02-13 | 13F | Great West Life Assurance Co /can/ | 90.779 | -7,31 | 0 | |||||
| 2026-02-18 | 13F | Garton & Associates Financial Advisors LLC | 1.763 | 3 | ||||||
| 2026-02-05 | 13F | Cambridge Investment Research Advisors, Inc. | 19.322 | 0,00 | 0 | |||||
| 2026-01-12 | 13F | National Wealth Management Group, LLC | 10.202 | 2,02 | 18 | 13,33 | ||||
| 2026-02-17 | 13F | Virtus Investment Advisers, Inc. | 222.736 | -10,88 | 392 | -1,26 | ||||
| 2025-11-12 | 13F | Transce3nd, LLC | 0 | -100,00 | 0 | |||||
| 2026-02-13 | 13F | Arkadios Wealth Advisors | 20.593 | 2,96 | 36 | 16,13 | ||||
| 2025-11-14 | 13F | Alpine Global Management, LLC | 26.500 | 42 | ||||||
| 2026-01-28 | 13F | LifeSteps Financial, Inc. | 10.000 | 0,00 | 18 | 13,33 | ||||
| 2026-02-17 | 13F | Citadel Advisors Llc | Put | 0 | -100,00 | 0 | ||||
| 2026-02-06 | 13F | Kennedy Investment Group | 11.753 | 6,14 | 21 | 17,65 | ||||
| 2026-02-03 | 13F | McIlrath & Eck, LLC | 24.500 | 43 | ||||||
| 2026-02-12 | 13F | CIBC Private Wealth Group, LLC | 8.000 | 0,00 | 14 | 16,67 | ||||
| 2026-02-17 | 13F | Cetera Investment Advisers | 24.042 | 2,32 | 42 | 13,51 | ||||
| 2026-02-12 | 13F | CF Capital LLC | 0 | -100,00 | 0 | -100,00 | ||||
| 2026-01-20 | 13F | Ethos Financial Group, LLC | 41.967 | -10,88 | 74 | -1,35 | ||||
| 2026-02-17 | 13F | Mercer Global Advisors Inc /adv | 11.858 | 21 | ||||||
| 2026-02-17 | 13F | Citadel Advisors Llc | Call | 0 | -100,00 | 0 |