Grundlæggende statistik
| Institutionelle aktier (lange) | 29.761.714 - 47,39% (ex 13D/G) - change of -6,43MM shares -17,76% MRQ |
| Institutionel værdi (lang) | $ 604.937 USD ($1000) |
Institutionelt ejerskab og aktionærer
Ouster, Inc. (US:OUST) har 233 institutionelle ejere og aktionærer, der har indsendt 13D/G- eller 13F-formularer til Securities Exchange Commission (SEC). Disse institutioner har i alt 29,761,714 aktier. Største aktionærer omfatter BlackRock, Inc., Vanguard Group Inc, State Street Corp, Geode Capital Management, Llc, D. E. Shaw & Co., Inc., Tao Capital Management LP, Slate Path Capital LP, Susquehanna International Group, Llp, Penn Capital Management Co Inc, and Handelsbanken Fonder AB .
Ouster, Inc. (NasdaqGS:OUST) institutionel ejerskabsstruktur viser aktuelle positioner i virksomheden efter institutioner og fonde, samt seneste ændringer i positionsstørrelse. Større aktionærer kan omfatte individuelle investorer, investeringsforeninger, hedgefonde eller institutioner. Skema 13D angiver, at investoren besidder (eller besidder) mere end 5 % af virksomheden og har til hensigt (eller har til hensigt at) aktivt at forfølge en ændring i forretningsstrategi. Skema 13G indikerer en passiv investering på over 5%.
The share price as of April 27, 2026 is 26,92 / share. Previously, on April 28, 2025, the share price was 7,74 / share. This represents an increase of 247,80% over that period.

Fondens stemningsscore
Fund Sentiment Score (fka Ownership Accumulation Score) finder de aktier, der bliver mest købt af fonde. Det er resultatet af en sofistikeret, multi-faktor kvantitativ model, der identificerer virksomheder med de højeste niveauer af institutionel akkumulering. Scoringsmodellen bruger en kombination af den samlede stigning i oplyste ejere, ændringerne i porteføljeallokeringer i disse ejere og andre målinger. Tallet går fra 0 til 100, hvor højere tal indikerer et højere niveau af akkumulering for sine jævnaldrende, og 50 er gennemsnittet.
Opdateringsfrekvens: Dagligt
Se Ownership Explorer, som giver en liste over højest rangerende virksomheder.
AI+ Ask Fintel’s AI assistant about Ouster, Inc..
Select a question to share a public post with an AI-crafted answer.
Thinking of good questions…
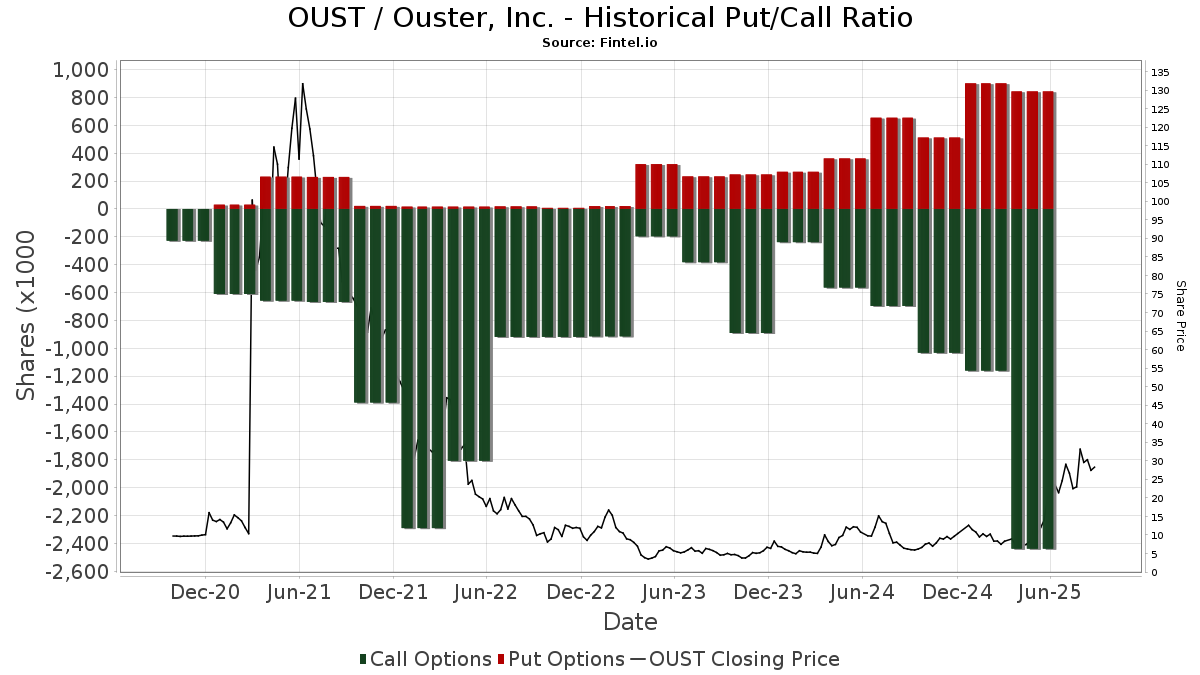
Institutionel Put/Call-forhold
Ud over at indberette standardaktie- og gældsudstedelser skal institutter med mere end 100 mill. aktiver under forvaltning også oplyse deres put- og call-optionsbeholdninger. Da salgsoptioner generelt indikerer negativ stemning, og købsoptioner indikerer positiv stemning, kan vi få en fornemmelse af den overordnede institutionelle stemning ved at plotte forholdet mellem put og kald. Diagrammet til højre viser det historiske put/call-forhold for dette instrument.
Brug af Put/Call Ratio som en indikator for investorernes stemning overvinder en af de vigtigste mangler ved at bruge totalt institutionelt ejerskab, som er, at en betydelig mængde af aktiver under forvaltning investeres passivt for at spore indekser. Passivt forvaltede fonde køber typisk ikke optioner, så indikatoren for put/call-forholdet følger mere nøje følelsen af aktivt forvaltede fonde.
13D/G-arkivering
Vi præsenterer 13D/G ansøgninger separat fra 13F ansøgninger på grund af den forskellige behandling af SEC. 13D/G-ansøgninger kan indgives af grupper af investorer (med én ledende), hvorimod 13F-ansøgninger ikke kan. Dette resulterer i situationer, hvor en investor kan indsende en 13D/G, der rapporterer én værdi for de samlede aktier (der repræsenterer alle de aktier, der ejes af investorgruppen), men derefter indsender en 13F, der rapporterer en anden værdi for de samlede aktier (der udelukkende repræsenterer deres egne) ejendomsret). Det betyder, at aktieejerskab af 13D/G-arkiver og 13F-arkiveringer ofte ikke er direkte sammenlignelige, så vi præsenterer dem separat.
Bemærk: Fra den 16. maj 2021 viser vi ikke længere ejere, der ikke har indsendt en 13D/G inden for det seneste år. Tidligere viste vi den fulde historie af 13D/G-arkiver. Generelt skal enheder, der er forpligtet til at indgive 13D/G-ansøgninger, indgive mindst årligt, før de indsender en afsluttende ansøgning. Dog forlader fonde nogle gange positioner uden at indsende en afsluttende ansøgning (dvs. de afvikler), så visning af den fulde historie resulterede nogle gange i forvirring om det nuværende ejerskab. For at undgå forvirring viser vi nu kun 'aktuelle' ejere - det vil sige - ejere, der har anmeldt inden for det seneste år.
Upgrade to unlock premium data.
| Fil dato | Form | Investor | Forrige Aktier |
Seneste Aktier |
Δ Aktier (Procent) |
Ejendomsret (Procent) |
Δ Ejerskab (Procent) |
|
|---|---|---|---|---|---|---|---|---|
| 2026-03-27 | VANGUARD GROUP INC | 3,478,944 | 0 | -100.00 | 0.00 | -100.00 | ||
| 2026-01-21 | BlackRock, Inc. | 3,072,558 | 4,430,910 | 44.21 | 7.40 | 15.62 |
13F og NPORT arkivering
Detaljer om 13F-arkivering er gratis. Detaljer om NP-ansøgninger kræver et premium-medlemskab. Grønne rækker angiver nye positioner. Røde rækker angiver lukkede positioner. Klik på linket ikon for at se den fulde transaktionshistorik.
Opgrader
for at låse premium-data op og eksportere til Excel ![]() .
.
| Fil dato | Kilde | Investor | Type | Gennemsnitlig pris (Øst) |
Aktier | Δ Aktier (%) |
Rapporteret Værdi ($1000) |
Δ Værdi (%) |
Port Alloc (%) |
|
|---|---|---|---|---|---|---|---|---|---|---|
| 2025-11-12 | 13F | American Century Companies Inc | 0 | -100,00 | 0 | -100,00 | ||||
| 2026-02-18 | 13F | GWM Advisors LLC | 43 | -99,53 | 1 | -100,00 | ||||
| 2026-04-15 | 13F | Activest Wealth Management | 82 | 0,00 | 2 | 0,00 | ||||
| 2026-02-09 | 13F | Hartland & Co., LLC | 0 | -100,00 | 0 | -100,00 | ||||
| 2026-02-13 | 13F | Marshall Wace, Llp | 0 | -100,00 | 0 | -100,00 | ||||
| 2026-04-23 | 13F | Intrua Financial, LLC | 20.924 | 4,88 | 384 | -10,90 | ||||
| 2026-01-30 | 13F | Sigma Planning Corp | 0 | -100,00 | 0 | -100,00 | ||||
| 2026-02-12 | 13F | EAM Investors, LLC | 19.217 | -86,78 | 416 | -89,32 | ||||
| 2026-01-29 | 13F | IMC-Chicago, LLC | 26.470 | 573 | ||||||
| 2025-11-14 | 13F | Cubist Systematic Strategies, LLC | Call | 138.100 | 752,47 | 3.736 | 852,81 | |||
| 2025-11-14 | 13F | Cubist Systematic Strategies, LLC | 44.104 | 1.193 | ||||||
| 2026-02-13 | 13F | Quattro Advisors LLC | 615 | 13 | ||||||
| 2025-11-04 | 13F | United Community Bank | 0 | -100,00 | 0 | |||||
| 2025-11-14 | 13F | Cubist Systematic Strategies, LLC | Put | 127.600 | 3.452 | |||||
| 2026-02-06 | 13F | Global Retirement Partners, LLC | 4.622 | 139,85 | 100 | 92,31 | ||||
| 2026-02-18 | 13F | VGI Partners Ltd | 0 | -100,00 | 0 | -100,00 | ||||
| 2026-02-17 | 13F | D. E. Shaw & Co., Inc. | Put | 0 | -100,00 | 0 | -100,00 | |||
| 2026-02-17 | 13F | Canada Pension Plan Investment Board | 206.000 | 6,96 | 4.458 | -14,44 | ||||
| 2026-02-13 | 13F | First Trust Advisors Lp | 248.691 | 5.382 | ||||||
| 2026-02-09 | 13F | Legal & General Group Plc | 50.955 | -5,16 | 1.103 | -24,16 | ||||
| 2026-02-13 | 13F | FORA Capital, LLC | 19.160 | 36,07 | 415 | 8,95 | ||||
| 2026-02-17 | 13F | MIRAE ASSET GLOBAL ETFS HOLDINGS Ltd. | 25.395 | 8,11 | 550 | -13,54 | ||||
| 2026-04-27 | 13F | Leonteq Securities AG | 8.136 | 45,62 | 149 | 24,17 | ||||
| 2026-02-17 | 13F | Royal Bank Of Canada | 4.381 | -90,40 | 95 | -92,31 | ||||
| 2025-11-10 | 13F | Axq Capital, Lp | 0 | -100,00 | 0 | -100,00 | ||||
| 2026-02-17 | 13F | Engineers Gate Manager LP | 90.951 | 35,49 | 1.968 | 8,43 | ||||
| 2026-04-24 | 13F | Black Swift Group, LLC | 101.000 | 1.855 | ||||||
| 2026-02-17 | 13F | Cresset Asset Management, LLC | 19.411 | 1,01 | 420 | -19,08 | ||||
| 2026-04-24 | 13F | Raiffeisen Bank International AG | 80.000 | 1.330 | ||||||
| 2026-02-13 | 13F | Morgan Stanley | 703.440 | -10,80 | 15.222 | -28,64 | ||||
| 2026-02-12 | 13F | Ensign Peak Advisors, Inc | 6.250 | -52,65 | 135 | -62,18 | ||||
| 2026-01-30 | 13F | Camden Capital, LLC | 18.992 | 0,00 | 411 | -20,08 | ||||
| 2026-03-27 | 13F | Prosperity Wealth Management, Inc. | 0 | -100,00 | 0 | |||||
| 2026-04-03 | 13F | Investors Research Corp | 100 | 0,00 | 2 | -50,00 | ||||
| 2026-04-22 | 13F | Spire Wealth Management | 20.324 | 0,00 | 373 | -15,03 | ||||
| 2026-02-13 | 13F | Brown Advisory Inc | 12.109 | 0,00 | 262 | -19,88 | ||||
| 2026-02-12 | 13F | New York State Common Retirement Fund | 479.751 | 18,03 | 10.382 | -5,58 | ||||
| 2026-04-15 | 13F | Exchange Traded Concepts, Llc | 52.105 | 121,70 | 957 | 88,39 | ||||
| 2026-02-13 | 13F | MAI Capital Management | 4.500 | 0,00 | 97 | -19,83 | ||||
| 2026-02-19 | 13F | Invesco Ltd. | 74.739 | 17,78 | 1.617 | -5,77 | ||||
| 2026-01-27 | 13F | Asset Management One Co., Ltd. | 5.824 | -1,79 | 125 | -22,50 | ||||
| 2026-02-03 | 13F | International Assets Investment Management, Llc | 215 | 5 | ||||||
| 2026-02-11 | 13F | Gwn Securities Inc. | 14.170 | 307 | ||||||
| 2026-02-13 | 13F | Ubs Asset Management Americas Inc | 93.371 | 2,48 | 2.021 | -18,02 | ||||
| 2026-02-09 | 13F | Quest Partners LLC | 13.650 | 27,94 | 295 | 2,43 | ||||
| 2026-02-17 | 13F | Advisory Services Network, LLC | 0 | -100,00 | 0 | -100,00 | ||||
| 2026-02-13 | 13F | State Street Corp | 1.580.739 | -11,73 | 34.207 | -29,38 | ||||
| 2025-11-14 | 13F | Massar Capital Management, LP | 0 | -100,00 | 0 | -100,00 | ||||
| 2026-02-03 | 13F | Mitsubishi UFJ Kokusai Asset Management Co., Ltd. | 80.642 | -60,95 | 1.885 | -66,27 | ||||
| 2026-02-17 | 13F | Susquehanna Fundamental Investments, Llc | 0 | -100,00 | 0 | -100,00 | ||||
| 2026-02-17 | 13F | Optiver Holding B.V. | 31 | 1 | ||||||
| 2025-10-29 | 13F | Game Plan Financial Advisors, LLC | 0 | -100,00 | 0 | |||||
| 2026-02-14 | 13F | Rockefeller Capital Management L.P. | 219 | 563,64 | 5 | |||||
| 2026-02-10 | 13F | Intech Investment Management Llc | 24.964 | 16,74 | 540 | -6,57 | ||||
| 2026-02-17 | 13F | Sona Asset Management (us) Llc | Call | 10.000 | 0,00 | 216 | -20,00 | |||
| 2026-01-27 | 13F | TD Waterhouse Canada Inc. | 0 | -100,00 | 0 | -100,00 | ||||
| 2026-02-11 | 13F | Ameritas Investment Partners, Inc. | 4.246 | 92 | ||||||
| 2026-02-13 | 13F | Barclays Plc | 93.582 | 9,42 | 2.025 | -12,45 | ||||
| 2026-02-17 | 13F | Price T Rowe Associates Inc /md/ | 39.143 | 44,36 | 1 | |||||
| 2026-02-13 | 13F | Victory Capital Management Inc | 97.346 | 2.107 | ||||||
| 2026-02-18 | 13F | Mackenzie Financial Corp | 0 | -100,00 | 0 | -100,00 | ||||
| 2026-04-08 | 13F | Woodstock Corp | 16.970 | 312 | ||||||
| 2026-02-13 | 13F | Panagora Asset Management Inc | 124.009 | -11,50 | 2.684 | -29,21 | ||||
| 2026-01-30 | 13F | Us Bancorp \de\ | 8.522 | 0,00 | 184 | -20,00 | ||||
| 2026-02-12 | 13F | Marex Group plc | 0 | -100,00 | 0 | |||||
| 2026-02-13 | 13F | Gen-Wealth Partners Inc | 80 | 2 | ||||||
| 2025-11-12 | 13F | DnB Asset Management AS | 0 | -100,00 | 0 | -100,00 | ||||
| 2026-02-13 | 13F | Arrowstreet Capital, Limited Partnership | 0 | -100,00 | 0 | |||||
| 2026-02-10 | 13F | Quantbot Technologies LP | 13.618 | 295 | ||||||
| 2026-01-07 | 13F | Harbour Capital Advisors, LLC | 0 | -100,00 | 0 | |||||
| 2026-02-11 | 13F | Hughes Financial Services, LLC | 42 | -16,00 | 1 | -100,00 | ||||
| 2026-02-13 | 13F | Cornerstone Financial Management LLC | 67 | 1 | ||||||
| 2026-02-18 | 13F/A | Empowered Funds, LLC | 11.422 | 247 | ||||||
| 2026-04-24 | 13F | Root Financial Partners, LLC | 18 | 0 | ||||||
| 2026-02-17 | 13F | Jones Financial Companies Lllp | 6.343 | -37,95 | 137 | -51,76 | ||||
| 2026-02-17 | 13F | Fmr Llc | 200.236 | 25,86 | 4.333 | 0,70 | ||||
| 2026-01-26 | 13F | Cwm, Llc | 14.697 | 1,27 | 0 | |||||
| 2026-02-03 | 13F | SBI Securities Co., Ltd. | 5.935 | 19,90 | 128 | -3,76 | ||||
| 2026-02-17 | 13F | XTX Topco Ltd | 13.646 | -65,78 | 295 | -72,63 | ||||
| 2026-01-09 | 13F | 180 Wealth Advisors, Llc | 49.122 | 13,80 | 1.063 | -8,91 | ||||
| 2026-02-10 | 13F | State of Wyoming | 10.463 | 225,44 | 226 | 162,79 | ||||
| 2026-01-23 | 13F | Freestone Capital Holdings, LLC | 22.469 | -1,86 | 486 | -21,49 | ||||
| 2026-02-13 | 13F | Walleye Trading LLC | Put | 15.800 | -59,90 | 342 | -67,98 | |||
| 2026-02-13 | 13F | Walleye Trading LLC | Call | 90.500 | 206,78 | 1.958 | 145,67 | |||
| 2026-02-13 | 13F | Squarepoint Ops LLC | 401.727 | 517,53 | 8.693 | 394,20 | ||||
| 2026-02-13 | 13F | BNP Paribas Asset Management Holding S.A. | 756 | 51,20 | 0 | |||||
| 2026-01-29 | 13F | UBS Group AG | 301.469 | 67,71 | 6.524 | 34,16 | ||||
| 2026-02-12 | 13F | State Board Of Administration Of Florida Retirement System | 11.900 | 0,00 | 258 | -19,94 | ||||
| 2026-02-03 | 13F | Costello Asset Management, INC | 200 | 4 | ||||||
| 2026-02-13 | 13F | Quarry LP | 348 | -46,38 | 8 | -58,82 | ||||
| 2025-11-13 | 13F | EntryPoint Capital, LLC | 0 | -100,00 | 0 | -100,00 | ||||
| 2026-02-11 | 13F | Franklin Resources Inc | 102.875 | 135,14 | 2.226 | 88,17 | ||||
| 2026-02-13 | 13F | SRS Capital Advisors, Inc. | 558 | -91,40 | 12 | -93,14 | ||||
| 2026-02-10 | 13F | Thompson Siegel & Walmsley Llc | 33.000 | 120,00 | 1 | |||||
| 2026-02-17 | 13F | Sender Co & Partners, Inc. | 0 | -100,00 | 0 | |||||
| 2026-02-10 | 13F/A | Northwestern Mutual Wealth Management Co | 5 | 0 | ||||||
| 2026-01-15 | 13F | Bernard Wealth Management Corp. | 150 | 0,00 | 3 | -25,00 | ||||
| 2026-02-06 | 13F | Handelsbanken Fonder AB | 715.646 | 130,70 | 15 | 87,50 | ||||
| 2026-02-13 | 13F | Centaurus Financial, Inc. | 0 | -100,00 | 0 | |||||
| 2026-02-17 | 13F | Freestone Grove Partners LP | 15.422 | 334 | ||||||
| 2026-02-17 | 13F | Mangrove Partners | 10.122 | 219 | ||||||
| 2026-04-13 | 13F | Salem Investment Counselors Inc | 30 | 1 | ||||||
| 2026-01-14 | 13F | Hennion & Walsh Asset Management, Inc. | 54.074 | 39,13 | 1.170 | 11,32 | ||||
| 2026-02-10 | 13F | Acadian Asset Management Llc | 93.329 | -57,84 | 2 | -60,00 | ||||
| 2026-02-06 | 13F | Larson Financial Group LLC | 1.965 | 118,82 | 43 | 75,00 | ||||
| 2026-02-13 | 13F | Van Eck Associates Corp | 3.195 | -11,00 | 0 | |||||
| 2026-01-15 | 13F | Nisa Investment Advisors, Llc | 593 | -51,03 | 13 | -62,50 | ||||
| 2026-04-10 | 13F | Armstrong Advisory Group, Inc | 76 | -89,00 | 1 | -92,86 | ||||
| 2026-02-17 | 13F | Caption Management, LLC | Call | 0 | -100,00 | 0 | ||||
| 2026-02-17 | 13F | Voleon Capital Management Lp | 0 | -100,00 | 0 | |||||
| 2026-04-16 | 13F | SG Americas Securities, LLC | 127.585 | -53,87 | 2 | -60,00 | ||||
| 2026-02-11 | 13F | Jpmorgan Chase & Co | 150.210 | -18,89 | 3.251 | -35,12 | ||||
| 2026-02-17 | 13F | Dark Forest Capital Management Lp | 30.472 | 33,30 | 659 | 6,63 | ||||
| 2026-04-17 | 13F | CENTRAL TRUST Co | 710 | 13 | ||||||
| 2026-02-12 | 13F | Voya Investment Management Llc | 9.559 | 3,33 | 207 | -17,60 | ||||
| 2026-02-13 | 13F | Stifel Financial Corp | 18.412 | -14,91 | 398 | -31,97 | ||||
| 2026-02-17 | 13F | Northern Trust Corp | 462.622 | 0,31 | 10.011 | -19,75 | ||||
| 2026-02-13 | 13F | Charles Schwab Investment Management Inc | 487.438 | 4,51 | 10.548 | -16,39 | ||||
| 2026-01-26 | 13F | KBC Group NV | 1.840 | 0,00 | 0 | |||||
| 2026-02-23 | 13F | Beaird Harris Wealth Management, LLC | 218 | 5 | ||||||
| 2025-11-06 | 13F | CIBC World Markets Inc. | 0 | -100,00 | 0 | -100,00 | ||||
| 2025-11-14 | 13F | T. Rowe Price Investment Management, Inc. | 0 | -100,00 | 0 | -100,00 | ||||
| 2026-02-13 | 13F | Essex Investment Management Co Llc | 181.326 | -2,34 | 3.924 | -21,88 | ||||
| 2026-02-17 | 13F | Driehaus Capital Management Llc | 0 | -100,00 | 0 | -100,00 | ||||
| 2026-01-23 | 13F | Assetmark, Inc | 68 | 25,93 | 1 | 0,00 | ||||
| 2026-02-12 | 13F | Hrt Financial Lp | 33.333 | -49,17 | 1 | -100,00 | ||||
| 2025-11-14 | 13F | OMERS ADMINISTRATION Corp | 0 | -100,00 | 0 | -100,00 | ||||
| 2026-02-11 | 13F | Parallel Advisors, LLC | 21 | 31,25 | 0 | |||||
| 2026-02-05 | 13F | Stoneridge Investment Partners Llc | 18.677 | 0 | ||||||
| 2026-02-17 | 13F | Brevan Howard Capital Management LP | 26.094 | -51,65 | 565 | -61,34 | ||||
| 2026-02-13 | 13F | Rhumbline Advisers | 78.882 | -11,65 | 1.707 | -29,36 | ||||
| 2026-01-20 | 13F | Steel Peak Wealth Management LLC | 0 | -100,00 | 0 | |||||
| 2026-02-02 | 13F | Benjamin Edwards Inc | Call | 0 | -100,00 | 0 | -100,00 | |||
| 2026-04-10 | 13F | Quaker Wealth Management, LLC | 0 | -100,00 | 0 | |||||
| 2026-02-12 | 13F | EHP Funds Inc. | 0 | -100,00 | 0 | |||||
| 2026-02-13 | 13F | National Bank Of Canada /fi/ | 163 | 3,16 | 4 | -25,00 | ||||
| 2026-02-13 | 13F | Herald Investment Management Ltd | 200.000 | 5,26 | 4.326 | -15,72 | ||||
| 2026-02-13 | 13F | Wells Fargo & Company/mn | 68.743 | 34,02 | 1.488 | 7,21 | ||||
| 2026-02-17 | 13F | Gotham Asset Management, LLC | 0 | -100,00 | 0 | -100,00 | ||||
| 2025-11-14 | 13F | Hamilton Wealth, LLC | 0 | -100,00 | 0 | -100,00 | ||||
| 2026-02-10 | 13F | Main Management ETF Advisors, LLC | 54.810 | 1,03 | 1 | 0,00 | ||||
| 2026-02-13 | 13F | Walleye Capital LLC | Put | 45.600 | -10,76 | 987 | -28,65 | |||
| 2026-02-13 | 13F | Walleye Capital LLC | 1 | -99,99 | 0 | -100,00 | ||||
| 2026-02-13 | 13F | Walleye Capital LLC | Call | 72.700 | 450,76 | 1.573 | 340,62 | |||
| 2026-02-17 | 13F | Algert Global Llc | 331.363 | -33,85 | 7 | -46,15 | ||||
| 2026-02-17 | 13F | California State Teachers Retirement System | 52.827 | 10,45 | 1.143 | -11,60 | ||||
| 2026-02-13 | 13F | Kilter Group LLC | 28 | 1 | ||||||
| 2026-02-17 | 13F | Slate Path Capital LP | 829.000 | 0,00 | 17.940 | -20,00 | ||||
| 2025-11-12 | 13F | Clare Market Investments LLC | 16.325 | 442 | ||||||
| 2026-04-06 | 13F | GAMMA Investing LLC | 1.132 | 2,82 | 21 | -13,04 | ||||
| 2026-02-17 | 13F | Jump Financial, LLC | 33.616 | -85,23 | 727 | -88,19 | ||||
| 2026-01-29 | 13F | Pictet Asset Management Holding SA | 0 | -100,00 | 0 | -100,00 | ||||
| 2026-01-28 | 13F | Arizona State Retirement System | 15.170 | 0,52 | 328 | -19,61 | ||||
| 2026-02-13 | 13F | Mariner, LLC | 103.917 | 58,23 | 2.249 | 26,58 | ||||
| 2026-02-10 | 13F | Savant Capital, LLC | 0 | -100,00 | 0 | |||||
| 2026-02-27 | 13F | Compass Financial Services Inc | 51 | 0,00 | 1 | 0,00 | ||||
| 2026-02-17 | 13F | Janus Henderson Group Plc | 22.070 | 0,00 | 477 | -19,97 | ||||
| 2026-04-20 | 13F | Banque Cantonale Vaudoise | 7.295 | 67,51 | 134 | 42,55 | ||||
| 2025-11-14 | 13F/A | Skopos Labs, Inc. | 0 | -100,00 | 0 | -100,00 | ||||
| 2026-02-17 | 13F | Qube Research & Technologies Ltd | 72.387 | -31,80 | 1.566 | -45,45 | ||||
| 2026-03-04 | 13F | SHP Wealth Management | 4.437 | 96 | ||||||
| 2026-02-13 | 13F | Silicon Valley Capital Partners | 286 | 15,32 | 6 | 0,00 | ||||
| 2026-02-12 | 13F | Jane Street Group, Llc | 386.354 | -1,84 | 8.361 | -21,47 | ||||
| 2026-02-12 | 13F | Jane Street Group, Llc | Call | 141.200 | 1,88 | 3.056 | -18,51 | |||
| 2026-02-17 | 13F | Portolan Capital Management, LLC | 145.148 | 3.141 | ||||||
| 2026-02-12 | 13F | Jane Street Group, Llc | Put | 196.600 | -32,46 | 4.254 | -45,97 | |||
| 2026-02-13 | 13F | Manufacturers Life Insurance Company, The | 0 | -100,00 | 0 | |||||
| 2026-02-12 | 13F | Federated Hermes, Inc. | 293 | 6 | ||||||
| 2026-02-13 | 13F | Crescent Park Management, L.P. | Call | 17.200 | 372 | |||||
| 2026-01-28 | 13F | Klp Kapitalforvaltning As | 11.700 | 9,35 | 253 | -12,46 | ||||
| 2026-03-12 | 13F/A | Peak6 Llc | Call | 411.200 | 8,07 | 8.898 | -13,54 | |||
| 2026-02-03 | 13F | Morse Asset Management, Inc | 0 | -100,00 | 0 | |||||
| 2026-04-22 | 13F | Sterling Capital Management LLC | 368 | 4,25 | 7 | -14,29 | ||||
| 2026-02-11 | 13F | Fox Run Management, L.l.c. | 0 | -100,00 | 0 | -100,00 | ||||
| 2026-02-17 | 13F | Graham Capital Management, L.P. | 0 | -100,00 | 0 | -100,00 | ||||
| 2026-02-13 | 13F | Lord, Abbett & Co. Llc | 282.808 | 25,06 | 6 | 0,00 | ||||
| 2026-02-17 | 13F | Millennium Management Llc | 401.185 | -20,59 | 8.682 | -36,48 | ||||
| 2026-02-10 | 13F | Thompson Siegel & Walmsley Llc | Call | 0 | -100,00 | 0 | ||||
| 2026-02-11 | 13F | Los Angeles Capital Management Llc | 16.297 | -24,29 | 527 | -9,62 | ||||
| 2026-02-12 | 13F | Counterpoint Mutual Funds LLC | 0 | -100,00 | 0 | |||||
| 2026-01-29 | 13F | Vanguard Group Inc | 4.719.021 | -0,03 | 102.120 | -20,02 | ||||
| 2026-02-12 | 13F | SWAN Capital LLC | 25 | 1 | ||||||
| 2026-02-11 | 13F | Group One Trading, L.p. | 45.394 | -61,42 | 982 | -69,14 | ||||
| 2026-02-17 | 13F | Aqr Capital Management Llc | 250.732 | 6,05 | 5.426 | -15,17 | ||||
| 2026-02-23 | 13F | Virtu Financial LLC | 0 | -100,00 | 0 | -100,00 | ||||
| 2026-04-13 | 13F | True Wealth Design, LLC | 511 | 0,00 | 9 | -18,18 | ||||
| 2026-04-24 | 13F | ProShare Advisors LLC | 11.458 | -13,20 | 210 | -26,32 | ||||
| 2026-04-21 | 13F | Financial Consulate, Inc | 1.100 | 0,00 | 20 | -13,04 | ||||
| 2026-02-06 | 13F | Bastion Asset Management Inc. | 0 | -100,00 | 0 | -100,00 | ||||
| 2026-02-17 | 13F | Silvercrest Asset Management Group Llc | 168.000 | 3.636 | ||||||
| 2026-02-05 | 13F | HighMark Wealth Management LLC | 41 | 0,00 | 1 | -100,00 | ||||
| 2025-11-13 | 13F | Bulltick Wealth Management, LLC | 0 | -100,00 | 0 | -100,00 | ||||
| 2026-02-17 | 13F | Quadrature Capital Ltd | 14.916 | 323 | ||||||
| 2026-02-17 | 13F | Citadel Advisors Llc | Call | 630.700 | 1,69 | 13.648 | -18,65 | |||
| 2026-02-17 | 13F | Point72 Asset Management, L.P. | Put | 94.600 | 2.047 | |||||
| 2026-02-17 | 13F | Citadel Advisors Llc | 317.158 | 2,94 | 6.863 | -17,64 | ||||
| 2026-02-17 | 13F | State Of Wisconsin Investment Board | 31.331 | -23,70 | 678 | -38,92 | ||||
| 2026-02-06 | 13F | EverSource Wealth Advisors, LLC | 621 | -5,91 | 13 | -23,53 | ||||
| 2026-02-17 | 13F | Aquatic Capital Management LLC | 9.941 | 215 | ||||||
| 2026-02-17 | 13F | Citadel Advisors Llc | Put | 434.100 | -11,84 | 9.394 | -29,48 | |||
| 2026-02-17 | 13F | D. E. Shaw & Co., Inc. | Call | 155.700 | -59,95 | 3.369 | -67,97 | |||
| 2026-02-17 | 13F | Point72 Asset Management, L.P. | Call | 106.300 | 2.300 | |||||
| 2026-02-11 | 13F | Simplex Trading, Llc | 14.133 | -82,43 | 306 | 15.150,00 | ||||
| 2026-02-17 | 13F | D. E. Shaw & Co., Inc. | 852.406 | 205,84 | 18.446 | 144,67 | ||||
| 2025-11-14 | 13F | Ionic Capital Management LLC | Put | 0 | -100,00 | 0 | -100,00 | |||
| 2026-02-06 | 13F | Pnc Financial Services Group, Inc. | 685 | -0,72 | 15 | -22,22 | ||||
| 2026-02-12 | 13F | CIBC Private Wealth Group, LLC | 178 | 423,53 | 4 | |||||
| 2026-02-17 | 13F | Susquehanna Portfolio Strategies, LLC | 0 | -100,00 | 0 | -100,00 | ||||
| 2026-02-05 | 13F | Amalgamated Bank | 1.717 | 4,25 | 0 | |||||
| 2026-02-09 | 13F | Huntington National Bank | 0 | -100,00 | 0 | -100,00 | ||||
| 2025-11-14 | 13F | Symmetry Peak Management Llc | Call | 0 | -100,00 | 0 | -100,00 | |||
| 2026-02-10 | 13F | Rothschild Investment Llc | 147 | -8,12 | 3 | -25,00 | ||||
| 2026-02-13 | 13F | Entropy Technologies, LP | 0 | -100,00 | 0 | |||||
| 2026-02-03 | 13F | Orion Capital Management LLC | 511 | 0,00 | 11 | -15,38 | ||||
| 2026-04-23 | 13F | SJS Investment Consulting Inc. | 0 | -100,00 | 0 | |||||
| 2026-02-12 | 13F | MetLife Investment Management, LLC | 30.622 | 0,00 | 663 | -20,05 | ||||
| 2026-02-11 | 13F | Deutsche Bank Ag\ | 165.190 | 53,93 | 3.575 | 23,16 | ||||
| 2026-02-05 | 13F | Allworth Financial LP | 537 | 14,26 | 12 | -8,33 | ||||
| 2026-02-20 | 13F/A | Prestige Wealth Management Group LLC | 0 | -100,00 | 0 | -100,00 | ||||
| 2026-02-12 | 13F | Renaissance Technologies Llc | 0 | -100,00 | 0 | -100,00 | ||||
| 2026-04-24 | 13F | Patten Group, Inc. | 11.528 | 212 | ||||||
| 2026-02-09 | 13F | Atlantic Trust, LLC | 468 | 10 | ||||||
| 2026-02-10 | 13F | Goldman Sachs Group Inc | 372.992 | 38,23 | 8.072 | 10,58 | ||||
| 2026-02-13 | 13F | Sei Investments Co | 103.221 | 187,15 | 2.234 | 129,73 | ||||
| 2026-02-12 | 13F | Commonwealth Equity Services, Llc | 41.517 | -23,34 | 898 | 89.700,00 | ||||
| 2026-02-17 | 13F | Man Group plc | 106.703 | 18,74 | 2.309 | -4,98 | ||||
| 2026-04-07 | 13F | CoreCap Advisors, LLC | 37 | 0,00 | 1 | |||||
| 2025-11-14 | 13F | Lazard Asset Management Llc | 0 | -100,00 | 0 | |||||
| 2026-02-13 | 13F | Verition Fund Management LLC | 91.942 | -9,87 | 1.990 | -27,91 | ||||
| 2026-02-17 | 13F | Tudor Investment Corp Et Al | 156.517 | -53,47 | 3.387 | -62,77 | ||||
| 2026-02-11 | 13F | Winton Capital Group Ltd | 46.200 | 1.000 | ||||||
| 2026-02-17 | 13F | Advisor Group Holdings, Inc. | 107.655 | -10,53 | 2.330 | -32,06 | ||||
| 2026-02-12 | 13F | BlackRock, Inc. | 5.135.494 | 5,55 | 111.132 | -15,56 | ||||
| 2026-02-12 | 13F | Federation des caisses Desjardins du Quebec | 508 | -16,99 | 11 | -37,50 | ||||
| 2026-02-17 | 13F | Gilder Gagnon Howe & Co Llc | 0 | -100,00 | 0 | -100,00 | ||||
| 2026-02-13 | 13F | Citigroup Inc | 5.586 | -76,97 | 121 | -81,68 | ||||
| 2025-11-13 | 13F | MYDA Advisors LLC | 0 | -100,00 | 0 | -100,00 | ||||
| 2026-02-05 | 13F | Blume Capital Management, Inc. | 400 | 9 | ||||||
| 2026-02-09 | 13F | Harbour Investments, Inc. | 206 | -4,19 | 4 | -20,00 | ||||
| 2026-02-02 | 13F | Benjamin Edwards Inc | 20.634 | 12,48 | 447 | -10,08 | ||||
| 2026-02-10 | 13F | Daiwa Securities Group Inc. | 2.605 | -5,99 | 0 | |||||
| 2025-11-14 | 13F | Clough Capital Partners L P | 0 | -100,00 | 0 | |||||
| 2026-02-13 | 13F | Toroso Investments, LLC | 10.715 | 232 | ||||||
| 2026-02-17 | 13F | Creative Planning | 46.852 | 7,26 | 1.014 | -14,23 | ||||
| 2026-02-12 | 13F | Steward Partners Investment Advisory, Llc | 3 | -97,09 | 0 | -100,00 | ||||
| 2026-02-13 | 13F | Toroso Investments, LLC | Call | 92.600 | 2.004 | |||||
| 2026-04-07 | 13F | Signaturefd, Llc | 944 | 3,06 | 17 | -10,53 | ||||
| 2025-11-03 | 13F | Pandora Wealth, Inc. | 0 | -100,00 | 0 | |||||
| 2026-02-19 | 13F | Mcguire Capital Advisors Inc | 400 | 9 | ||||||
| 2026-04-24 | 13F | Strs Ohio | 0 | -100,00 | 0 | |||||
| 2026-02-06 | 13F | Legato Capital Management LLC | 58.638 | 9,66 | 1.269 | -12,31 | ||||
| 2025-11-14 | 13F | Wolverine Trading, Llc | Call | 227.400 | 15,78 | 6.281 | 32,69 | |||
| 2026-02-13 | 13F | Parkside Financial Bank & Trust | 55 | 0,00 | 1 | 0,00 | ||||
| 2026-02-17 | 13F | Balyasny Asset Management Llc | 0 | -100,00 | 0 | -100,00 | ||||
| 2025-11-14 | 13F | Wolverine Trading, Llc | Put | 91.300 | 32,51 | 2.522 | 51,87 | |||
| 2026-02-10 | 13F | Bnp Paribas Arbitrage, Sa | 12.266 | -82,43 | 265 | -85,96 | ||||
| 2026-02-17 | 13F | Tower Research Capital LLC (TRC) | 711 | -95,90 | 15 | -96,80 | ||||
| 2026-04-17 | 13F | AdvisorNet Financial, Inc | 19 | 0,00 | 0 | |||||
| 2026-02-11 | 13F | Cedar Mountain Advisors, LLC | 50 | 0,00 | 1 | 0,00 | ||||
| 2025-11-14 | 13F | Voloridge Investment Management, Llc | 0 | -100,00 | 0 | -100,00 | ||||
| 2026-02-13 | 13F | Bridgewater Associates, LP | 66.786 | 175,22 | 1.445 | 120,27 | ||||
| 2026-02-12 | 13F | Penserra Capital Management LLC | 0 | -100,00 | 0 | |||||
| 2026-02-06 | 13F | Gsa Capital Partners Llp | 23.528 | 1 | ||||||
| 2025-11-14 | 13F | Metavasi Capital LP | 0 | -100,00 | 0 | -100,00 | ||||
| 2025-11-10 | 13F | Nkcfo Llc | 0 | -100,00 | 0 | |||||
| 2026-04-07 | 13F | Farther Finance Advisors, LLC | 1.047 | 21,18 | 19 | 5,56 | ||||
| 2026-04-15 | 13F | Fortitude Family Office, LLC | 67 | 63,41 | 1 | |||||
| 2026-02-13 | 13F | Prudential Financial Inc | 0 | -100,00 | 0 | |||||
| 2026-02-20 | 13F | Sunbelt Securities, Inc. | 43 | 0,00 | 1 | -100,00 | ||||
| 2026-02-12 | 13F | Swiss National Bank | 108.300 | 9,28 | 2.344 | -12,57 | ||||
| 2026-02-17 | 13F | Susquehanna International Group, Llp | Put | 372.700 | -24,49 | 8.065 | -39,59 | |||
| 2026-03-12 | 13F/A | Peak6 Llc | Put | 0 | -100,00 | 0 | -100,00 | |||
| 2026-02-17 | 13F | Susquehanna International Group, Llp | Call | 808.700 | 20,81 | 17.500 | -3,35 | |||
| 2026-02-12 | 13F | Quadrant Capital Group Llc | 106 | 0,00 | 2 | 0,00 | ||||
| 2026-04-16 | 13F | Diversified Trust Co | 12.701 | 22,88 | 233 | 4,48 | ||||
| 2026-02-13 | 13F | Ieq Capital, Llc | 0 | -100,00 | 0 | -100,00 | ||||
| 2026-01-29 | 13F | Comerica Bank | 960 | 392,31 | 21 | 300,00 | ||||
| 2026-02-19 | 13F | CI Private Wealth, LLC | 11.354 | 246 | ||||||
| 2026-02-11 | 13F | LPL Financial LLC | 68.017 | -16,39 | 1.472 | -33,14 | ||||
| 2026-02-17 | 13F | Trexquant Investment LP | 138.101 | -65,75 | 2.989 | -72,60 | ||||
| 2025-11-14 | 13F | Point72 Hong Kong Ltd | 1.201 | 32 | ||||||
| 2026-02-13 | 13F | Police & Firemen's Retirement System of New Jersey | 14.794 | 4,93 | 320 | -16,01 | ||||
| 2026-02-11 | 13F | Gordian Capital Singapore Pte Ltd | 0 | -100,00 | 0 | -100,00 | ||||
| 2026-04-13 | 13F | Creative Financial Designs Inc /adv | 100 | 0,00 | 2 | -50,00 | ||||
| 2026-02-12 | 13F | Integrated Quantitative Investments LLC | 16.023 | 347 | ||||||
| 2026-02-17 | 13F | Russell Investments Group, Ltd. | 246.215 | 104,53 | 5.328 | 63,64 | ||||
| 2026-02-17 | 13F | Warren Averett Asset Management, LLC | 44.299 | 959 | ||||||
| 2026-04-06 | 13F | Versant Capital Management, Inc | 847 | 33,81 | 16 | 15,38 | ||||
| 2026-04-27 | 13F | Tsfg, Llc | 41 | 0,00 | 0 | |||||
| 2026-02-17 | 13F | Two Sigma Investments, Lp | 32.119 | -44,43 | 695 | -55,53 | ||||
| 2026-02-17 | 13F | Bank Of America Corp /de/ | 101.294 | -54,02 | 2.192 | -63,22 | ||||
| 2026-02-13 | 13F | Smartleaf Asset Management LLC | 195 | 509,38 | 4 | |||||
| 2026-02-17 | 13F | Susquehanna International Group, Llp | 0 | -100,00 | 0 | -100,00 | ||||
| 2025-11-14 | 13F | ExodusPoint Capital Management, LP | 0 | -100,00 | 0 | |||||
| 2026-01-23 | 13F | Avion Wealth | 222 | -17,78 | 0 | |||||
| 2026-02-12 | 13F | Dimensional Fund Advisors Lp | 451.431 | -0,27 | 9.769 | -20,22 | ||||
| 2026-02-12 | 13F | Nuveen, LLC | 288.893 | -48,89 | 6.252 | -59,12 | ||||
| 2026-04-21 | 13F | Huntleigh Advisors, Inc. | 17.992 | 0,46 | 331 | -14,73 | ||||
| 2026-02-11 | 13F | MCF Advisors LLC | 1.000 | 0,00 | 22 | -22,22 | ||||
| 2026-02-17 | 13F | Alliancebernstein L.p. | 50.800 | 0,00 | 1.099 | -20,01 | ||||
| 2026-02-17 | 13F | KP Management LLC | 0 | -100,00 | 0 | -100,00 | ||||
| 2026-01-16 | 13F | FNY Investment Advisers, LLC | 0 | -100,00 | 0 | |||||
| 2025-11-13 | 13F | Benchmark Investment Advisors LLC | 20.463 | 608 | ||||||
| 2026-01-14 | 13F | ORG Partners LLC | 30 | -85,37 | 1 | -100,00 | ||||
| 2026-04-13 | 13F | IFP Advisors, Inc | 187 | -1,06 | 3 | -25,00 | ||||
| 2026-02-14 | 13F | Tao Capital Management LP | 845.316 | -24,88 | 18.293 | -39,91 | ||||
| 2026-02-09 | 13F | Geode Capital Management, Llc | 1.421.130 | 9,07 | 30.758 | -12,75 | ||||
| 2026-02-09 | 13F | Penn Capital Management Co Inc | 775.297 | 24,06 | 16.817 | -0,66 | ||||
| 2026-02-13 | 13F | Kestra Advisory Services, LLC | 992 | 21 | ||||||
| 2026-04-08 | 13F | Wealth Enhancement Advisory Services, Llc | 10.708 | 8,13 | 209 | -18,11 | ||||
| 2026-02-17 | 13F | Raymond James Financial Inc | 102.273 | -1,49 | 2.213 | -21,19 | ||||
| 2026-02-11 | 13F | Rise Advisors, LLC | 0 | -100,00 | 0 | -100,00 | ||||
| 2026-01-27 | 13F | Zurcher Kantonalbank (Zurich Cantonalbank) | 9.697 | 0,00 | 210 | -20,23 | ||||
| 2026-02-17 | 13F | Ameriprise Financial Inc | 211.876 | 75,93 | 4.585 | 40,74 | ||||
| 2026-02-13 | 13F | Wexford Capital Lp | 0 | -100,00 | 0 | |||||
| 2026-02-17 | 13F | Amundi | 15.643 | 339 | ||||||
| 2026-02-04 | 13F | Versor Investments LP | 0 | -100,00 | 0 | |||||
| 2026-02-17 | 13F | Two Sigma Advisers, Lp | 0 | -100,00 | 0 | -100,00 | ||||
| 2026-01-28 | 13F | Universal- Beteiligungs- und Servicegesellschaft mbH | 0 | -100,00 | 0 | -100,00 | ||||
| 2026-02-10 | 13F | Zweig-DiMenna Associates LLC | 0 | -100,00 | 0 | |||||
| 2026-02-06 | 13F | Bare Financial Services, Inc | 22 | 0 | ||||||
| 2026-01-16 | 13F | FNY Investment Advisers, LLC | Call | 0 | -100,00 | 0 | ||||
| 2026-02-10 | 13F | Hillsdale Investment Management Inc. | 111.620 | -0,62 | 2.415 | -20,51 | ||||
| 2026-04-10 | 13F | Pure Financial Advisors, Inc. | 14.574 | 0,02 | 268 | -15,24 | ||||
| 2026-04-24 | 13F | UMA Financial Services, Inc. | 20 | -20,00 | 0 | |||||
| 2026-02-10 | 13F | Bank of New York Mellon Corp | 156.088 | 9,95 | 3.378 | -12,06 | ||||
| 2026-02-11 | 13F | CenterBook Partners LP | 75.112 | 1.625 |