Grundlæggende statistik
| Institutionelle aktier (lange) | 97.312.797 - 66,59% (ex 13D/G) - change of -26,27MM shares -21,26% MRQ |
| Institutionel værdi (lang) | $ 1.153.186 USD ($1000) |
Institutionelt ejerskab og aktionærer
Northwest Bancshares, Inc. (US:NWBI) har 298 institutionelle ejere og aktionærer, der har indsendt 13D/G- eller 13F-formularer til Securities Exchange Commission (SEC). Disse institutioner har i alt 97,312,797 aktier. Største aktionærer omfatter BlackRock, Inc., Vanguard Group Inc, Dimensional Fund Advisors Lp, State Street Corp, Charles Schwab Investment Management Inc, Geode Capital Management, Llc, Victory Capital Management Inc, Bank of New York Mellon Corp, Northern Trust Corp, and Fmr Llc .
Northwest Bancshares, Inc. (NasdaqGS:NWBI) institutionel ejerskabsstruktur viser aktuelle positioner i virksomheden efter institutioner og fonde, samt seneste ændringer i positionsstørrelse. Større aktionærer kan omfatte individuelle investorer, investeringsforeninger, hedgefonde eller institutioner. Skema 13D angiver, at investoren besidder (eller besidder) mere end 5 % af virksomheden og har til hensigt (eller har til hensigt at) aktivt at forfølge en ændring i forretningsstrategi. Skema 13G indikerer en passiv investering på over 5%.
The share price as of March 31, 2026 is 12,69 / share. Previously, on April 1, 2025, the share price was 12,05 / share. This represents an increase of 5,31% over that period.

Fondens stemningsscore
Fund Sentiment Score (fka Ownership Accumulation Score) finder de aktier, der bliver mest købt af fonde. Det er resultatet af en sofistikeret, multi-faktor kvantitativ model, der identificerer virksomheder med de højeste niveauer af institutionel akkumulering. Scoringsmodellen bruger en kombination af den samlede stigning i oplyste ejere, ændringerne i porteføljeallokeringer i disse ejere og andre målinger. Tallet går fra 0 til 100, hvor højere tal indikerer et højere niveau af akkumulering for sine jævnaldrende, og 50 er gennemsnittet.
Opdateringsfrekvens: Dagligt
Se Ownership Explorer, som giver en liste over højest rangerende virksomheder.
AI+ Ask Fintel’s AI assistant about Northwest Bancshares, Inc..
Select a question to share a public post with an AI-crafted answer.
Thinking of good questions…
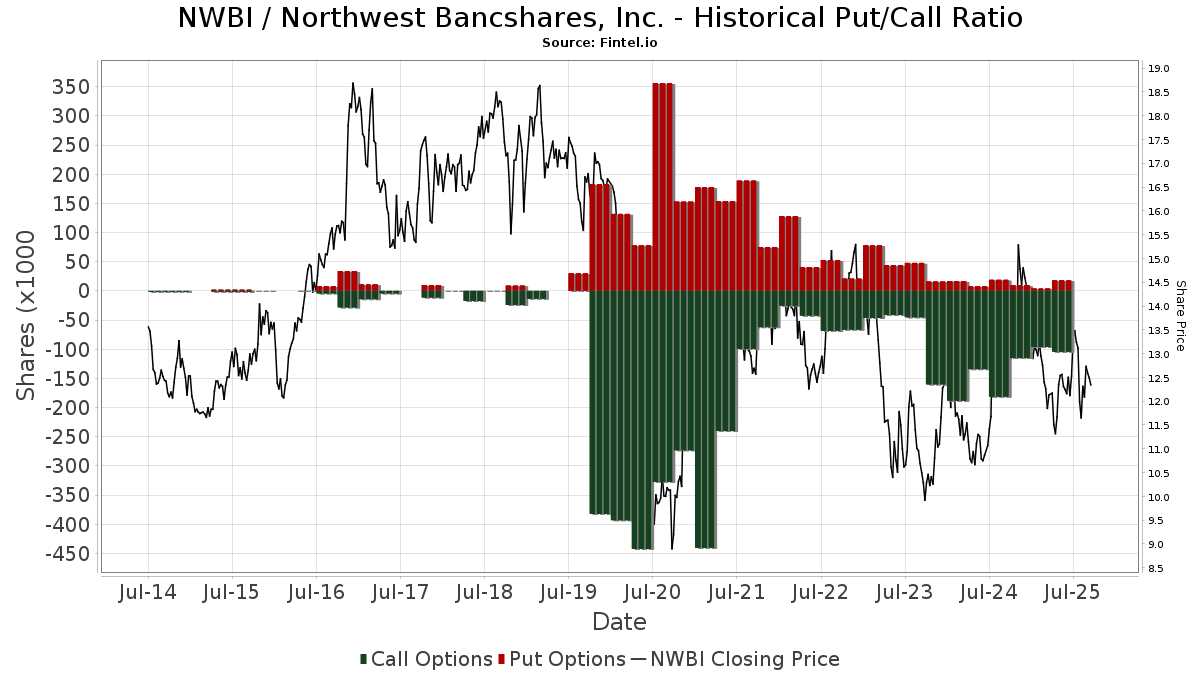
Institutionel Put/Call-forhold
Ud over at indberette standardaktie- og gældsudstedelser skal institutter med mere end 100 mill. aktiver under forvaltning også oplyse deres put- og call-optionsbeholdninger. Da salgsoptioner generelt indikerer negativ stemning, og købsoptioner indikerer positiv stemning, kan vi få en fornemmelse af den overordnede institutionelle stemning ved at plotte forholdet mellem put og kald. Diagrammet til højre viser det historiske put/call-forhold for dette instrument.
Brug af Put/Call Ratio som en indikator for investorernes stemning overvinder en af de vigtigste mangler ved at bruge totalt institutionelt ejerskab, som er, at en betydelig mængde af aktiver under forvaltning investeres passivt for at spore indekser. Passivt forvaltede fonde køber typisk ikke optioner, så indikatoren for put/call-forholdet følger mere nøje følelsen af aktivt forvaltede fonde.
13D/G-arkivering
Vi præsenterer 13D/G ansøgninger separat fra 13F ansøgninger på grund af den forskellige behandling af SEC. 13D/G-ansøgninger kan indgives af grupper af investorer (med én ledende), hvorimod 13F-ansøgninger ikke kan. Dette resulterer i situationer, hvor en investor kan indsende en 13D/G, der rapporterer én værdi for de samlede aktier (der repræsenterer alle de aktier, der ejes af investorgruppen), men derefter indsender en 13F, der rapporterer en anden værdi for de samlede aktier (der udelukkende repræsenterer deres egne) ejendomsret). Det betyder, at aktieejerskab af 13D/G-arkiver og 13F-arkiveringer ofte ikke er direkte sammenlignelige, så vi præsenterer dem separat.
Bemærk: Fra den 16. maj 2021 viser vi ikke længere ejere, der ikke har indsendt en 13D/G inden for det seneste år. Tidligere viste vi den fulde historie af 13D/G-arkiver. Generelt skal enheder, der er forpligtet til at indgive 13D/G-ansøgninger, indgive mindst årligt, før de indsender en afsluttende ansøgning. Dog forlader fonde nogle gange positioner uden at indsende en afsluttende ansøgning (dvs. de afvikler), så visning af den fulde historie resulterede nogle gange i forvirring om det nuværende ejerskab. For at undgå forvirring viser vi nu kun 'aktuelle' ejere - det vil sige - ejere, der har anmeldt inden for det seneste år.
Upgrade to unlock premium data.
| Fil dato | Form | Investor | Forrige Aktier |
Seneste Aktier |
Δ Aktier (Procent) |
Ejendomsret (Procent) |
Δ Ejerskab (Procent) |
|
|---|---|---|---|---|---|---|---|---|
| 2026-03-27 | VANGUARD GROUP INC | 14,959,190 | 0 | -100.00 | 0.00 | -100.00 |
13F og NPORT arkivering
Detaljer om 13F-arkivering er gratis. Detaljer om NP-ansøgninger kræver et premium-medlemskab. Grønne rækker angiver nye positioner. Røde rækker angiver lukkede positioner. Klik på linket ikon for at se den fulde transaktionshistorik.
Opgrader
for at låse premium-data op og eksportere til Excel ![]() .
.
| Fil dato | Kilde | Investor | Type | Gennemsnitlig pris (Øst) |
Aktier | Δ Aktier (%) |
Rapporteret Værdi ($1000) |
Δ Værdi (%) |
Port Alloc (%) |
|
|---|---|---|---|---|---|---|---|---|---|---|
| 2026-01-07 | 13F | CWA Asset Management Group, LLC | 30.714 | 0,02 | 369 | -3,16 | ||||
| 2026-02-17 | 13F | Price T Rowe Associates Inc /md/ | 151.949 | 7,53 | 2 | 0,00 | ||||
| 2026-02-10 | 13F | Envestnet Asset Management Inc | 16.941 | -22,69 | 203 | -25,09 | ||||
| 2026-01-21 | 13F | Daytona Street Capital LLC | 14.310 | 172 | ||||||
| 2026-01-13 | 13F | Capital Investment Advisors, LLC | 12.536 | 1,73 | 150 | -1,32 | ||||
| 2026-01-14 | 13F | Wedge Capital Management L L P/nc | 85.824 | 2,09 | 1.030 | -1,15 | ||||
| 2026-02-13 | 13F | Police & Firemen's Retirement System of New Jersey | 40.876 | 0,58 | 491 | -2,58 | ||||
| 2026-02-03 | 13F | Everence Capital Management Inc | 12.440 | 0,00 | 0 | |||||
| 2026-02-04 | 13F | Oregon Public Employees Retirement Fund | 33.437 | 1,52 | 401 | -1,72 | ||||
| 2026-02-13 | 13F | Rafferty Asset Management, LLC | 119.738 | -20,25 | 1.437 | -22,80 | ||||
| 2026-02-13 | 13F | Glen Eagle Advisors, LLC | 950 | 850,00 | 11 | 1.000,00 | ||||
| 2026-02-13 | 13F | Prudential Financial Inc | 138.459 | -56,75 | 1.662 | -58,12 | ||||
| 2026-02-13 | 13F | Edgestream Partners, L.P. | 552.487 | 20,75 | 6.630 | 16,93 | ||||
| 2026-02-11 | 13F | LPL Financial LLC | 513.039 | 1,56 | 6.156 | -1,63 | ||||
| 2026-02-12 | 13F | Bank Of Montreal /can/ | 10.006 | -23,40 | 120 | -25,47 | ||||
| 2026-02-13 | 13F | Caxton Associates Llp | 0 | -100,00 | 0 | |||||
| 2026-02-10 | 13F | Goldman Sachs Group Inc | 777.725 | 61,13 | 9.333 | 56,05 | ||||
| 2026-02-02 | 13F | Fifth Third Bancorp | 689 | -53,60 | 8 | -55,56 | ||||
| 2026-01-27 | 13F | Zurcher Kantonalbank (Zurich Cantonalbank) | 47.208 | 566 | ||||||
| 2026-02-11 | 13F | MCF Advisors LLC | 1.684 | 0,00 | 20 | 0,00 | ||||
| 2026-02-17 | 13F | Alliancebernstein L.p. | 152.316 | 9,66 | 1.828 | 6,22 | ||||
| 2026-02-17 | 13F | Amundi | 14.239 | 0,00 | 171 | -4,49 | ||||
| 2026-02-17 | 13F | Quantinno Capital Management LP | 85.612 | 138,59 | 1.027 | 131,31 | ||||
| 2026-02-02 | 13F | Allegheny Financial Group LTD | 20.063 | 1,35 | 241 | -2,04 | ||||
| 2026-02-10 | 13F | Eurizon Capital SGR S.p.A. | 764 | 9 | ||||||
| 2026-02-12 | 13F | Swiss National Bank | 288.200 | 1,91 | 3.458 | -1,28 | ||||
| 2026-01-09 | 13F | Post Resch Tallon Group Inc. | 10.400 | -12,61 | 125 | -15,65 | ||||
| 2026-02-13 | 13F | Public Employees Retirement Association Of Colorado | 3.585 | 0,00 | 0 | |||||
| 2026-02-17 | 13F | Bridgeway Capital Management Inc | 918.572 | 2,56 | 11.023 | -0,68 | ||||
| 2026-02-20 | 13F | Sunbelt Securities, Inc. | 29 | 0,00 | 0 | |||||
| 2026-02-05 | 13F | Independent Solutions Wealth Management, LLC | 12.557 | 1,74 | 151 | -1,32 | ||||
| 2026-02-10 | 13F | Rothschild Investment Llc | 320 | 52,38 | 4 | 50,00 | ||||
| 2026-02-17 | 13F | Evergreen Wealth Solutions, LLC | 36.778 | 0,17 | 441 | -2,86 | ||||
| 2025-11-13 | 13F | EntryPoint Capital, LLC | 0 | -100,00 | 0 | |||||
| 2026-02-10 | 13F | ESL Trust Services, LLC | 2.000 | 0,00 | 24 | 0,00 | ||||
| 2026-02-17 | 13F | Russell Investments Group, Ltd. | 69.988 | 1,03 | 840 | -2,21 | ||||
| 2026-02-17 | 13F | Tower Research Capital LLC (TRC) | 6.318 | -24,71 | 76 | -27,18 | ||||
| 2026-01-05 | 13F | City Center Advisors, LLC | 0 | -100,00 | 0 | |||||
| 2026-02-06 | 13F | Covestor Ltd | 38 | -53,66 | 0 | |||||
| 2026-01-16 | 13F | DiNuzzo Private Wealth, Inc. | 9 | -10,00 | 0 | |||||
| 2026-02-12 | 13F | Cibc World Markets Corp | 0 | -100,00 | 0 | |||||
| 2026-02-11 | 13F | Simplex Trading, Llc | 4.286 | -0,92 | 51 | |||||
| 2026-02-05 | 13F | Allworth Financial LP | 383 | -63,00 | 5 | -66,67 | ||||
| 2026-02-11 | 13F | Simplex Trading, Llc | Put | 18.600 | 2,20 | 223 | ||||
| 2026-02-13 | 13F | Citigroup Inc | 127.175 | -8,21 | 1.526 | -11,07 | ||||
| 2026-02-10 | 13F | Bank of New York Mellon Corp | 1.588.043 | 4,86 | 19.057 | 1,56 | ||||
| 2026-02-17 | 13F | Ancora Advisors, LLC | 44.265 | 0,00 | 531 | -3,10 | ||||
| 2026-02-09 | 13F | Geode Capital Management, Llc | 3.606.094 | -0,08 | 43.281 | -3,22 | ||||
| 2025-10-24 | 13F | Hemington Wealth Management | 79 | 0,00 | 0 | |||||
| 2026-02-13 | 13F | Kestra Advisory Services, LLC | 7.714 | 93 | ||||||
| 2026-02-11 | 13F | Krane Funds Advisors LLC | 13.247 | -10,82 | 159 | -11,24 | ||||
| 2026-02-11 | 13F | Group One Trading, L.p. | Put | 0 | -100,00 | 0 | -100,00 | |||
| 2026-02-11 | 13F | Fox Run Management, L.l.c. | 16.473 | 198 | ||||||
| 2026-02-17 | 13F | Aster Capital Management (DIFC) Ltd | 216 | 191,89 | 3 | |||||
| 2026-02-06 | 13F | IFP Advisors, Inc | 219 | -0,90 | 3 | 0,00 | ||||
| 2026-02-10 | 13F | Connor, Clark & Lunn Investment Management Ltd. | 0 | -100,00 | 0 | |||||
| 2026-02-13 | 13F | First Trust Advisors Lp | 1.049.412 | 2,76 | 12.593 | -0,47 | ||||
| 2026-01-21 | 13F | Capital Investment Advisory Services, LLC | 31.412 | 0,37 | 377 | -2,84 | ||||
| 2026-02-24 | 13F | Bell Investment Advisors, Inc | 0 | -100,00 | 0 | |||||
| 2026-01-22 | 13F | Financial Consulate, Inc | 1.350 | 0,00 | 16 | 0,00 | ||||
| 2026-02-09 | 13F | Keating Financial Advisory Services, Inc. | 29 | 0 | ||||||
| 2026-02-17 | 13F | Mercer Global Advisors Inc /adv | 63.145 | 2,47 | 758 | -0,79 | ||||
| 2026-02-17 | 13F | VARCOV Co. | 34.770 | 417 | ||||||
| 2026-02-14 | 13F | Rockefeller Capital Management L.P. | 1.000 | -27,33 | 12 | -29,41 | ||||
| 2026-01-14 | 13F | Spire Wealth Management | 144 | 0,00 | 2 | 0,00 | ||||
| 2026-02-12 | 13F | Jane Street Group, Llc | 62.986 | 6,97 | 756 | 3,57 | ||||
| 2026-02-13 | 13F | Carter Financial Group, INC. | 15.528 | 0,00 | 186 | -3,12 | ||||
| 2026-01-12 | 13F | Abound Wealth Management | 6.828 | 59,83 | 82 | 55,77 | ||||
| 2025-11-14 | 13F | Susquehanna International Group, Llp | Call | 0 | -100,00 | 0 | -100,00 | |||
| 2026-01-30 | 13F | New York State Teachers Retirement System | 32.395 | 0,00 | 0 | |||||
| 2026-02-12 | 13F | Dimensional Fund Advisors Lp | 8.608.107 | -1,33 | 103.298 | -4,43 | ||||
| 2026-02-03 | 13F | International Assets Investment Management, Llc | 780 | 9 | ||||||
| 2026-02-17 | 13F | Canada Pension Plan Investment Board | 48.100 | 577 | ||||||
| 2025-11-14 | 13F | Walleye Capital LLC | 0 | -100,00 | 0 | |||||
| 2025-12-09 | 13F | Painted Porch Advisors LLC | 0 | -100,00 | 0 | |||||
| 2026-01-09 | 13F | SG Americas Securities, LLC | 68.700 | 67,82 | 1 | |||||
| 2026-02-11 | 13F | Group One Trading, L.p. | Call | 2.800 | -37,78 | 34 | -40,00 | |||
| 2026-02-13 | 13F | Johnson Investment Counsel Inc | 0 | -100,00 | 0 | |||||
| 2026-01-08 | 13F | Wealth Enhancement Advisory Services, Llc | 34.336 | -0,01 | 419 | -2,11 | ||||
| 2026-02-05 | 13F | Bedminster, LLC | 11.050 | 133 | ||||||
| 2026-02-10 | 13F | Savant Capital, LLC | 0 | -100,00 | 0 | |||||
| 2026-02-10 | 13F | Bnp Paribas Arbitrage, Sa | 32.924 | -9,19 | 395 | -12,03 | ||||
| 2026-02-06 | 13F | Blackston Financial Advisory Group, LLC | 15.519 | 0,00 | 186 | -3,12 | ||||
| 2026-02-13 | 13F | Ieq Capital, Llc | 56.433 | -25,70 | 677 | -27,98 | ||||
| 2026-02-11 | 13F | Rise Advisors, LLC | 0 | -100,00 | 0 | |||||
| 2026-01-12 | 13F | First Merchants Corp | 0 | -100,00 | 0 | |||||
| 2026-02-17 | 13F | Graham Capital Management, L.P. | 62.032 | 744 | ||||||
| 2026-02-12 | 13F | Ensign Peak Advisors, Inc | 6.960 | 0,00 | 84 | -3,49 | ||||
| 2026-02-12 | 13F | Nuveen, LLC | 593.784 | -34,41 | 7.125 | -36,47 | ||||
| 2025-10-09 | 13F | IVC Wealth Advisors LLC | 0 | -100,00 | 0 | |||||
| 2026-02-13 | 13F | BNP Paribas Asset Management Holding S.A. | 2.011 | 34,43 | 0 | |||||
| 2026-02-02 | 13F | Principal Financial Group Inc | 696.282 | -1,37 | 8.355 | -4,47 | ||||
| 2026-02-17 | 13F | Raymond James Financial Inc | 36.018 | -4,04 | 432 | -7,10 | ||||
| 2026-02-17 | 13F | Royal Bank Of Canada | 171.773 | 190,55 | 2.061 | 181,94 | ||||
| 2026-01-16 | 13F | Ronald Blue Trust, Inc. | 152 | 0,00 | 2 | 0,00 | ||||
| 2026-02-13 | 13F | Umb Bank N A/mo | 578 | -3,34 | 7 | -14,29 | ||||
| 2026-02-09 | 13F | HBK Sorce Advisory LLC | 29.669 | -2,99 | 396 | 3,40 | ||||
| 2026-02-06 | 13F | Handelsbanken Fonder AB | 19.300 | 0,00 | 0 | |||||
| 2026-02-03 | 13F | We Are One Seven, LLC | 25.784 | -2,58 | 309 | -5,50 | ||||
| 2026-02-09 | 13F | Quest Partners LLC | 63.732 | 5,15 | 765 | 1,87 | ||||
| 2026-01-23 | 13F | Farther Finance Advisors, LLC | 5.395 | 128,80 | 65 | 120,69 | ||||
| 2026-01-21 | 13F | Yousif Capital Management, Llc | 39.082 | -12,33 | 481 | -12,86 | ||||
| 2026-02-09 | 13F | Legal & General Group Plc | 369.536 | -1,38 | 4.434 | -4,48 | ||||
| 2026-02-17 | 13F | Bank Of America Corp /de/ | 250.584 | -31,77 | 3.007 | -33,91 | ||||
| 2026-02-17 | 13F | MIRAE ASSET GLOBAL ETFS HOLDINGS Ltd. | 67.473 | -0,01 | 810 | -3,23 | ||||
| 2026-01-23 | 13F | Valley National Advisers Inc | 1.109 | 0,00 | 0 | |||||
| 2026-02-13 | 13F | Intrepid Financial Planning Group LLC | 187.652 | -3,36 | 2.252 | -6,40 | ||||
| 2026-02-11 | 13F | Ameritas Investment Partners, Inc. | 12.134 | 146 | ||||||
| 2026-02-13 | 13F | Sterling Capital Management LLC | 8.448 | -16,00 | 101 | -18,55 | ||||
| 2026-02-13 | 13F | SRS Capital Advisors, Inc. | 118 | -99,42 | 1 | -99,60 | ||||
| 2026-02-12 | 13F | Campbell & CO Investment Adviser LLC | 0 | -100,00 | 0 | |||||
| 2026-02-17 | 13F | Engineers Gate Manager LP | 66.937 | 803 | ||||||
| 2026-02-18 | 13F | State of Tennessee, Treasury Department | 29.034 | -55,81 | 374 | -54,18 | ||||
| 2026-02-17 | 13F | Citadel Advisors Llc | Call | 17.200 | -12,24 | 206 | -14,88 | |||
| 2026-02-17 | 13F | Susquehanna Fundamental Investments, Llc | 158.280 | 45,68 | 1.899 | 41,08 | ||||
| 2026-02-17 | 13F | California State Teachers Retirement System | 137.284 | -0,09 | 1.647 | -3,23 | ||||
| 2026-02-17 | 13F | ISAM Funds (UK) Ltd | 26.845 | 322 | ||||||
| 2026-02-17 | 13F | Murchinson Ltd. | 30.000 | 0,00 | 360 | -2,96 | ||||
| 2026-02-17 | 13F | Citadel Advisors Llc | 352.196 | -18,31 | 4.226 | -20,88 | ||||
| 2026-02-09 | 13F | Atlantic Trust, LLC | 0 | -100,00 | 0 | |||||
| 2026-02-13 | 13F | Ubs Asset Management Americas Inc | 252.659 | 1,44 | 3.032 | -1,78 | ||||
| 2026-02-17 | 13F | Optiver Holding B.V. | 722 | 264,65 | 9 | 300,00 | ||||
| 2026-02-17 | 13F | State Of Wisconsin Investment Board | 0 | -100,00 | 0 | |||||
| 2026-02-18 | 13F | GWM Advisors LLC | 80.637 | -31,10 | 968 | -33,31 | ||||
| 2026-02-18 | 13F | Beacon Pointe Advisors, LLC | 0 | -100,00 | 0 | |||||
| 2026-02-13 | 13F | Manufacturers Life Insurance Company, The | 0 | -100,00 | 0 | -100,00 | ||||
| 2026-02-14 | 13F | Berkshire Asset Management Llc/pa | 51.348 | -56,07 | 616 | -57,46 | ||||
| 2026-02-13 | 13F | MAI Capital Management | 3.038 | -58,86 | 36 | -60,44 | ||||
| 2026-02-13 | 13F | Great West Life Assurance Co /can/ | 140.833 | -21,79 | 2 | -50,00 | ||||
| 2026-02-12 | 13F | New York State Common Retirement Fund | 44.553 | 0,00 | 535 | -3,26 | ||||
| 2025-11-12 | 13F/A | Norges Bank | 203.020 | -52,82 | 2.716 | -45,35 | ||||
| 2026-02-13 | 13F | Quarry LP | 119 | -54,75 | 1 | -66,67 | ||||
| 2026-02-09 | 13F | MQS Management LLC | 15.033 | 180 | ||||||
| 2026-02-10 | 13F | Commonwealth Of Pennsylvania Public School Empls Retrmt Sys | 36.169 | -2,87 | 434 | -5,86 | ||||
| 2026-02-13 | 13F | Martingale Asset Management L P | 0 | -100,00 | 0 | |||||
| 2026-02-11 | 13F | J.w. Cole Advisors, Inc. | 12.828 | 0,24 | 154 | -3,16 | ||||
| 2026-02-11 | 13F | Janney Capital Management LLC | 18.345 | -7,56 | 0 | |||||
| 2026-02-17 | 13F | Maryland State Retirement & Pension System | 21.308 | 1,24 | 256 | -1,92 | ||||
| 2026-02-23 | 13F | Virtu Financial LLC | 11.471 | 0 | ||||||
| 2026-02-17 | 13F | Ameriprise Financial Inc | 274.931 | -10,76 | 3.299 | -13,57 | ||||
| 2026-01-14 | 13F | Jfs Wealth Advisors, Llc | 4.127 | 3.397,46 | 50 | 4.800,00 | ||||
| 2026-02-17 | 13F | Private Advisor Group, LLC | 45.622 | 215,55 | 547 | 205,59 | ||||
| 2026-02-19 | 13F | Invesco Ltd. | 1.345.312 | -4,03 | 16.144 | -7,05 | ||||
| 2026-02-17 | 13F | Voloridge Investment Management, Llc | 159.748 | -17,45 | 1.917 | -20,07 | ||||
| 2026-01-15 | 13F | Allspring Global Investments Holdings, LLC | 42.647 | 9,57 | 512 | 6,68 | ||||
| 2026-02-06 | 13F | Van Hulzen Asset Management, LLC | 12.650 | -42,89 | 152 | -44,89 | ||||
| 2026-02-17 | 13F | Public Employees Retirement System Of Ohio | 2.455 | 2,51 | 29 | 0,00 | ||||
| 2026-02-12 | 13F | Cloud Capital Management, LLC | 0 | -100,00 | 0 | |||||
| 2026-02-17 | 13F | Jones Financial Companies Lllp | 2.729 | -23,60 | 33 | -27,27 | ||||
| 2025-10-20 | 13F | Diversified Trust Co | 0 | -100,00 | 0 | -100,00 | ||||
| 2026-02-17 | 13F | Vista Investment Management | 10.325 | 0,00 | 124 | -3,15 | ||||
| 2026-01-29 | 13F | Courier Capital Llc | 12.531 | -9,06 | 150 | -11,76 | ||||
| 2026-01-29 | 13F | Dunhill Financial, LLC | 3 | 0 | ||||||
| 2026-02-17 | 13F | Boothbay Fund Management, Llc | 30.502 | -0,86 | 366 | -3,94 | ||||
| 2026-01-29 | 13F | St Germain D J Co Inc | 97.390 | -3,89 | 1.169 | -6,93 | ||||
| 2026-02-09 | 13F | Minerva Advisors LLC | 38.000 | 0,00 | 456 | -2,98 | ||||
| 2026-02-13 | 13F | Victory Capital Management Inc | 2.679.200 | 0,07 | 32.150 | -3,08 | ||||
| 2026-02-13 | 13F | Public Sector Pension Investment Board | 0 | -100,00 | 0 | |||||
| 2026-02-10 | 13F | Quantbot Technologies LP | 299 | 4 | ||||||
| 2026-02-05 | 13F | Lawood & Co | 116.982 | 1.404 | ||||||
| 2026-02-13 | 13F | Healthcare Of Ontario Pension Plan Trust Fund | 178.112 | 2.137 | ||||||
| 2026-01-28 | 13F | Teacher Retirement System Of Texas | 12.737 | -55,87 | 153 | -57,42 | ||||
| 2026-01-21 | 13F | SJS Investment Consulting Inc. | 8 | 0,00 | 0 | |||||
| 2026-02-13 | 13F | Aigen Investment Management, Lp | 0 | -100,00 | 0 | |||||
| 2026-02-13 | 13F | Panagora Asset Management Inc | 0 | -100,00 | 0 | |||||
| 2026-02-11 | 13F | Sunrise Financial Services, LLC | 50 | 1 | ||||||
| 2026-02-17 | 13F | Two Sigma Investments, Lp | 377.523 | 101,66 | 4.530 | 95,34 | ||||
| 2026-01-21 | 13F | Sound Income Strategies, LLC | 117 | 1 | ||||||
| 2026-02-12 | 13F | State Board Of Administration Of Florida Retirement System | 36.387 | 0,00 | 437 | -3,11 | ||||
| 2025-11-14 | 13F | Corton Capital Inc. | 0 | -100,00 | 0 | |||||
| 2026-02-06 | 13F | EverSource Wealth Advisors, LLC | 3.707 | -16,23 | 44 | -18,52 | ||||
| 2025-11-03 | 13F | AE Wealth Management LLC | 0 | -100,00 | 0 | -100,00 | ||||
| 2026-01-13 | 13F | CoreCap Advisors, LLC | 4.210 | 0,00 | 51 | -3,85 | ||||
| 2025-11-21 | 13F/A | CIBC Bancorp USA Inc. | 15.482 | 192 | ||||||
| 2026-02-10 | 13F | Hazlett, Burt & Watson, Inc. | 259 | 0,00 | 0 | |||||
| 2026-02-10 | 13F | Intech Investment Management Llc | 57.702 | -52,60 | 692 | -54,11 | ||||
| 2026-01-30 | 13F | Us Bancorp \de\ | 399 | 0,00 | 5 | 0,00 | ||||
| 2026-02-11 | 13F | Brandywine Global Investment Management, LLC | 209.915 | -3,67 | 2.519 | -6,71 | ||||
| 2026-02-13 | 13F | Morgan Stanley | 1.382.107 | -0,80 | 16.585 | -3,92 | ||||
| 2026-02-17 | 13F | Balyasny Asset Management Llc | 17.754 | 18,52 | 213 | 15,14 | ||||
| 2026-02-17 | 13F | Susquehanna International Group, Llp | 0 | -100,00 | 0 | |||||
| 2026-02-17 | 13F | Fmr Llc | 1.477.040 | 24,73 | 17.724 | 20,80 | ||||
| 2026-01-05 | 13F | Chesapeake Asset Management Llc | 0 | -100,00 | 0 | |||||
| 2026-01-21 | 13F | Country Trust Bank | 465 | 0,00 | 6 | 0,00 | ||||
| 2026-01-27 | 13F | Institute for Wealth Management, LLC. | 0 | -100,00 | 0 | |||||
| 2026-02-13 | 13F | Barclays Plc | 287.451 | 8,21 | 3.449 | -2,95 | ||||
| 2026-02-13 | 13F | State Street Corp | 8.318.379 | 0,57 | 99.821 | -2,59 | ||||
| 2026-02-06 | 13F | ProShare Advisors LLC | 28.245 | 3,17 | 339 | -0,29 | ||||
| 2026-01-23 | 13F | Burney Co/ | 34.564 | 43,71 | 415 | 38,93 | ||||
| 2026-02-04 | 13F | Virginia Retirement Systems Et Al | 0 | -100,00 | 0 | |||||
| 2026-02-17 | 13F | Susquehanna Portfolio Strategies, LLC | 15.428 | 0,00 | 185 | -3,14 | ||||
| 2026-01-21 | 13F | Flagship Harbor Advisors, Llc | 31 | 0 | ||||||
| 2026-02-17 | 13F | Two Sigma Advisers, Lp | 54.142 | 373,89 | 650 | 360,28 | ||||
| 2026-02-09 | 13F | Huntington National Bank | 2.400 | -1,40 | 29 | -6,67 | ||||
| 2026-02-13 | 13F | Entropy Technologies, LP | 16.457 | 22,77 | 197 | 18,67 | ||||
| 2026-02-13 | 13F | Y-Intercept (Hong Kong) Ltd | 0 | -100,00 | 0 | |||||
| 2026-02-13 | 13F | Squarepoint Ops LLC | 23.684 | 92,24 | 284 | 86,84 | ||||
| 2025-11-14 | 13F | Toroso Investments, LLC | 0 | -100,00 | 0 | -100,00 | ||||
| 2026-02-05 | 13F | Dana Investment Advisors, Inc. | 519.870 | -0,13 | 6.238 | -3,27 | ||||
| 2026-02-05 | 13F | Cambridge Investment Research Advisors, Inc. | 24.330 | -7,54 | 0 | |||||
| 2026-02-03 | 13F | SBI Securities Co., Ltd. | 8.487 | -12,12 | 102 | -15,13 | ||||
| 2026-01-13 | 13F | Bank & Trust Co | 15.688 | 5,49 | 188 | 2,17 | ||||
| 2026-02-13 | 13F | Northwest Bancshares, Inc. | 237.810 | 0,17 | 2.854 | -2,99 | ||||
| 2026-02-11 | 13F | Janney Montgomery Scott LLC | 38.716 | 7,67 | 0 | |||||
| 2026-01-29 | 13F | Teachers Retirement System Of The State Of Kentucky | 36.024 | -4,70 | 0 | |||||
| 2026-02-13 | 13F | Wbi Investments, Inc. | 18.349 | 49,96 | 220 | 45,70 | ||||
| 2026-02-02 | 13F | McHugh Group, LLC | 14.359 | 0,00 | 172 | -2,82 | ||||
| 2026-02-03 | 13F | Sequoia Financial Advisors, LLC | 175.059 | 5,31 | 2.101 | 1,99 | ||||
| 2026-02-11 | 13F | Illinois Municipal Retirement Fund | 74.953 | -2,44 | 899 | -5,47 | ||||
| 2025-11-14 | 13F | Texas Permanent School Fund | 0 | -100,00 | 0 | |||||
| 2026-02-17 | 13F | Creative Planning | 45.248 | 15,75 | 543 | 11,98 | ||||
| 2026-01-16 | 13F | Empirical Financial Services, LLC d.b.a. Empirical Wealth Management | 0 | -100,00 | 0 | |||||
| 2026-02-17 | 13F | Advisory Services Network, LLC | 0 | -100,00 | 0 | |||||
| 2025-11-14 | 13F | Jane Street Group, Llc | Call | 0 | -100,00 | 0 | -100,00 | |||
| 2026-01-27 | 13F | Evergreen Capital Management Llc | 21.420 | 41,09 | 257 | 36,70 | ||||
| 2026-02-12 | 13F | Xponance, Inc. | 11.500 | 0,82 | 138 | -2,13 | ||||
| 2026-02-05 | 13F | Amalgamated Bank | 42.451 | 0,40 | 1 | |||||
| 2026-02-17 | 13F | Hancock Whitney Corp | 19.909 | 0,00 | 239 | -3,25 | ||||
| 2026-02-20 | 13F | Kovitz Investment Group Partners, LLC | 0 | -100,00 | 0 | |||||
| 2026-02-17 | 13F | Kemnay Advisory Services Inc. | 5.294 | 64 | ||||||
| 2026-01-28 | 13F | Salomon & Ludwin, LLC | 524 | -3,85 | 6 | 0,00 | ||||
| 2026-01-05 | 13F | GAMMA Investing LLC | 9.750 | 166,39 | 117 | 160,00 | ||||
| 2026-02-17 | 13F | Jump Financial, LLC | 0 | -100,00 | 0 | |||||
| 2025-10-23 | 13F | Caldwell Trust Co | 0 | -100,00 | 0 | |||||
| 2026-01-26 | 13F | KBC Group NV | 5.227 | 0,00 | 0 | |||||
| 2025-11-14 | 13F | Schonfeld Strategic Advisors LLC | 0 | -100,00 | 0 | |||||
| 2026-02-10 | 13F | Hillsdale Investment Management Inc. | 0 | -100,00 | 0 | |||||
| 2026-02-13 | 13F | Jacobi Capital Management LLC | 14.510 | -31,55 | 174 | -33,59 | ||||
| 2026-01-07 | 13F | Next Level Private LLC | 16.969 | 1,71 | 204 | -2,87 | ||||
| 2026-01-28 | 13F | Arizona State Retirement System | 40.764 | -5,55 | 489 | -8,43 | ||||
| 2026-02-10 | 13F/A | Northwestern Mutual Wealth Management Co | 5.190 | 1,53 | 62 | -1,59 | ||||
| 2026-02-11 | 13F | Franklin Resources Inc | 80.908 | 2,07 | 971 | -1,22 | ||||
| 2026-01-16 | 13F | Louisiana State Employees Retirement System | 66.900 | -0,45 | 803 | -3,61 | ||||
| 2026-02-05 | 13F | Thrivent Financial For Lutherans | 330.528 | -23,74 | 4 | -40,00 | ||||
| 2026-02-04 | 13F | Versor Investments LP | 22.347 | -61,90 | 268 | -63,09 | ||||
| 2026-01-08 | 13F | Versant Capital Management, Inc | 2.972 | 38,36 | 36 | 34,62 | ||||
| 2026-02-11 | 13F | Picton Mahoney Asset Management | 86 | 0,00 | 1 | |||||
| 2026-02-17 | 13F | Northern Trust Corp | 1.582.841 | -4,53 | 18.994 | -7,53 | ||||
| 2026-02-03 | 13F | Wesbanco Bank Inc | 18.617 | 0,00 | 223 | -3,04 | ||||
| 2026-02-12 | 13F | Federated Hermes, Inc. | 11.016 | 0,00 | 132 | -2,94 | ||||
| 2026-02-13 | 13F | Pathstone Holdings, LLC | 23.819 | 0,80 | 286 | -2,40 | ||||
| 2026-01-28 | 13F | Klp Kapitalforvaltning As | 30.500 | 0,00 | 366 | -2,92 | ||||
| 2026-02-11 | 13F | Jpmorgan Chase & Co | 433.235 | 1,12 | 5.199 | -2,07 | ||||
| 2026-02-13 | 13F | Kilter Group LLC | 24 | 0 | ||||||
| 2026-02-11 | 13F | Los Angeles Capital Management Llc | 517 | 6 | ||||||
| 2026-02-13 | 13F | Colony Group, LLC | 20.602 | 247 | ||||||
| 2026-01-29 | 13F | Pictet Asset Management Holding SA | 20.514 | 0,00 | 246 | -3,15 | ||||
| 2026-02-11 | 13F | Parallel Advisors, LLC | 182 | -19,82 | 2 | 0,00 | ||||
| 2026-02-13 | 13F | Sei Investments Co | 15.111 | 3,15 | 181 | 0,00 | ||||
| 2026-02-13 | 13F | Mariner, LLC | 62.814 | -22,89 | 754 | -25,27 | ||||
| 2025-11-13 | 13F | Landscape Capital Management, L.l.c. | 0 | -100,00 | 0 | |||||
| 2026-02-11 | 13F | CNB Bank | 4.751 | 70,78 | 57 | 67,65 | ||||
| 2026-02-17 | 13F | Janus Henderson Group Plc | 62.499 | 0,00 | 749 | -3,23 | ||||
| 2026-02-24 | 13F | DGS Capital Management, LLC | 0 | -100,00 | 0 | |||||
| 2026-02-06 | 13F | Envestnet Portfolio Solutions, Inc. | 28.421 | 49,14 | 341 | 44,49 | ||||
| 2026-02-12 | 13F | Voya Investment Management Llc | 24.224 | 0,00 | 291 | -3,33 | ||||
| 2026-01-30 | 13F | Keybank National Association/oh | 15.246 | 10,02 | 183 | 6,43 | ||||
| 2026-02-05 | 13F | Wakefield Asset Management LLLP | 0 | -100,00 | 0 | |||||
| 2026-02-17 | 13F | Cetera Investment Advisers | 155.376 | 0,25 | 1.865 | -2,92 | ||||
| 2026-02-11 | 13F | Empowered Funds, LLC | 532.372 | 5,93 | 6.388 | 2,60 | ||||
| 2026-02-11 | 13F | Gilpin Wealth Management, Llc | 11 | 0 | ||||||
| 2026-01-23 | 13F | Assetmark, Inc | 26 | 0 | ||||||
| 2026-02-12 | 13F | DRW Securities, LLC | 13.666 | 164 | ||||||
| 2026-01-26 | 13F | Mirae Asset Global Investments Co., Ltd. | 132.084 | -3,14 | 1.585 | -6,16 | ||||
| 2026-02-13 | 13F | PARK CIRCLE Co | 0 | -100,00 | 0 | |||||
| 2025-11-06 | 13F | Ameritas Advisory Services, LLC | 0 | -100,00 | 0 | -100,00 | ||||
| 2026-02-13 | 13F | Stifel Financial Corp | 137.954 | -0,16 | 1.655 | -3,27 | ||||
| 2026-02-06 | 13F | Lsv Asset Management | 155.600 | 0,00 | 2 | 0,00 | ||||
| 2026-02-10 | 13F | CIBC Asset Management Inc | 13.582 | 3,62 | 163 | 0,00 | ||||
| 2026-02-13 | 13F | Neuberger Berman Group LLC | 13.659 | -2,09 | 164 | -5,23 | ||||
| 2026-02-17 | 13F | Aqr Capital Management Llc | 495.019 | -8,12 | 5.940 | -11,01 | ||||
| 2026-01-15 | 13F | Nisa Investment Advisors, Llc | 8.391 | 154,97 | 101 | 150,00 | ||||
| 2026-02-06 | 13F | Intellus Advisors LLC | 25.159 | 0,00 | 302 | -3,22 | ||||
| 2026-01-12 | 13F | Roble, Belko & Company, Inc | 20 | 0,00 | 0 | |||||
| 2026-02-17 | 13F | Qube Research & Technologies Ltd | 236.114 | 2,06 | 2.833 | -1,15 | ||||
| 2026-01-12 | 13F | Rialto Wealth Management, LLC | 18 | 100,00 | 0 | |||||
| 2026-01-29 | 13F | UMA Financial Services, Inc. | 85 | 1 | ||||||
| 2026-02-05 | 13F | HFM Investment Advisors, LLC | 6 | 0,00 | 0 | |||||
| 2026-02-12 | 13F | Quadrant Capital Group Llc | 1.311 | -71,69 | 16 | -73,68 | ||||
| 2026-02-13 | 13F | Rhumbline Advisers | 398.679 | -3,61 | 4.784 | -6,64 | ||||
| 2026-02-13 | 13F | Charles Schwab Investment Management Inc | 6.214.619 | 1,80 | 74.575 | -1,40 | ||||
| 2026-02-17 | 13F | CWM Advisors, LLC | 38.926 | 6,19 | 467 | 2,86 | ||||
| 2026-02-13 | 13F | Arrowstreet Capital, Limited Partnership | 338.951 | -24,12 | 4.067 | -26,51 | ||||
| 2026-02-06 | 13F | Profund Advisors Llc | 17.849 | 214 | ||||||
| 2026-01-29 | 13F | Vanguard Group Inc | 16.337.481 | -1,02 | 196.050 | -4,14 | ||||
| 2026-01-21 | 13F | Capital Advisors, Ltd. LLC | 966 | 9,65 | 0 | |||||
| 2026-02-09 | 13F | Hartland & Co., LLC | 2.504 | -3,47 | 30 | -6,25 | ||||
| 2026-02-17 | 13F | Numerai GP LLC | 165.791 | 40,92 | 1.989 | 36,51 | ||||
| 2026-01-26 | 13F | Private Trust Co Na | 596 | 0,00 | 7 | 0,00 | ||||
| 2026-02-04 | 13F | Naples Global Advisors, Llc | 29.600 | 0,00 | 355 | -3,01 | ||||
| 2026-02-10 | 13F | Root Financial Partners, LLC | 412 | 7,01 | 5 | 0,00 | ||||
| 2026-02-03 | 13F | Farmers & Merchants Investments Inc | 90 | 0,00 | 1 | 0,00 | ||||
| 2026-02-09 | 13F | Harbour Investments, Inc. | 4.600 | 0,00 | 55 | -1,79 | ||||
| 2026-02-10 | 13F | Mutual Of America Capital Management Llc | 16.698 | 1,95 | 200 | -0,99 | ||||
| 2025-11-17 | 13F | Kestra Private Wealth Services, Llc | 0 | -100,00 | 0 | -100,00 | ||||
| 2026-02-10 | 13F | Nomura Asset Management Co Ltd | 1.200 | 0,00 | 14 | 0,00 | ||||
| 2026-03-13 | 13F | Fund Advisors of America Inc/FL | 13.839 | 166 | ||||||
| 2026-02-11 | 13F | Simplex Trading, Llc | Call | 0 | -100,00 | 0 | ||||
| 2026-01-16 | 13F | Longboard Asset Management, LP | 10.717 | 0,00 | 129 | -3,03 | ||||
| 2025-11-14 | 13F | Larson Financial Group LLC | 0 | -100,00 | 0 | |||||
| 2026-02-11 | 13F | Cerity Partners LLC | 90.258 | 191,06 | 1.084 | 182,77 | ||||
| 2026-02-17 | 13F | Aquatic Capital Management LLC | 0 | -100,00 | 0 | |||||
| 2026-02-06 | 13F | HighTower Advisors, LLC | 23.682 | 7,32 | 284 | 4,03 | ||||
| 2026-01-28 | 13F | Geneos Wealth Management Inc. | 3.200 | 0,00 | 38 | -2,56 | ||||
| 2026-03-06 | 13F | Hsbc Holdings Plc | 47.944 | 80,29 | 575 | 75,84 | ||||
| 2026-02-12 | 13F | Commonwealth Equity Services, Llc | 68.575 | -4,13 | 823 | |||||
| 2026-02-05 | 13F | Bessemer Group Inc | 1.431 | 19,85 | 0 | |||||
| 2026-02-17 | 13F | Oxford Asset Management Llp | 0 | -100,00 | 0 | -100,00 | ||||
| 2026-02-13 | 13F | Cornerstone Financial Management LLC | 43 | 1 | ||||||
| 2025-11-14 | 13F | Cubist Systematic Strategies, LLC | 0 | -100,00 | 0 | -100,00 | ||||
| 2026-02-12 | 13F | MetLife Investment Management, LLC | 78.474 | -4,93 | 942 | -7,93 | ||||
| 2026-01-08 | 13F | True Wealth Design, LLC | 611 | -32,56 | 7 | -36,36 | ||||
| 2025-11-17 | 13F | Kestra Investment Management, LLC | 0 | -100,00 | 0 | -100,00 | ||||
| 2025-11-12 | 13F | NewSquare Capital LLC | 0 | -100,00 | 0 | |||||
| 2026-02-13 | 13F | Seneschal Advisors, LLC | 2.250 | -25,00 | 27 | -27,03 | ||||
| 2026-02-13 | 13F | Wells Fargo & Company/mn | 182.309 | 38,06 | 2.188 | 33,68 | ||||
| 2026-01-12 | 13F | Daymark Wealth Partners, Llc | 23.166 | 0,00 | 278 | -3,48 | ||||
| 2026-02-12 | 13F | Brinker Capital Investments, LLC | 25.868 | -14,27 | 310 | -16,89 | ||||
| 2025-11-04 | 13F | High Note Wealth, LLC | 0 | -100,00 | 0 | |||||
| 2026-02-12 | 13F | Wealthspire Advisors, LLC | 0 | -100,00 | 0 | |||||
| 2025-11-14 | 13F | Lazard Asset Management Llc | 0 | -100,00 | 0 | |||||
| 2026-02-17 | 13F | Wiley Bros.-aintree Capital, Llc | 82.308 | 2,18 | 988 | -1,10 | ||||
| 2026-01-26 | 13F | Merit Financial Group, LLC | 115.886 | 0,24 | 1.391 | -2,93 | ||||
| 2026-02-12 | 13F | StoneX Group Inc. | 12.650 | 15,91 | 152 | 11,85 | ||||
| 2026-02-17 | 13F | Millennium Management Llc | 984.171 | 111,73 | 11.810 | 105,07 | ||||
| 2026-02-12 | 13F | Hudock, Inc. | 185.634 | 0,31 | 2.228 | -2,84 | ||||
| 2026-02-12 | 13F | Renaissance Technologies Llc | 19.069 | -91,53 | 229 | -91,83 | ||||
| 2025-11-14 | 13F | Tudor Investment Corp Et Al | 0 | -100,00 | 0 | |||||
| 2025-12-18 | 13F | Danske Bank A/s | 0 | -100,00 | 0 | |||||
| 2026-02-06 | 13F | Pnc Financial Services Group, Inc. | 95.265 | 9,55 | 1.143 | 6,13 | ||||
| 2026-02-13 | 13F | Bayview Asset Management, Llc | 90.000 | 1.080 | ||||||
| 2026-02-17 | 13F | Advisor Group Holdings, Inc. | 21.386 | 46,60 | 257 | 39,89 | ||||
| 2026-02-12 | 13F | Bank of Jackson Hole Trust | 0 | -100,00 | 0 | |||||
| 2026-02-12 | 13F | Ankerstar Wealth, LLC | 7 | 0 | ||||||
| 2026-02-11 | 13F | Deutsche Bank Ag\ | 117.672 | 5,90 | 1.412 | 2,62 | ||||
| 2026-02-12 | 13F | BlackRock, Inc. | 20.554.229 | 1,13 | 246.651 | -2,06 | ||||
| 2026-01-29 | 13F | Comerica Bank | 67.306 | -10,49 | 808 | -13,32 | ||||
| 2026-01-14 | 13F | Hennion & Walsh Asset Management, Inc. | 42.065 | -21,98 | 505 | -24,55 | ||||
| 2025-10-30 | 13F | Twin Peaks Wealth Advisors, LLC | 0 | -100,00 | 0 | -100,00 | ||||
| 2025-11-12 | 13F | Mach-1 Financial Group, Inc. | 0 | -100,00 | 0 | |||||
| 2026-02-02 | 13F | Bay Harbor Wealth Management, LLC | 7 | 16,67 | 0 | |||||
| 2026-01-07 | 13F | Massmutual Trust Co Fsb/adv | 2.120 | 0,00 | 25 | -3,85 | ||||
| 2026-02-18 | 13F | First Citizens Bank & Trust Co | 29.471 | 49,11 | 354 | 44,67 | ||||
| 2026-02-09 | 13F | Hantz Financial Services, Inc. | 9.074 | -28,27 | 0 | |||||
| 2026-02-12 | 13F | Triumph Capital Management | 200 | 0,00 | 2 | 0,00 | ||||
| 2025-10-22 | 13F | Gladstone Institutional Advisory LLC | 0 | -100,00 | 0 | |||||
| 2025-11-14 | 13F | D. E. Shaw & Co., Inc. | 0 | -100,00 | 0 | |||||
| 2026-01-29 | 13F | UBS Group AG | 1.065.090 | -5,77 | 12.781 | -8,73 | ||||
| 2026-02-12 | 13F | CIBC Private Wealth Group, LLC | 36 | -99,05 | 0 | -100,00 | ||||
| 2026-02-12 | 13F | Principal Securities, Inc. | 0 | -100,00 | 0 | |||||
| 2026-02-13 | 13F | Smartleaf Asset Management LLC | 6.680 | -5,68 | 81 | -9,09 | ||||
| 2026-01-20 | 13F | Harbor Capital Advisors, Inc. | 847 | -1,63 | 0 | |||||
| 2026-01-23 | 13F | State of Alaska, Department of Revenue | 79.529 | 1,04 | 1 | |||||
| 2026-02-12 | 13F | Elo Mutual Pension Insurance Co | 63.581 | 11,52 | 763 | 7,93 | ||||
| 2026-02-12 | 13F | Skopos Labs, Inc. | 0 | -100,00 | 0 | |||||
| 2026-02-17 | 13F | Mirabella Financial Services Llp | 21.107 | 253 | ||||||
| 2026-01-15 | 13F | Fortitude Family Office, LLC | 11 | -26,67 | 0 | |||||
| 2026-02-10 | 13F | Natixis Advisors, L.p. | 19.089 | 0 | ||||||
| 2026-01-28 | 13F | CAPROCK Group, Inc. | 17.903 | 215 | ||||||
| 2026-01-26 | 13F | Cwm, Llc | 29.237 | -7,98 | 0 | |||||
| 2026-02-10 | 13F | Bruce G. Allen Investments, LLC | 37 | 0 | ||||||
| 2026-02-12 | 13F | Steward Partners Investment Advisory, Llc | 1.060 | 1.696,61 | 13 | |||||
| 2026-02-13 | 13F | American Century Companies Inc | 1.172.413 | -3,30 | 14.069 | -6,35 | ||||
| 2026-02-13 | 13F | Pinnacle Wealth Planning Services, Inc. | 1.636 | 20 | ||||||
| 2026-01-20 | 13F | Signaturefd, Llc | 476 | -22,22 | 6 | -28,57 | ||||
| 2026-01-26 | 13F | Zullo Investment Group, Inc. | 16.118 | -0,62 | 193 | -3,50 | ||||
| 2026-02-13 | 13F | Parkside Financial Bank & Trust | 103 | 0,00 | 1 | 0,00 | ||||
| 2026-02-13 | 13F | Verition Fund Management LLC | 528.052 | 0,52 | 6.337 | -2,64 |
Other Listings
| DE:NHS | 10,80 € |