Grundlæggende statistik
| Institutionelle aktier (lange) | 11.586.212 - 45,87% (ex 13D/G) - change of -1,70MM shares -12,79% MRQ |
| Institutionel værdi (lang) | $ 1.527.096 USD ($1000) |
Institutionelt ejerskab og aktionærer
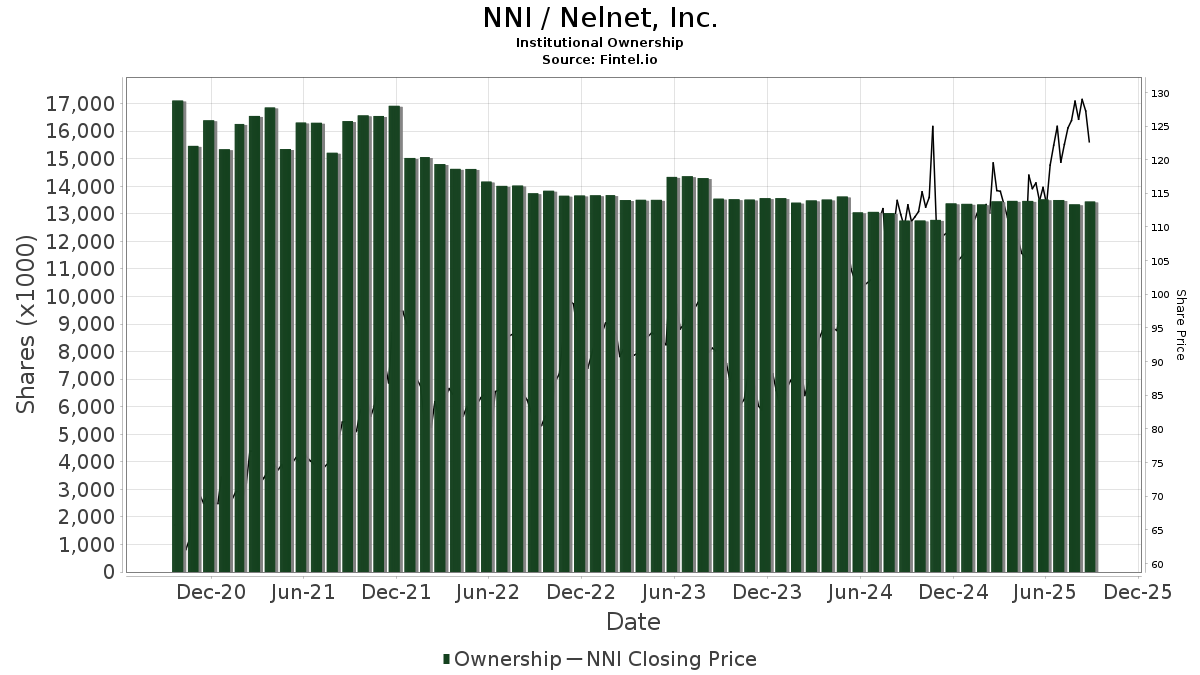
Nelnet, Inc. (US:NNI) har 222 institutionelle ejere og aktionærer, der har indsendt 13D/G- eller 13F-formularer til Securities Exchange Commission (SEC). Disse institutioner har i alt 11,586,212 aktier. Største aktionærer omfatter Dimensional Fund Advisors Lp, Magnolia Group, Llc, Vanguard Group Inc, Farmers & Merchants Investments Inc, BlackRock, Inc., Geode Capital Management, Llc, State Street Corp, American Century Companies Inc, General American Investors Co Inc, and Empyrean Capital Partners, LP .
Nelnet, Inc. (NYSE:NNI) institutionel ejerskabsstruktur viser aktuelle positioner i virksomheden efter institutioner og fonde, samt seneste ændringer i positionsstørrelse. Større aktionærer kan omfatte individuelle investorer, investeringsforeninger, hedgefonde eller institutioner. Skema 13D angiver, at investoren besidder (eller besidder) mere end 5 % af virksomheden og har til hensigt (eller har til hensigt at) aktivt at forfølge en ændring i forretningsstrategi. Skema 13G indikerer en passiv investering på over 5%.
The share price as of April 2, 2026 is 129,45 / share. Previously, on April 3, 2025, the share price was 106,70 / share. This represents an increase of 21,32% over that period.
Fondens stemningsscore
Fund Sentiment Score (fka Ownership Accumulation Score) finder de aktier, der bliver mest købt af fonde. Det er resultatet af en sofistikeret, multi-faktor kvantitativ model, der identificerer virksomheder med de højeste niveauer af institutionel akkumulering. Scoringsmodellen bruger en kombination af den samlede stigning i oplyste ejere, ændringerne i porteføljeallokeringer i disse ejere og andre målinger. Tallet går fra 0 til 100, hvor højere tal indikerer et højere niveau af akkumulering for sine jævnaldrende, og 50 er gennemsnittet.
Opdateringsfrekvens: Dagligt
Se Ownership Explorer, som giver en liste over højest rangerende virksomheder.
AI+ Ask Fintel’s AI assistant about Nelnet, Inc..
Select a question to share a public post with an AI-crafted answer.
Thinking of good questions…
Institutionel Put/Call-forhold
Ud over at indberette standardaktie- og gældsudstedelser skal institutter med mere end 100 mill. aktiver under forvaltning også oplyse deres put- og call-optionsbeholdninger. Da salgsoptioner generelt indikerer negativ stemning, og købsoptioner indikerer positiv stemning, kan vi få en fornemmelse af den overordnede institutionelle stemning ved at plotte forholdet mellem put og kald. Diagrammet til højre viser det historiske put/call-forhold for dette instrument.
Brug af Put/Call Ratio som en indikator for investorernes stemning overvinder en af de vigtigste mangler ved at bruge totalt institutionelt ejerskab, som er, at en betydelig mængde af aktiver under forvaltning investeres passivt for at spore indekser. Passivt forvaltede fonde køber typisk ikke optioner, så indikatoren for put/call-forholdet følger mere nøje følelsen af aktivt forvaltede fonde.

13D/G-arkivering
Vi præsenterer 13D/G ansøgninger separat fra 13F ansøgninger på grund af den forskellige behandling af SEC. 13D/G-ansøgninger kan indgives af grupper af investorer (med én ledende), hvorimod 13F-ansøgninger ikke kan. Dette resulterer i situationer, hvor en investor kan indsende en 13D/G, der rapporterer én værdi for de samlede aktier (der repræsenterer alle de aktier, der ejes af investorgruppen), men derefter indsender en 13F, der rapporterer en anden værdi for de samlede aktier (der udelukkende repræsenterer deres egne) ejendomsret). Det betyder, at aktieejerskab af 13D/G-arkiver og 13F-arkiveringer ofte ikke er direkte sammenlignelige, så vi præsenterer dem separat.
Bemærk: Fra den 16. maj 2021 viser vi ikke længere ejere, der ikke har indsendt en 13D/G inden for det seneste år. Tidligere viste vi den fulde historie af 13D/G-arkiver. Generelt skal enheder, der er forpligtet til at indgive 13D/G-ansøgninger, indgive mindst årligt, før de indsender en afsluttende ansøgning. Dog forlader fonde nogle gange positioner uden at indsende en afsluttende ansøgning (dvs. de afvikler), så visning af den fulde historie resulterede nogle gange i forvirring om det nuværende ejerskab. For at undgå forvirring viser vi nu kun 'aktuelle' ejere - det vil sige - ejere, der har anmeldt inden for det seneste år.
Upgrade to unlock premium data.
| Fil dato | Form | Investor | Forrige Aktier |
Seneste Aktier |
Δ Aktier (Procent) |
Ejendomsret (Procent) |
Δ Ejerskab (Procent) |
|
|---|---|---|---|---|---|---|---|---|
| 2026-03-27 | VANGUARD GROUP INC | 1,347,756 | 0 | -100.00 | 0.00 | -100.00 | ||
| 2025-11-13 | UNION BANK & TRUST CO / TRUSTEE | 3,861,769 | 2,047,228 | -46.99 | 7.90 | -44.76 | ||
| 2025-11-13 | MUHLEISEN ANGIE | 6,499,046 | 4,683,900 | -27.93 | 18.10 | -24.90 | ||
| 2025-11-13 | DUNLAP MICHAEL S | 15,298,252 | 13,387,235 | -12.49 | 37.80 | -11.68 |
13F og NPORT arkivering
Detaljer om 13F-arkivering er gratis. Detaljer om NP-ansøgninger kræver et premium-medlemskab. Grønne rækker angiver nye positioner. Røde rækker angiver lukkede positioner. Klik på linket ikon for at se den fulde transaktionshistorik.
Opgrader
for at låse premium-data op og eksportere til Excel ![]() .
.
| Fil dato | Kilde | Investor | Type | Gennemsnitlig pris (Øst) |
Aktier | Δ Aktier (%) |
Rapporteret Værdi ($1000) |
Δ Værdi (%) |
Port Alloc (%) |
|
|---|---|---|---|---|---|---|---|---|---|---|
| 2026-01-20 | 13F | Lawson Kroeker Investment Management Inc/ne | 66.142 | -34,46 | 8.794 | -30,50 | ||||
| 2026-02-13 | 13F | Parkside Financial Bank & Trust | 19 | 0,00 | 3 | 0,00 | ||||
| 2026-02-12 | 13F | Renaissance Technologies Llc | 30.200 | 134,11 | 4.015 | 148,30 | ||||
| 2026-01-29 | 13F | Comerica Bank | 2.655 | 0,04 | 353 | 6,33 | ||||
| 2026-02-12 | 13F | Cibc World Markets Corp | 0 | -100,00 | 0 | |||||
| 2026-02-13 | 13F | Martingale Asset Management L P | 19.613 | -20,71 | 2.608 | -15,93 | ||||
| 2026-02-13 | 13F | Pinnacle Wealth Planning Services, Inc. | 68 | 9 | ||||||
| 2026-03-03 | 13F/A | Caitong International Asset Management Co., Ltd | 235 | 31 | ||||||
| 2026-02-06 | 13F | Tortoise Investment Management, LLC | 0 | -100,00 | 0 | |||||
| 2026-02-13 | 13F | Fieldview Capital Management, LLC | 10.523 | 1.399 | ||||||
| 2026-02-13 | 13F | Edgestream Partners, L.P. | 34.290 | 228,45 | 4.559 | 248,55 | ||||
| 2026-02-13 | 13F | Sei Investments Co | 13.004 | -1,59 | 1.729 | 4,41 | ||||
| 2026-02-17 | 13F | Empyrean Capital Partners, LP | 231.000 | 0,00 | 30.714 | 6,05 | ||||
| 2026-02-13 | 13F | Bragg Financial Advisors, Inc | 212.618 | 3,21 | 28.270 | 9,45 | ||||
| 2026-02-17 | 13F | Aqr Capital Management Llc | 24.449 | 21,17 | 3.251 | 28,51 | ||||
| 2026-01-16 | 13F | Ronald Blue Trust, Inc. | 2.326 | 0,00 | 309 | 6,19 | ||||
| 2026-01-16 | 13F | DiNuzzo Private Wealth, Inc. | 6 | 0,00 | 1 | |||||
| 2026-02-17 | 13F | Advisor Group Holdings, Inc. | 155 | -58,89 | 21 | -58,33 | ||||
| 2026-02-12 | 13F | Swiss National Bank | 27.700 | 1,09 | 3.683 | 7,19 | ||||
| 2025-11-06 | 13F | Ameritas Advisory Services, LLC | 0 | -100,00 | 0 | -100,00 | ||||
| 2026-02-06 | 13F | Pnc Financial Services Group, Inc. | 31 | -8,82 | 4 | 0,00 | ||||
| 2025-10-30 | 13F | Twin Peaks Wealth Advisors, LLC | 0 | -100,00 | 0 | |||||
| 2026-02-13 | 13F | Change Path, LLC | 4.104 | -7,65 | 546 | -2,15 | ||||
| 2026-02-13 | 13F | Quarry LP | 0 | -100,00 | 0 | |||||
| 2026-02-12 | 13F | Proficio Capital Partners LLC | 4.440 | 0,00 | 590 | 6,12 | ||||
| 2026-01-30 | 13F | Torren Management, LLC | 87 | 12 | ||||||
| 2026-01-30 | 13F | CFC Planning Co LLC | 0 | -100,00 | 0 | |||||
| 2026-02-02 | 13F | Bay Harbor Wealth Management, LLC | 3 | 0,00 | 0 | |||||
| 2026-02-06 | 13F | Prescott Group Capital Management, L.l.c. | 17.203 | 0,00 | 2.287 | 6,08 | ||||
| 2026-02-13 | 13F | Verition Fund Management LLC | 1.600 | -23,70 | 213 | -19,08 | ||||
| 2026-02-13 | 13F | Smartleaf Asset Management LLC | 368 | 0,00 | 49 | 6,52 | ||||
| 2026-02-13 | 13F | Wells Fargo & Company/mn | 13.188 | 25,19 | 1.753 | 32,80 | ||||
| 2026-02-02 | 13F | Danske Bank A/s | 100 | 13 | ||||||
| 2026-02-17 | 13F | D. E. Shaw & Co., Inc. | 66.004 | 3,84 | 8.776 | 10,11 | ||||
| 2026-02-17 | 13F | Tudor Investment Corp Et Al | 23.209 | 3.086 | ||||||
| 2026-01-29 | 13F | D.a. Davidson & Co. | 24.059 | 4,16 | 3.199 | 10,43 | ||||
| 2026-02-13 | 13F | American Century Companies Inc | 264.275 | 43,38 | 35.138 | 52,05 | ||||
| 2026-02-10 | 13F | Rothschild Investment Llc | 32 | 52,38 | 4 | 100,00 | ||||
| 2026-01-07 | 13F | Massmutual Trust Co Fsb/adv | 26 | 0,00 | 3 | 0,00 | ||||
| 2026-01-20 | 13F | Signaturefd, Llc | 72 | 213,04 | 10 | 350,00 | ||||
| 2026-02-03 | 13F | Pilgrim Partners Asia Pte Ltd | 12.000 | 0,00 | 1.596 | 6,05 | ||||
| 2026-01-23 | 13F | TFC Financial Management | 1 | 0,00 | 0 | |||||
| 2026-02-02 | 13F | Qrg Capital Management, Inc. | 7.074 | 7,56 | 941 | 14,08 | ||||
| 2026-02-17 | 13F | Lighthouse Investment Partners, LLC | 2.148 | 286 | ||||||
| 2026-02-13 | 13F | Police & Firemen's Retirement System of New Jersey | 2.849 | -22,87 | 379 | -18,36 | ||||
| 2026-02-03 | 13F | Magnolia Group, Llc | 1.668.976 | 0,00 | 221.907 | 6,05 | ||||
| 2026-02-12 | 13F | Wealthspire Advisors, LLC | 0 | -100,00 | 0 | |||||
| 2026-02-05 | 13F | Allworth Financial LP | 1.034 | 0,39 | 137 | 6,20 | ||||
| 2025-10-24 | 13F | Hemington Wealth Management | 149 | 2,76 | 0 | |||||
| 2026-02-10 | 13F | Anchor Capital Advisors Llc | 14.041 | 7,70 | 1.867 | 14,20 | ||||
| 2026-01-22 | 13F | Charter Trust Co | 110.223 | -0,34 | 14.655 | 5,69 | ||||
| 2025-10-24 | 13F | MorganRosel Wealth Management, LLC | 0 | -100,00 | 0 | |||||
| 2026-02-11 | 13F | Deutsche Bank Ag\ | 8.423 | -23,51 | 1.120 | -18,91 | ||||
| 2026-02-17 | 13F | Alliancebernstein L.p. | 15.189 | -20,72 | 2.020 | -15,95 | ||||
| 2026-02-17 | 13F | Russell Investments Group, Ltd. | 3.739 | -6,15 | 497 | -0,40 | ||||
| 2026-02-06 | 13F | Gsa Capital Partners Llp | 4.834 | 1 | ||||||
| 2026-02-06 | 13F | Covestor Ltd | 67 | 0,00 | 0 | |||||
| 2026-02-13 | 13F | Macquarie Group Ltd | 0 | -100,00 | 0 | |||||
| 2026-02-17 | 13F | Tower Research Capital LLC (TRC) | 1.041 | 23,78 | 138 | 31,43 | ||||
| 2026-02-17 | 13F | Ancora Advisors, LLC | 1.034 | 0,00 | 137 | 6,20 | ||||
| 2026-01-27 | 13F | Zurcher Kantonalbank (Zurich Cantonalbank) | 2.447 | -1,41 | 325 | 4,50 | ||||
| 2026-02-17 | 13F | Dark Forest Capital Management Lp | 2.543 | -50,09 | 338 | -47,02 | ||||
| 2026-02-17 | 13F | Millennium Management Llc | 25.252 | -9,79 | 3.358 | -4,33 | ||||
| 2026-02-17 | 13F | Quantinno Capital Management LP | 4.351 | 16,68 | 579 | 23,77 | ||||
| 2025-11-07 | 13F | Shell Asset Management Co | 572 | -60,42 | 0 | |||||
| 2026-01-14 | 13F | Wedge Capital Management L L P/nc | 8.742 | 0,94 | 1.162 | 7,10 | ||||
| 2026-02-13 | 13F | BNP Paribas Asset Management Holding S.A. | 65 | 30,00 | 0 | |||||
| 2026-01-21 | 13F | Newbridge Financial Services Group, Inc. | 375 | 0,00 | 50 | 4,26 | ||||
| 2026-02-12 | 13F | BlackRock, Inc. | 925.076 | -7,46 | 122.998 | -1,87 | ||||
| 2026-02-10 | 13F | Bnp Paribas Arbitrage, Sa | 4.419 | 35,22 | 588 | 43,52 | ||||
| 2026-02-12 | 13F | Nuveen, LLC | 25.993 | -7,57 | 3.456 | -1,96 | ||||
| 2026-02-11 | 13F | Prestige Wealth Management Group LLC | 42 | 0,00 | 6 | 0,00 | ||||
| 2026-01-13 | 13F | Gillespie Robinson & Grimm Inc | 4.804 | 0,00 | 639 | 5,98 | ||||
| 2026-01-29 | 13F | UBS Group AG | 132.408 | -30,97 | 17.605 | -26,81 | ||||
| 2026-02-17 | 13F | Price T Rowe Associates Inc /md/ | 9.624 | -16,17 | 1 | 0,00 | ||||
| 2026-02-13 | 13F | Ieq Capital, Llc | 1.990 | 265 | ||||||
| 2026-02-17 | 13F | Advisory Services Network, LLC | 0 | -100,00 | 0 | |||||
| 2026-02-13 | 13F | Security National Bank Of Sioux City Iowa /ia/ | 2.100 | 0,00 | 279 | 6,08 | ||||
| 2025-11-13 | 13F | Arrowstreet Capital, Limited Partnership | 0 | -100,00 | 0 | |||||
| 2026-02-17 | 13F | Philadelphia Financial Management of San Francisco, LLC | 46.910 | 6.237 | ||||||
| 2026-02-13 | 13F | Prudential Financial Inc | 0 | -100,00 | 0 | |||||
| 2026-01-14 | 13F | Jfs Wealth Advisors, Llc | 33 | 37,50 | 4 | 33,33 | ||||
| 2026-01-23 | 13F | Ogorek Anthony Joseph /ny/ /adv | 139 | 0,00 | 0 | |||||
| 2026-02-17 | 13F | Mercer Global Advisors Inc /adv | 1.581 | 210 | ||||||
| 2026-02-17 | 13F | Royal Bank Of Canada | 3.021 | 10,62 | 401 | 17,25 | ||||
| 2026-01-29 | 13F | Vanguard Group Inc | 1.317.538 | -14,78 | 175.180 | -9,63 | ||||
| 2026-02-13 | 13F | Citigroup Inc | 5.457 | -0,46 | 726 | 5,53 | ||||
| 2026-02-11 | 13F | LPL Financial LLC | 32.625 | 1,89 | 4.338 | 8,05 | ||||
| 2026-02-10 | 13F | Bank of New York Mellon Corp | 75.169 | -17,01 | 9.995 | -11,99 | ||||
| 2026-02-06 | 13F | IFP Advisors, Inc | 89 | 286,96 | 12 | 450,00 | ||||
| 2026-02-13 | 13F | Victory Capital Management Inc | 8.929 | 378,25 | 1.187 | 407,26 | ||||
| 2026-02-12 | 13F | Dimensional Fund Advisors Lp | 1.848.962 | -2,00 | 245.839 | 3,92 | ||||
| 2026-02-13 | 13F | First Trust Advisors Lp | 17.182 | 73,59 | 2.285 | 84,05 | ||||
| 2026-02-17 | 13F | Susquehanna Fundamental Investments, Llc | 14.375 | 415,05 | 1.911 | 447,56 | ||||
| 2026-01-09 | 13F | SG Americas Securities, LLC | 11.992 | 2 | ||||||
| 2026-02-13 | 13F | Caxton Associates Llp | 0 | -100,00 | 0 | |||||
| 2026-01-08 | 13F | Wealth Enhancement Advisory Services, Llc | 797 | 19,31 | 109 | 25,58 | ||||
| 2026-02-10 | 13F | Envestnet Asset Management Inc | 3.568 | -7,52 | 474 | -1,86 | ||||
| 2026-02-13 | 13F | Aigen Investment Management, Lp | 2.708 | 360 | ||||||
| 2026-02-17 | 13F | Public Employees Retirement System Of Ohio | 194 | -8,92 | 26 | -3,85 | ||||
| 2026-02-17 | 13F | Engineers Gate Manager LP | 2.691 | 358 | ||||||
| 2025-11-14 | 13F | Zacks Investment Management | 0 | -100,00 | 0 | |||||
| 2026-02-13 | 13F | Mml Investors Services, Llc | 4.136 | 9,88 | 550 | 16,56 | ||||
| 2026-02-17 | 13F | Optiver Holding B.V. | 24 | -73,33 | 3 | -72,73 | ||||
| 2026-02-09 | 13F | Keating Financial Advisory Services, Inc. | 19 | 3 | ||||||
| 2025-11-12 | 13F | Western Standard LLC | 0 | -100,00 | 0 | |||||
| 2025-11-12 | 13F | Mach-1 Financial Group, Inc. | 0 | -100,00 | 0 | |||||
| 2025-11-13 | 13F | Mackenzie Financial Corp | 0 | -100,00 | 0 | |||||
| 2026-02-03 | 13F | Denali Advisors Llc | 44.600 | 14,36 | 5.930 | 21,29 | ||||
| 2026-02-17 | 13F | Lazard Asset Management Llc | 11.027 | 1.466 | ||||||
| 2026-02-17 | 13F | California State Teachers Retirement System | 13.250 | 1,98 | 1.762 | 8,10 | ||||
| 2026-02-04 | 13F | Dogwood Wealth Management LLC | 24 | 0,00 | 3 | 0,00 | ||||
| 2026-02-13 | 13F | Kestra Advisory Services, LLC | 691 | 92 | ||||||
| 2026-01-22 | 13F | Maseco Llp | 334 | 0,00 | 44 | 7,32 | ||||
| 2026-02-11 | 13F | BI Asset Management Fondsmaeglerselskab A/S | 0 | -100,00 | 0 | |||||
| 2026-02-13 | 13F | Great West Life Assurance Co /can/ | 1.509 | 0,00 | 0 | |||||
| 2026-02-12 | 13F | Principal Securities, Inc. | 0 | -100,00 | 0 | |||||
| 2026-02-10 | 13F | Axq Capital, Lp | 2.619 | 5,05 | 348 | 11,54 | ||||
| 2026-01-30 | 13F | Us Bancorp \de\ | 501 | 138,57 | 67 | 153,85 | ||||
| 2026-02-11 | 13F | Vestcor Inc | 1.040 | 0,00 | 0 | |||||
| 2026-02-13 | 13F | General American Investors Co Inc | 243.415 | 0,00 | 32.364 | 6,05 | ||||
| 2026-02-09 | 13F | Legal & General Group Plc | 14.105 | -1,19 | 1.875 | 4,81 | ||||
| 2026-02-17 | 13F | Dauntless Investment Group, LLC | 0 | -100,00 | 0 | |||||
| 2026-01-16 | 13F | Marquette Asset Management, LLC | 8 | 1 | ||||||
| 2026-02-13 | 13F | Sterling Capital Management LLC | 645 | -27,77 | 86 | -23,42 | ||||
| 2026-02-12 | 13F | RMR Capital Management, LLC | 4.613 | -3,15 | 613 | 2,68 | ||||
| 2026-02-10 | 13F | Acadian Asset Management Llc | 5.158 | 15,81 | 1 | |||||
| 2026-02-17 | 13F | Aquatic Capital Management LLC | 0 | -100,00 | 0 | |||||
| 2026-01-06 | 13F | Asset Value Investors Ltd | 6.370 | -23,07 | 847 | -18,50 | ||||
| 2025-10-15 | 13F | Financial Management Professionals, Inc. | 0 | -100,00 | 0 | |||||
| 2026-02-06 | 13F | EverSource Wealth Advisors, LLC | 294 | -24,23 | 39 | -18,75 | ||||
| 2026-02-13 | 13F | Ubs Asset Management Americas Inc | 27.057 | -1,32 | 3.597 | 4,66 | ||||
| 2026-02-18 | 13F | GWM Advisors LLC | 8 | 1 | ||||||
| 2026-02-13 | 13F | Entropy Technologies, LP | 2.089 | -46,28 | 278 | -43,12 | ||||
| 2025-11-14 | 13F | Northwestern Mutual Wealth Management Co | 0 | -100,00 | 0 | |||||
| 2026-02-10 | 13F | Goldman Sachs Group Inc | 45.190 | -16,02 | 6.008 | -10,94 | ||||
| 2026-02-19 | 13F | Invesco Ltd. | 19.539 | -18,77 | 2.598 | -13,89 | ||||
| 2026-02-09 | 13F | Geode Capital Management, Llc | 314.823 | -6,70 | 41.867 | -1,05 | ||||
| 2026-02-06 | 13F | Handelsbanken Fonder AB | 5.151 | 18,39 | 1 | |||||
| 2026-02-05 | 13F | Amalgamated Bank | 352 | -15,79 | 0 | |||||
| 2026-02-13 | 13F | Y-Intercept (Hong Kong) Ltd | 21.647 | 2.878 | ||||||
| 2026-02-17 | 13F | MIRAE ASSET GLOBAL ETFS HOLDINGS Ltd. | 7.861 | -11,85 | 1.045 | -6,53 | ||||
| 2026-02-11 | 13F | Ameritas Investment Partners, Inc. | 908 | 121 | ||||||
| 2026-02-12 | 13F | New York State Common Retirement Fund | 15.509 | 7,63 | 2.062 | 14,17 | ||||
| 2026-02-09 | 13F | Hartland & Co., LLC | 0 | -100,00 | 0 | |||||
| 2026-02-11 | 13F | Brandywine Global Investment Management, LLC | 38.854 | -2,75 | 5.166 | 3,13 | ||||
| 2026-02-09 | 13F | Quest Partners LLC | 12.970 | 3.175,25 | 1.724 | 3.418,37 | ||||
| 2026-02-13 | 13F | Mariner, LLC | 2.351 | 313 | ||||||
| 2026-02-02 | 13F | Pittenger & Anderson Inc | 1.272 | 0,00 | 169 | 6,29 | ||||
| 2026-02-12 | 13F | Rossby Financial, LCC | 204 | 27 | ||||||
| 2026-01-26 | 13F | KBC Group NV | 747 | 0,00 | 0 | |||||
| 2026-02-13 | 13F | Bandera Partners LLC | 102.389 | 0,00 | 13.616 | 6,07 | ||||
| 2026-02-17 | 13F | CWM Advisors, LLC | 3.525 | -2,30 | 469 | 3,54 | ||||
| 2026-02-17 | 13F | Ameriprise Financial Inc | 2.707 | 0,45 | 360 | 6,53 | ||||
| 2025-11-04 | 13F | Allianz Asset Management GmbH | 0 | -100,00 | 0 | |||||
| 2026-02-13 | 13F | QVT Financial LP | 229.665 | 0,00 | 30.536 | 6,05 | ||||
| 2026-02-17 | 13F | Susquehanna Portfolio Strategies, LLC | 4.684 | 0,00 | 623 | 5,96 | ||||
| 2026-02-06 | 13F | ProShare Advisors LLC | 2.047 | -7,17 | 272 | -1,45 | ||||
| 2026-02-10 | 13F | Intech Investment Management Llc | 7.312 | -10,53 | 972 | -5,08 | ||||
| 2026-02-06 | 13F | Larson Financial Group LLC | 24 | 0,00 | 3 | 0,00 | ||||
| 2026-01-08 | 13F | NorthCrest Asset Manangement, LLC | 7.492 | 0,66 | 992 | 3,23 | ||||
| 2026-01-28 | 13F | Arizona State Retirement System | 3.910 | -6,50 | 520 | -0,95 | ||||
| 2026-02-13 | 13F | Polymer Capital Management (HK) LTD | 0 | -100,00 | 0 | |||||
| 2025-11-13 | 13F | Hsbc Holdings Plc | 0 | -100,00 | 0 | |||||
| 2026-02-13 | 13F | MAI Capital Management | 30 | 7,14 | 4 | 0,00 | ||||
| 2026-02-17 | 13F | Bank Of America Corp /de/ | 11.911 | -47,59 | 1.584 | -44,44 | ||||
| 2026-02-17 | 13F | Algert Global Llc | 23.434 | 0,00 | 3 | 50,00 | ||||
| 2026-01-22 | 13F | Pinnacle Bancorp, Inc. | 250 | 0,00 | 33 | 6,45 | ||||
| 2026-02-17 | 13F | Crawford Fund Management, LLC | 46.090 | 32,51 | 6.128 | 40,52 | ||||
| 2026-02-17 | 13F | Balyasny Asset Management Llc | 5.411 | -34,63 | 719 | -30,67 | ||||
| 2026-01-23 | 13F | Farther Finance Advisors, LLC | 209 | -77,65 | 28 | -76,92 | ||||
| 2026-02-17 | 13F | Susquehanna International Group, Llp | Put | 0 | -100,00 | 0 | -100,00 | |||
| 2026-01-28 | 13F | Teacher Retirement System Of Texas | 6.940 | -8,60 | 923 | -3,15 | ||||
| 2026-01-21 | 13F | SJS Investment Consulting Inc. | 12 | 0,00 | 2 | 0,00 | ||||
| 2026-01-29 | 13F | James Investment Research Inc | 20.758 | 0,00 | 2.760 | 6,03 | ||||
| 2026-02-12 | 13F | Hrt Financial Lp | 31.992 | 138,64 | 4 | 300,00 | ||||
| 2026-02-17 | 13F | Jones Financial Companies Lllp | 289 | 28,44 | 38 | 35,71 | ||||
| 2026-02-14 | 13F | Militia Capital Partners, LP | 9.000 | 1.197 | ||||||
| 2026-02-13 | 13F | Manufacturers Life Insurance Company, The | 0 | -100,00 | 0 | |||||
| 2026-01-08 | 13F | Versant Capital Management, Inc | 246 | 1,65 | 33 | 6,67 | ||||
| 2026-02-17 | 13F | Brevan Howard Capital Management LP | 1.680 | -73,12 | 223 | -71,52 | ||||
| 2026-01-29 | 13F | Concurrent Investment Advisors, LLC | 2.208 | 7,71 | 294 | 14,01 | ||||
| 2026-02-05 | 13F | HFM Investment Advisors, LLC | 3 | 0,00 | 0 | |||||
| 2026-02-11 | 13F | Rise Advisors, LLC | 0 | -100,00 | 0 | |||||
| 2026-02-17 | 13F | Jain Global LLC | 4.292 | 571 | ||||||
| 2026-02-13 | 13F | SRS Capital Advisors, Inc. | 2 | -99,14 | 0 | -100,00 | ||||
| 2025-11-14 | 13F | Raymond James Financial Inc | 0 | -100,00 | 0 | |||||
| 2026-02-17 | 13F | Jump Financial, LLC | 3.435 | 28,65 | 457 | 36,53 | ||||
| 2026-02-17 | 13F | Captrust Financial Advisors | 15.421 | -5,60 | 2.050 | 0,10 | ||||
| 2026-02-13 | 13F | Barclays Plc | 17.611 | -39,26 | 2.342 | -28,71 | ||||
| 2026-02-13 | 13F | State Street Corp | 298.264 | -7,85 | 39.657 | -2,27 | ||||
| 2026-02-17 | 13F | Kemnay Advisory Services Inc. | 99 | 13 | ||||||
| 2025-11-14 | 13F | XTX Topco Ltd | 0 | -100,00 | 0 | -100,00 | ||||
| 2026-02-12 | 13F | Jane Street Group, Llc | 69.711 | 115,08 | 9.269 | 128,11 | ||||
| 2026-01-12 | 13F | Rialto Wealth Management, LLC | 4 | 33,33 | 1 | |||||
| 2026-02-17 | 13F | Two Sigma Advisers, Lp | 4.500 | 45,16 | 598 | 54,12 | ||||
| 2026-02-17 | 13F | Trexquant Investment LP | 0 | -100,00 | 0 | |||||
| 2026-02-10 | 13F | State of Wyoming | 0 | -100,00 | 0 | |||||
| 2026-02-17 | 13F | Madison Avenue Partners, LP | 0 | -100,00 | 0 | |||||
| 2026-02-03 | 13F | Sequoia Financial Advisors, LLC | 1.534 | 204 | ||||||
| 2026-02-13 | 13F | Morgan Stanley | 66.795 | -13,74 | 8.881 | -8,52 | ||||
| 2026-02-17 | 13F | Fmr Llc | 2.316 | 135,37 | 308 | 149,59 | ||||
| 2026-02-13 | 13F | Charles Schwab Investment Management Inc | 154.775 | -7,60 | 20.579 | -2,01 | ||||
| 2026-02-17 | 13F | Two Sigma Investments, Lp | 25.575 | 250,34 | 3.400 | 271,58 | ||||
| 2026-02-17 | 13F | Janus Henderson Group Plc | 6.007 | 0,00 | 798 | 5,98 | ||||
| 2025-11-07 | 13F | Readystate Asset Management Lp | 0 | -100,00 | 0 | |||||
| 2025-11-13 | 13F | Massachusetts Institute Of Technology | 0 | -100,00 | 0 | |||||
| 2026-02-03 | 13F | SBI Securities Co., Ltd. | 20 | 0,00 | 3 | 0,00 | ||||
| 2026-02-17 | 13F | Man Group plc | 0 | -100,00 | 0 | |||||
| 2026-01-08 | 13F | True Wealth Design, LLC | 6 | -14,29 | 1 | |||||
| 2026-02-17 | 13F | Citadel Advisors Llc | 30.987 | -38,02 | 4.120 | -34,27 | ||||
| 2026-02-04 | 13F | Swiss Life Asset Management Ltd | 1.890 | 251 | ||||||
| 2026-02-12 | 13F | Voya Investment Management Llc | 2.046 | -14,21 | 272 | -9,03 | ||||
| 2026-02-17 | 13F | State Of Wisconsin Investment Board | 4.506 | -7,93 | 599 | -2,28 | ||||
| 2026-02-17 | 13F | Qube Research & Technologies Ltd | 76.814 | -23,12 | 10.213 | -18,47 | ||||
| 2026-02-11 | 13F | Parallel Advisors, LLC | 169 | 1,20 | 22 | 10,00 | ||||
| 2026-02-17 | 13F | SageView Advisory Group, LLC | 24 | 3 | ||||||
| 2026-02-17 | 13F | Ameriflex Group, Inc. | 2 | -50,00 | 0 | |||||
| 2026-02-10 | 13F | Root Financial Partners, LLC | 116 | 13,73 | 15 | 25,00 | ||||
| 2026-01-29 | 13F | Pictet Asset Management Holding SA | 1.714 | 0,00 | 228 | 6,07 | ||||
| 2026-02-02 | 13F | Cornerstone Planning Group LLC | 110 | 0,00 | 14 | 0,00 | ||||
| 2026-02-13 | 13F | Colony Group, LLC | 2.814 | 374 | ||||||
| 2026-02-17 | 13F | Northern Trust Corp | 160.788 | -12,02 | 21.378 | -6,70 | ||||
| 2026-02-24 | 13F | Bell Investment Advisors, Inc | 12 | 0,00 | 2 | 0,00 | ||||
| 2026-02-17 | 13F | Abel Hall, LLC | 1.519 | 202 | ||||||
| 2026-01-28 | 13F | Klp Kapitalforvaltning As | 6.200 | 3,33 | 824 | 9,57 | ||||
| 2026-02-12 | 13F | Federation des caisses Desjardins du Quebec | 200 | 0,00 | 27 | 4,00 | ||||
| 2026-01-15 | 13F | Nisa Investment Advisors, Llc | 69 | -32,35 | 9 | -25,00 | ||||
| 2026-01-23 | 13F | Private Wealth Management Group, LLC | 24 | 0,00 | 3 | 0,00 | ||||
| 2026-02-13 | 13F | Neuberger Berman Group LLC | 3.380 | 449 | ||||||
| 2026-02-12 | 13F | Cloud Capital Management, LLC | 0 | -100,00 | 0 | |||||
| 2026-02-11 | 13F | Manchester Capital Management LLC | 23 | 3 | ||||||
| 2026-02-03 | 13F | Ballentine Partners, LLC | 1.578 | 210 | ||||||
| 2026-01-23 | 13F | State of Alaska, Department of Revenue | 1.113 | 4,02 | 0 | |||||
| 2026-02-13 | 13F | Sycale Advisors (NY) LLC | 152.441 | 3,45 | 20.269 | 9,70 | ||||
| 2026-02-09 | 13F | Jefferies Financial Group Inc. | 1.552 | 206 | ||||||
| 2026-02-17 | 13F | Creative Planning | 13.145 | 21,41 | 1.748 | 28,74 | ||||
| 2026-02-13 | 13F | Rhumbline Advisers | 22.865 | -17,25 | 3.040 | -12,24 | ||||
| 2026-01-26 | 13F | Cwm, Llc | 1.900 | 7,10 | 0 | |||||
| 2026-02-10 | 13F | Connor, Clark & Lunn Investment Management Ltd. | 15.039 | -31,83 | 2.000 | -27,73 | ||||
| 2026-02-09 | 13F | Harbour Investments, Inc. | 1 | 0,00 | 0 | |||||
| 2026-02-12 | 13F | Integrated Quantitative Investments LLC | 5.658 | 243,53 | 752 | 265,05 | ||||
| 2026-02-11 | 13F | Jpmorgan Chase & Co | 181.523 | -1,89 | 24.135 | 4,04 | ||||
| 2026-02-13 | 13F | Guardian Wealth Management, Inc. | 49.228 | -0,54 | 6.545 | 5,48 | ||||
| 2026-01-20 | 13F | Harbor Capital Advisors, Inc. | 437 | -1,58 | 0 | |||||
| 2026-01-15 | 13F | Fortitude Family Office, LLC | 10 | 0,00 | 1 | 0,00 | ||||
| 2026-02-06 | 13F | HighTower Advisors, LLC | 34.855 | -5,00 | 4.634 | 0,74 | ||||
| 2026-02-13 | 13F | Marshall Wace, Llp | 0 | -100,00 | 0 | |||||
| 2026-02-17 | 13F | Point72 Asset Management, L.P. | 11.810 | 1.570 | ||||||
| 2026-02-17 | 13F | First Manhattan Co | 21.763 | 2.894 | ||||||
| 2026-02-10 | 13F | Godfrey Financial Associates, Inc. | 1 | 0 | ||||||
| 2026-02-11 | 13F | Los Angeles Capital Management Llc | 458 | 59 | ||||||
| 2026-02-12 | 13F | Mission Creek Capital Partners, Inc. | 1.761 | 234 | ||||||
| 2026-02-17 | 13F | Susquehanna International Group, Llp | 24.190 | 68,11 | 3.216 | 78,27 | ||||
| 2026-02-03 | 13F | Farmers & Merchants Investments Inc | 1.184.351 | 0,09 | 157.471 | 6,14 | ||||
| 2026-02-14 | 13F | Rockefeller Capital Management L.P. | 109 | 354,17 | 14 | 366,67 | ||||
| 2025-11-12 | 13F | Aster Capital Management (DIFC) Ltd | 0 | -100,00 | 0 | |||||
| 2026-02-06 | 13F | Legato Capital Management LLC | 3.652 | 486 | ||||||
| 2026-02-12 | 13F | MetLife Investment Management, LLC | 6.185 | -17,21 | 822 | -12,18 | ||||
| 2026-01-05 | 13F | GAMMA Investing LLC | 292 | 1,39 | 39 | 5,56 |
Other Listings
| DE:NIJ | 110,00 € |