Grundlæggende statistik
| Institutionelle aktier (lange) | 33.360.107 - 68,84% (ex 13D/G) - change of -6,25MM shares -15,79% MRQ |
| Institutionel værdi (lang) | $ 2.424.784 USD ($1000) |
Institutionelt ejerskab og aktionærer
National Health Investors, Inc. (US:NHI) har 306 institutionelle ejere og aktionærer, der har indsendt 13D/G- eller 13F-formularer til Securities Exchange Commission (SEC). Disse institutioner har i alt 33,360,107 aktier. Største aktionærer omfatter Vanguard Group Inc, BlackRock, Inc., State Street Corp, Principal Financial Group Inc, Geode Capital Management, Llc, Prudential Financial Inc, Jpmorgan Chase & Co, Delaware Management Holdings, Inc., Bank Of America Corp /de/, and Charles Schwab Investment Management Inc .
National Health Investors, Inc. (NYSE:NHI) institutionel ejerskabsstruktur viser aktuelle positioner i virksomheden efter institutioner og fonde, samt seneste ændringer i positionsstørrelse. Større aktionærer kan omfatte individuelle investorer, investeringsforeninger, hedgefonde eller institutioner. Skema 13D angiver, at investoren besidder (eller besidder) mere end 5 % af virksomheden og har til hensigt (eller har til hensigt at) aktivt at forfølge en ændring i forretningsstrategi. Skema 13G indikerer en passiv investering på over 5%.
The share price as of April 24, 2026 is 77,00 / share. Previously, on April 28, 2025, the share price was 75,14 / share. This represents an increase of 2,48% over that period.

Fondens stemningsscore
Fund Sentiment Score (fka Ownership Accumulation Score) finder de aktier, der bliver mest købt af fonde. Det er resultatet af en sofistikeret, multi-faktor kvantitativ model, der identificerer virksomheder med de højeste niveauer af institutionel akkumulering. Scoringsmodellen bruger en kombination af den samlede stigning i oplyste ejere, ændringerne i porteføljeallokeringer i disse ejere og andre målinger. Tallet går fra 0 til 100, hvor højere tal indikerer et højere niveau af akkumulering for sine jævnaldrende, og 50 er gennemsnittet.
Opdateringsfrekvens: Dagligt
Se Ownership Explorer, som giver en liste over højest rangerende virksomheder.
AI+ Ask Fintel’s AI assistant about National Health Investors, Inc..
Select a question to share a public post with an AI-crafted answer.
Thinking of good questions…
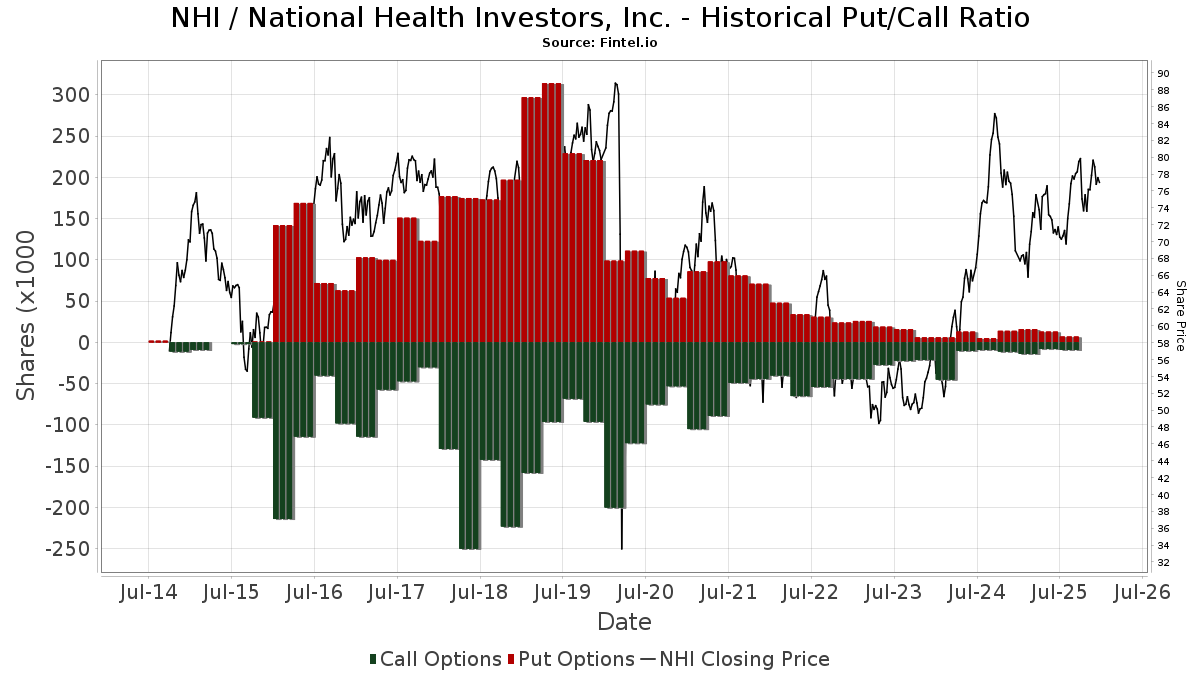
Institutionel Put/Call-forhold
Ud over at indberette standardaktie- og gældsudstedelser skal institutter med mere end 100 mill. aktiver under forvaltning også oplyse deres put- og call-optionsbeholdninger. Da salgsoptioner generelt indikerer negativ stemning, og købsoptioner indikerer positiv stemning, kan vi få en fornemmelse af den overordnede institutionelle stemning ved at plotte forholdet mellem put og kald. Diagrammet til højre viser det historiske put/call-forhold for dette instrument.
Brug af Put/Call Ratio som en indikator for investorernes stemning overvinder en af de vigtigste mangler ved at bruge totalt institutionelt ejerskab, som er, at en betydelig mængde af aktiver under forvaltning investeres passivt for at spore indekser. Passivt forvaltede fonde køber typisk ikke optioner, så indikatoren for put/call-forholdet følger mere nøje følelsen af aktivt forvaltede fonde.
13D/G-arkivering
Vi præsenterer 13D/G ansøgninger separat fra 13F ansøgninger på grund af den forskellige behandling af SEC. 13D/G-ansøgninger kan indgives af grupper af investorer (med én ledende), hvorimod 13F-ansøgninger ikke kan. Dette resulterer i situationer, hvor en investor kan indsende en 13D/G, der rapporterer én værdi for de samlede aktier (der repræsenterer alle de aktier, der ejes af investorgruppen), men derefter indsender en 13F, der rapporterer en anden værdi for de samlede aktier (der udelukkende repræsenterer deres egne) ejendomsret). Det betyder, at aktieejerskab af 13D/G-arkiver og 13F-arkiveringer ofte ikke er direkte sammenlignelige, så vi præsenterer dem separat.
Bemærk: Fra den 16. maj 2021 viser vi ikke længere ejere, der ikke har indsendt en 13D/G inden for det seneste år. Tidligere viste vi den fulde historie af 13D/G-arkiver. Generelt skal enheder, der er forpligtet til at indgive 13D/G-ansøgninger, indgive mindst årligt, før de indsender en afsluttende ansøgning. Dog forlader fonde nogle gange positioner uden at indsende en afsluttende ansøgning (dvs. de afvikler), så visning af den fulde historie resulterede nogle gange i forvirring om det nuværende ejerskab. For at undgå forvirring viser vi nu kun 'aktuelle' ejere - det vil sige - ejere, der har anmeldt inden for det seneste år.
Upgrade to unlock premium data.
| Fil dato | Form | Investor | Forrige Aktier |
Seneste Aktier |
Δ Aktier (Procent) |
Ejendomsret (Procent) |
Δ Ejerskab (Procent) |
|
|---|---|---|---|---|---|---|---|---|
| 2026-03-27 | VANGUARD GROUP INC | 6,146,344 | 0 | -100.00 | 0.00 | -100.00 |
13F og NPORT arkivering
Detaljer om 13F-arkivering er gratis. Detaljer om NP-ansøgninger kræver et premium-medlemskab. Grønne rækker angiver nye positioner. Røde rækker angiver lukkede positioner. Klik på linket ikon for at se den fulde transaktionshistorik.
Opgrader
for at låse premium-data op og eksportere til Excel ![]() .
.
| Fil dato | Kilde | Investor | Type | Gennemsnitlig pris (Øst) |
Aktier | Δ Aktier (%) |
Rapporteret Værdi ($1000) |
Δ Værdi (%) |
Port Alloc (%) |
|
|---|---|---|---|---|---|---|---|---|---|---|
| 2026-02-12 | 13F | Triumph Capital Management | 875 | 5,68 | 67 | 1,54 | ||||
| 2026-02-17 | 13F | Susquehanna International Group, Llp | 45.191 | -11,30 | 3.451 | -14,79 | ||||
| 2026-02-13 | 13F | Sei Investments Co | 28.290 | 4,98 | 2.160 | 0,84 | ||||
| 2025-11-19 | 13F | Caitong International Asset Management Co., Ltd | 0 | -100,00 | 0 | |||||
| 2026-02-13 | 13F | Martingale Asset Management L P | 9.618 | 0,00 | 735 | -3,93 | ||||
| 2026-01-27 | 13F | Asset Management One Co., Ltd. | 111.816 | -0,17 | 8.636 | -3,02 | ||||
| 2026-02-13 | 13F | Edgestream Partners, L.P. | 46.450 | 3.547 | ||||||
| 2026-02-13 | 13F | Baird Financial Group, Inc. | 5.603 | -2,56 | 428 | -6,56 | ||||
| 2026-01-26 | 13F | Cwm, Llc | 11.895 | -8,53 | 1 | -100,00 | ||||
| 2026-02-13 | 13F | Fieldview Capital Management, LLC | 24.874 | 1.900 | ||||||
| 2026-04-14 | 13F | Beacon Investment Advisory Services, Inc. | 1.400 | 113 | ||||||
| 2026-02-12 | 13F | Commonwealth Equity Services, Llc | 12.135 | -2,55 | 927 | |||||
| 2026-02-13 | 13F | Centiva Capital, LP | 0 | -100,00 | 0 | |||||
| 2026-02-13 | 13F | Verition Fund Management LLC | 0 | -100,00 | 0 | -100,00 | ||||
| 2026-04-22 | 13F | TBH Global Asset Management, LLC | 14.576 | -15,43 | 1.179 | -10,49 | ||||
| 2026-02-17 | 13F | Delaware Management Holdings, Inc. | 911.203 | 69.589 | ||||||
| 2025-11-14 | 13F | Bridgefront Capital, LLC | 0 | -100,00 | 0 | -100,00 | ||||
| 2025-12-18 | 13F | Danske Bank A/s | 0 | -100,00 | 0 | |||||
| 2026-02-06 | 13F | Bare Financial Services, Inc | 7 | -12,50 | 1 | |||||
| 2026-02-04 | 13F | Family Legacy, Inc. | 9.340 | 0,00 | 713 | -3,91 | ||||
| 2026-02-09 | 13F | Harbour Investments, Inc. | 170 | 0,00 | 13 | -7,69 | ||||
| 2026-02-13 | 13F | Smartleaf Asset Management LLC | 1.630 | 35,16 | 126 | 34,04 | ||||
| 2026-02-12 | 13F | Moneta Group Investment Advisors Llc | 0 | -100,00 | 0 | |||||
| 2026-02-17 | 13F | D. E. Shaw & Co., Inc. | 24.530 | -27,30 | 1.873 | -30,16 | ||||
| 2026-04-23 | 13F | CWM Advisors, LLC | 6.310 | 3,24 | 510 | 9,44 | ||||
| 2026-02-13 | 13F | Prudential Financial Inc | 1.002.773 | 36,26 | 76.582 | 30,90 | ||||
| 2026-02-13 | 13F | American Century Companies Inc | 21.069 | 2,72 | 1.609 | -1,29 | ||||
| 2026-02-13 | 13F | Marshall Wace, Llp | 249.949 | 19.089 | ||||||
| 2026-04-16 | 13F | Capital Advisors, Ltd. LLC | 6 | 0,00 | 0 | |||||
| 2026-02-12 | 13F | CIBC Private Wealth Group, LLC | 106 | 0,00 | 8 | 0,00 | ||||
| 2026-02-10 | 13F | Connor, Clark & Lunn Investment Management Ltd. | 0 | -100,00 | 0 | |||||
| 2026-01-20 | 13F | American National Bank | 0 | -100,00 | 0 | |||||
| 2026-02-12 | 13F | EntryPoint Capital, LLC | 2.669 | 0,00 | 204 | -4,25 | ||||
| 2026-02-13 | 13F | Parkside Financial Bank & Trust | 125 | 8,70 | 10 | 0,00 | ||||
| 2026-02-17 | 13F | Aqr Capital Management Llc | 34.642 | 43,23 | 2.646 | 37,62 | ||||
| 2026-02-17 | 13F | Advisory Services Network, LLC | 0 | -100,00 | 0 | |||||
| 2026-02-12 | 13F | Steward Partners Investment Advisory, Llc | 188 | 0,00 | 14 | 0,00 | ||||
| 2026-02-13 | 13F | S&t Bank/pa | 475 | 0,00 | 36 | -2,70 | ||||
| 2026-02-03 | 13F | NewEdge Wealth, LLC | 14.823 | 11,85 | 1.132 | 12,19 | ||||
| 2026-02-11 | 13F | Jpmorgan Chase & Co | 986.744 | -38,83 | 75.358 | -41,24 | ||||
| 2026-02-13 | 13F | Pinnacle Wealth Planning Services, Inc. | 91 | 7 | ||||||
| 2026-02-17 | 13F | Tudor Investment Corp Et Al | 95.878 | -17,75 | 7.322 | -20,99 | ||||
| 2026-04-20 | 13F | State of Alaska, Department of Revenue | 29.861 | 1,34 | 2 | 0,00 | ||||
| 2025-11-14 | 13F | Wolverine Trading, Llc | Put | 0 | -100,00 | 0 | ||||
| 2026-01-28 | 13F | Universal- Beteiligungs- und Servicegesellschaft mbH | 11.091 | 0,53 | 847 | -3,42 | ||||
| 2026-02-06 | 13F | Resona Asset Management Co.,Ltd. | 20.127 | -3,62 | 1.553 | -5,48 | ||||
| 2026-02-17 | 13F | Lighthouse Investment Partners, LLC | 84.600 | -34,87 | 6.461 | -37,45 | ||||
| 2026-02-04 | 13F | Biltmore Family Office, LLC | 7.041 | 544 | ||||||
| 2026-04-07 | 13F | Signaturefd, Llc | 588 | 154,55 | 48 | 176,47 | ||||
| 2026-02-13 | 13F | Wells Fargo & Company/mn | 92.457 | 12,36 | 7.061 | 7,93 | ||||
| 2026-02-17 | 13F | Nissay Asset Management Corp /japan/ /adv | 7.226 | 3,73 | 552 | -0,36 | ||||
| 2026-02-13 | 13F | Public Employees Retirement Association Of Colorado | 4.703 | 0,00 | 0 | |||||
| 2026-04-10 | 13F | Field & Main Bank | 1.000 | 0,00 | 81 | 5,26 | ||||
| 2026-02-11 | 13F | Hughes Financial Services, LLC | 1 | 0 | ||||||
| 2026-02-12 | 13F | Brown Brothers Harriman & Co | 24 | 0,00 | 2 | 0,00 | ||||
| 2026-04-16 | 13F | SG Americas Securities, LLC | 110.587 | 818,34 | 9 | |||||
| 2026-01-23 | 13F | Halbert Hargrove Global Advisors, Llc | 0 | -100,00 | 0 | |||||
| 2026-01-27 | 13F | Zurcher Kantonalbank (Zurich Cantonalbank) | 27.737 | 2,87 | 2.118 | -1,17 | ||||
| 2026-02-12 | 13F | BlackRock, Inc. | 4.833.389 | 3,05 | 369.126 | -1,01 | ||||
| 2026-04-20 | 13F | Hilton Head Capital Partners, LLC | 22 | 2 | ||||||
| 2026-02-17 | 13F | Capstone Investment Advisors, Llc | 0 | -100,00 | 0 | -100,00 | ||||
| 2026-02-17 | 13F | Quantinno Capital Management LP | 9.489 | 29,81 | 725 | 24,61 | ||||
| 2026-02-18 | 13F | Mackenzie Financial Corp | 3.164 | -1,16 | 245 | -3,94 | ||||
| 2026-02-13 | 13F | Beacon Capital Management, LLC | 0 | -100,00 | 0 | -100,00 | ||||
| 2026-01-21 | 13F | Woodmont Investment Counsel Llc | 103.817 | 7,82 | 7.929 | 3,58 | ||||
| 2026-02-10 | 13F | Bowen Hanes & Co Inc | 260.000 | 0,00 | 20 | -99,91 | ||||
| 2026-02-12 | 13F | UniSuper Management Pty Ltd | 9.700 | -25,95 | 741 | -28,91 | ||||
| 2026-02-17 | 13F | Guggenheim Capital Llc | 7.305 | -9,93 | 558 | -13,51 | ||||
| 2026-02-12 | 13F | Swiss National Bank | 93.620 | 3,42 | 7.150 | -0,65 | ||||
| 2026-02-06 | 13F | Pnc Financial Services Group, Inc. | 3.399 | -8,90 | 260 | -12,50 | ||||
| 2026-02-12 | 13F | Renaissance Technologies Llc | 0 | -100,00 | 0 | |||||
| 2026-04-24 | 13F | UMA Financial Services, Inc. | 23 | 0,00 | 2 | 0,00 | ||||
| 2026-01-07 | 13F | Sagespring Wealth Partners, Llc | 8.064 | 0,96 | 616 | -3,00 | ||||
| 2026-02-10 | 13F | Rothschild Investment Llc | 34 | 36,00 | 3 | 100,00 | ||||
| 2026-02-13 | 13F | BNP Paribas Asset Management Holding S.A. | 27.479 | -46,76 | 2 | -50,00 | ||||
| 2026-02-17 | 13F | Millennium Management Llc | 470.161 | -15,57 | 35.906 | -18,89 | ||||
| 2026-02-18 | 13F | GWM Advisors LLC | 0 | -100,00 | 0 | |||||
| 2026-02-10 | 13F | Daiwa Securities Group Inc. | 102.211 | 94,59 | 8 | 75,00 | ||||
| 2026-01-21 | 13F | Jefferson Bridge Capital, LLC | 45.799 | 3.498 | ||||||
| 2026-02-06 | 13F/A | CapWealth Advisors, LLC | 2.741 | 0,00 | 209 | -3,69 | ||||
| 2026-02-17 | 13F | Amundi | 23.641 | 2,21 | 1.805 | 1,12 | ||||
| 2026-02-13 | 13F | Mariner, LLC | 4.103 | 314 | ||||||
| 2026-02-12 | 13F | Jane Street Group, Llc | 0 | -100,00 | 0 | |||||
| 2026-02-09 | 13F | Keating Financial Advisory Services, Inc. | 17 | 1 | ||||||
| 2026-04-22 | 13F | Motco | 7 | 0,00 | 1 | |||||
| 2026-02-06 | 13F | Covestor Ltd | 954 | 492,55 | 0 | |||||
| 2026-02-11 | 13F | Deutsche Bank Ag\ | 125.980 | 3,05 | 9.621 | -1,01 | ||||
| 2026-02-13 | 13F | C M Bidwell & Associates Ltd | 939 | 1,62 | 72 | -2,74 | ||||
| 2026-04-15 | 13F | Exchange Traded Concepts, Llc | 287 | 23 | ||||||
| 2026-02-11 | 13F | Rise Advisors, LLC | 0 | -100,00 | 0 | |||||
| 2026-01-13 | 13F | Signal Advisors Wealth, LLC | 0 | -100,00 | 0 | |||||
| 2026-02-13 | 13F | Police & Firemen's Retirement System of New Jersey | 12.807 | 0,05 | 978 | -3,83 | ||||
| 2026-02-13 | 13F | Charles Schwab Investment Management Inc | 817.085 | 3,36 | 62.401 | -0,71 | ||||
| 2026-02-13 | 13F | Ieq Capital, Llc | 3.148 | 240 | ||||||
| 2026-04-23 | 13F | North Star Investment Management Corp. | 1.150 | 0,00 | 93 | 5,75 | ||||
| 2026-02-17 | 13F | Tower Research Capital LLC (TRC) | 1.285 | -58,52 | 98 | -60,16 | ||||
| 2026-02-17 | 13F | Susquehanna Fundamental Investments, Llc | 17.398 | -9,36 | 1.329 | -12,92 | ||||
| 2026-02-03 | 13F | International Assets Investment Management, Llc | 354 | 27 | ||||||
| 2026-01-27 | 13F | Shayne & Co., Llc | 3.100 | 0,00 | 237 | -4,07 | ||||
| 2026-02-12 | 13F | Dimensional Fund Advisors Lp | 668.085 | 2,29 | 51.024 | -1,73 | ||||
| 2026-04-24 | 13F | Sumitomo Mitsui DS Asset Management Company, Ltd | 10.851 | 0,00 | 877 | 5,92 | ||||
| 2026-04-20 | 13F | Ronald Blue Trust, Inc. | 44 | -80,00 | 4 | -81,25 | ||||
| 2026-02-13 | 13F | SRS Capital Advisors, Inc. | 63 | -89,62 | 5 | -91,67 | ||||
| 2026-02-17 | 13F | Alliancebernstein L.p. | 56.580 | 4,27 | 4.321 | 0,16 | ||||
| 2026-02-12 | 13F | Centersquare Investment Management Llc | 0 | -100,00 | 0 | |||||
| 2026-02-13 | 13F | First Trust Advisors Lp | 90.045 | 29,97 | 6.877 | 24,86 | ||||
| 2026-04-08 | 13F | Wealth Enhancement Advisory Services, Llc | 4.335 | -7,43 | 360 | 0,84 | ||||
| 2026-01-30 | 13F/A | M&t Bank Corp | 4.505 | 344 | ||||||
| 2026-02-12 | 13F | Ensign Peak Advisors, Inc | 3.802 | -59,13 | 290 | -60,76 | ||||
| 2026-02-12 | 13F | Nuveen, LLC | 111.642 | 13,28 | 8.526 | 8,83 | ||||
| 2026-02-17 | 13F | Mercer Global Advisors Inc /adv | 4.610 | 352 | ||||||
| 2026-04-15 | 13F | Albert D Mason Inc | 4.489 | -0,75 | 363 | 4,93 | ||||
| 2026-01-27 | 13F | TD Waterhouse Canada Inc. | 0 | -100,00 | 0 | |||||
| 2026-02-17 | 13F | Russell Investments Group, Ltd. | 13.386 | 1,97 | 1.022 | -2,01 | ||||
| 2026-02-13 | 13F | Victory Capital Management Inc | 18.724 | 15,95 | 1.430 | 11,38 | ||||
| 2026-02-10 | 13F | Bnp Paribas Arbitrage, Sa | 22.061 | 82,08 | 1.685 | 74,87 | ||||
| 2025-11-05 | 13F | SOUTH STATE Corp | 0 | -100,00 | 0 | |||||
| 2026-04-22 | 13F | Caldwell Trust Co | 633 | -63,47 | 51 | -61,36 | ||||
| 2026-02-12 | 13F | Bank Of Montreal /can/ | 3.300 | -1,70 | 252 | -5,26 | ||||
| 2026-02-05 | 13F | Allworth Financial LP | 516 | -0,96 | 39 | -4,88 | ||||
| 2026-02-06 | 13F | Larson Financial Group LLC | 46 | -72,62 | 4 | -76,92 | ||||
| 2026-02-06 | 13F | Tortoise Investment Management, LLC | 0 | -100,00 | 0 | |||||
| 2026-02-17 | 13F | Engineers Gate Manager LP | 20.648 | 2,62 | 1.577 | -1,44 | ||||
| 2026-02-17 | 13F | Public Employees Retirement System Of Ohio | 65.343 | -3,24 | 4.990 | -7,04 | ||||
| 2026-02-17 | 13F | Sophron Capital Management L.P. | 42.815 | 129,14 | 3.270 | 120,13 | ||||
| 2026-02-17 | 13F | Price T Rowe Associates Inc /md/ | 44.055 | 5,54 | 3 | 0,00 | ||||
| 2026-02-17 | 13F | California State Teachers Retirement System | 44.986 | 5,31 | 3.436 | 1,15 | ||||
| 2026-04-07 | 13F | Farther Finance Advisors, LLC | 959 | -2,14 | 78 | 5,41 | ||||
| 2026-01-28 | 13F | DekaBank Deutsche Girozentrale | 53.209 | 0,00 | 4 | -25,00 | ||||
| 2026-02-13 | 13F | JustInvest LLC | 5.436 | 5,12 | 415 | 0,97 | ||||
| 2026-02-10 | 13F | Envestnet Asset Management Inc | 11.581 | 9,96 | 884 | 5,62 | ||||
| 2026-04-13 | 13F | IFP Advisors, Inc | 10 | -16,67 | 1 | |||||
| 2026-02-13 | 13F | Brown Advisory Inc | 4.675 | 12,33 | 357 | 8,18 | ||||
| 2026-01-29 | 13F | Vanguard Group Inc | 6.496.852 | -0,02 | 496.165 | -3,96 | ||||
| 2026-02-11 | 13F | GW&K Investment Management, LLC | 280.792 | 21 | ||||||
| 2026-02-13 | 13F | Citigroup Inc | 64.879 | 22,79 | 4.955 | 17,95 | ||||
| 2025-11-14 | 13F | Susquehanna International Group, Llp | Put | 0 | -100,00 | 0 | -100,00 | |||
| 2026-02-04 | 13F | Bailard, Inc. | 10.500 | 802 | ||||||
| 2026-04-15 | 13F | Nepsis, Inc. | 41.490 | -2,62 | 3.355 | 3,10 | ||||
| 2026-04-24 | 13F | IFM Investors Pty Ltd | 7.630 | 617 | ||||||
| 2026-02-17 | 13F | Private Advisor Group, LLC | 15.163 | -0,11 | 1.158 | -4,06 | ||||
| 2026-02-05 | 13F | Amalgamated Bank | 1.477 | -2,12 | 0 | |||||
| 2026-02-12 | 13F | New York State Common Retirement Fund | 15.252 | 0,00 | 1.165 | -3,96 | ||||
| 2026-02-09 | 13F | Geode Capital Management, Llc | 1.262.657 | 1,46 | 96.443 | -2,53 | ||||
| 2026-02-17 | 13F | Freestone Grove Partners LP | 286.355 | 21.869 | ||||||
| 2026-02-17 | 13F | Royal Bank Of Canada | 11.479 | 172,98 | 878 | 162,87 | ||||
| 2026-02-13 | 13F | Ubs Asset Management Americas Inc | 234.075 | -0,98 | 17.876 | -4,87 | ||||
| 2026-02-02 | 13F | Principal Financial Group Inc | 1.668.006 | 1,89 | 127.386 | -2,12 | ||||
| 2026-02-09 | 13F | Quest Partners LLC | 1.838 | -52,37 | 140 | -54,25 | ||||
| 2026-02-11 | 13F | Simplex Trading, Llc | Put | 5.700 | 338,46 | 435 | ||||
| 2026-04-22 | 13F | Spire Wealth Management | 29 | 0,00 | 2 | 0,00 | ||||
| 2026-02-11 | 13F | Simplex Trading, Llc | Call | 500 | -50,00 | 38 | ||||
| 2026-02-13 | 13F | Umb Bank N A/mo | 65 | 51,16 | 5 | 33,33 | ||||
| 2026-01-23 | 13F | Sumitomo Mitsui Trust Holdings, Inc. | 52.461 | 1,75 | 4.006 | -2,24 | ||||
| 2026-02-11 | 13F | Inceptionr Llc | 0 | -100,00 | 0 | |||||
| 2026-04-09 | 13F | Central Valley Advisors, Llc | 5.181 | 0,00 | 419 | 5,82 | ||||
| 2026-02-17 | 13F | Adage Capital Partners Gp, L.l.c. | 260.000 | 19.856 | ||||||
| 2026-02-17 | 13F | Voloridge Investment Management, Llc | 76.629 | 1,64 | 5.852 | -2,35 | ||||
| 2025-11-12 | 13F | Lasalle Investment Management Securities Llc | 0 | -100,00 | 0 | -100,00 | ||||
| 2026-02-17 | 13F | Canada Pension Plan Investment Board | 18.800 | 1.436 | ||||||
| 2026-02-06 | 13F | Handelsbanken Fonder AB | 19.051 | 0,00 | 1 | 0,00 | ||||
| 2026-02-12 | 13F | Federation des caisses Desjardins du Quebec | 3.755 | 29,48 | 287 | 24,35 | ||||
| 2026-02-13 | 13F | Gts Securities Llc | 0 | -100,00 | 0 | |||||
| 2026-02-17 | 13F | Land & Buildings Investment Management, LLC | 413.133 | -5,22 | 31.551 | -8,95 | ||||
| 2026-02-18 | 13F | Garton & Associates Financial Advisors LLC | 428 | 33 | ||||||
| 2026-02-23 | 13F | Beaird Harris Wealth Management, LLC | 242 | 18 | ||||||
| 2026-01-22 | 13F | Harwood Advisory Group, LLC | 110 | 0,92 | 8 | 0,00 | ||||
| 2026-02-17 | 13F | MIRAE ASSET GLOBAL ETFS HOLDINGS Ltd. | 229.482 | 1,47 | 17.526 | -2,52 | ||||
| 2026-02-10 | 13F | Bank of New York Mellon Corp | 537.231 | -6,96 | 41.028 | -10,63 | ||||
| 2026-02-10 | 13F | Commonwealth Of Pennsylvania Public School Empls Retrmt Sys | 15.214 | 1,36 | 1.162 | -2,68 | ||||
| 2026-02-10 | 13F | Norges Bank | 724.125 | 55.301 | ||||||
| 2025-11-14 | 13F | ExodusPoint Capital Management, LP | 0 | -100,00 | 0 | |||||
| 2026-02-13 | 13F | Stifel Financial Corp | 5.781 | -0,89 | 442 | -4,75 | ||||
| 2026-02-13 | 13F | Y-Intercept (Hong Kong) Ltd | 30.712 | 2.345 | ||||||
| 2026-04-21 | 13F | GHP Investment Advisors, Inc. | 2 | 0 | ||||||
| 2026-02-11 | 13F | LPL Financial LLC | 31.750 | 5,55 | 2.425 | 1,38 | ||||
| 2026-01-29 | 13F | UBS Group AG | 197.518 | 3,67 | 15.084 | -0,42 | ||||
| 2026-02-13 | 13F | Transamerica Financial Advisors, Inc. | 6 | 0 | ||||||
| 2026-02-17 | 13F | Dark Forest Capital Management Lp | 9.016 | -74,36 | 689 | -75,38 | ||||
| 2025-11-14 | 13F | Skopos Labs, Inc. | 0 | -100,00 | 0 | |||||
| 2026-02-12 | 13F | State Board Of Administration Of Florida Retirement System | 10.800 | 0,00 | 825 | -3,96 | ||||
| 2026-04-22 | 13F | Janney Montgomery Scott LLC | 18.110 | -6,83 | 1 | 0,00 | ||||
| 2026-02-04 | 13F | Independent Advisor Alliance | 3.225 | 2,51 | 246 | -1,60 | ||||
| 2026-02-13 | 13F | Quarry LP | 53 | 4 | ||||||
| 2026-02-12 | 13F | Quadrant Capital Group Llc | 137 | 117,46 | 10 | 100,00 | ||||
| 2026-02-06 | 13F | Aviance Capital Partners, LLC | 5.114 | -9,25 | 391 | -12,75 | ||||
| 2026-02-24 | 13F | DGS Capital Management, LLC | 0 | -100,00 | 0 | |||||
| 2026-02-03 | 13F | Mitsubishi UFJ Kokusai Asset Management Co., Ltd. | 36.721 | 2,54 | 2.822 | -0,88 | ||||
| 2026-02-17 | 13F | Point72 Asset Management, L.P. | 0 | -100,00 | 0 | |||||
| 2026-02-10 | 13F | Goldman Sachs Group Inc | 170.686 | -15,13 | 13.035 | -18,47 | ||||
| 2026-02-13 | 13F | Great West Life Assurance Co /can/ | 83.208 | -5,87 | 6 | 0,00 | ||||
| 2026-02-13 | 13F | Entropy Technologies, LP | 0 | -100,00 | 0 | |||||
| 2026-04-02 | 13F | Ares Financial Consulting, LLC | 25 | 0,00 | 2 | 100,00 | ||||
| 2025-11-07 | 13F | Sierra Ocean, Llc | 0 | -100,00 | 0 | |||||
| 2026-02-14 | 13F | Rockefeller Capital Management L.P. | 1.022 | 80,57 | 78 | 77,27 | ||||
| 2026-02-13 | 13F | Truvestments Capital Llc | 0 | 0 | ||||||
| 2026-02-05 | 13F | Stephens Inc /ar/ | 8.773 | 0,63 | 670 | -3,32 | ||||
| 2026-02-11 | 13F | Ameritas Investment Partners, Inc. | 3.864 | 295 | ||||||
| 2026-04-17 | 13F | CENTRAL TRUST Co | 176 | 4,76 | 14 | 16,67 | ||||
| 2026-02-11 | 13F | Allianz Asset Management GmbH | 45.534 | -54,66 | 3.477 | -56,44 | ||||
| 2026-01-26 | 13F | Whittier Trust Co | 63 | 0,00 | 5 | 0,00 | ||||
| 2026-02-17 | 13F | Susquehanna Portfolio Strategies, LLC | 8.320 | -24,62 | 635 | -27,59 | ||||
| 2026-01-28 | 13F | Arizona State Retirement System | 13.243 | -4,16 | 1.011 | -7,92 | ||||
| 2026-02-12 | 13F | Principal Securities, Inc. | 0 | -100,00 | 0 | -100,00 | ||||
| 2026-01-26 | 13F | KBC Group NV | 1.561 | 0,00 | 0 | |||||
| 2026-02-12 | 13F | Xponance, Inc. | 3.723 | 2,45 | 284 | -1,39 | ||||
| 2026-02-13 | 13F | MAI Capital Management | 877 | 7,21 | 67 | 1,54 | ||||
| 2026-02-17 | 13F | Raymond James Financial Inc | 31.692 | 0,13 | 2.420 | -3,82 | ||||
| 2026-04-15 | 13F | Gf Fund Management Co. Ltd. | 718 | -8,77 | 58 | -3,33 | ||||
| 2026-02-11 | 13F | Picton Mahoney Asset Management | 13 | 0,00 | 1 | |||||
| 2026-02-04 | 13F | Virginia Retirement Systems Et Al | 49.800 | -42,82 | 3.803 | -45,08 | ||||
| 2026-02-19 | 13F | Invesco Ltd. | 88.140 | -12,36 | 6.731 | -15,81 | ||||
| 2026-02-11 | 13F | M Holdings Securities, Inc. | 531.179 | 2,79 | 41 | -2,44 | ||||
| 2026-04-01 | 13F | Pensionfund Sabic | 3.500 | 0,00 | 0 | |||||
| 2026-04-22 | 13F | Pictet Asset Management Holding SA | 7.331 | 9,75 | 593 | 16,08 | ||||
| 2026-02-17 | 13F | Boothbay Fund Management, Llc | 2.785 | 213 | ||||||
| 2026-02-13 | 13F | Morgan Stanley | 237.569 | 20,26 | 18.143 | 15,53 | ||||
| 2026-04-13 | 13F | Mather Group, Llc. | 26 | 2 | ||||||
| 2026-04-15 | 13F | NorthAvenue LLC | 70 | 0,00 | 6 | 0,00 | ||||
| 2026-01-30 | 13F | Us Bancorp \de\ | 1.862 | 180,84 | 142 | 173,08 | ||||
| 2026-02-17 | 13F | Brevan Howard Capital Management LP | 6.177 | -36,64 | 472 | -39,23 | ||||
| 2026-02-18 | 13F | Caitlin John, LLC | 82 | 1,23 | 6 | 0,00 | ||||
| 2026-02-03 | 13F | Bokf, Na | 4.351 | -0,50 | 332 | -4,32 | ||||
| 2026-02-17 | 13F | Schonfeld Strategic Advisors LLC | 0 | -100,00 | 0 | |||||
| 2026-02-12 | 13F | Hrt Financial Lp | 2.854 | -54,82 | 0 | |||||
| 2026-02-17 | 13F | Algert Global Llc | 8.510 | 22,98 | 1 | |||||
| 2026-01-29 | 13F | Schnieders Capital Management, Llc. | 9.053 | 0,00 | 691 | -3,89 | ||||
| 2026-02-09 | 13F | Legal & General Group Plc | 251.588 | 22,80 | 19.214 | 17,97 | ||||
| 2026-02-17 | 13F | Ameriprise Financial Inc | 39.933 | 0,38 | 3.051 | -3,57 | ||||
| 2026-02-10 | 13F | Acadian Asset Management Llc | 9.668 | 103,49 | 1 | |||||
| 2026-01-16 | 13F | Standard Life Aberdeen plc | 45.355 | 73,68 | 3.464 | 68,76 | ||||
| 2026-01-28 | 13F | Teacher Retirement System Of Texas | 3.091 | -52,79 | 236 | -54,62 | ||||
| 2026-01-21 | 13F | Sound Income Strategies, LLC | 256.898 | 6,48 | 20.595 | 15,64 | ||||
| 2026-02-14 | 13F | Militia Capital Partners, LP | 20.100 | 53,44 | 1.535 | 47,45 | ||||
| 2026-02-17 | 13F | Jones Financial Companies Lllp | 3.477 | 18,31 | 266 | 13,25 | ||||
| 2026-02-06 | 13F | EverSource Wealth Advisors, LLC | 466 | 21,04 | 36 | 16,67 | ||||
| 2026-02-12 | 13F | Campbell & CO Investment Adviser LLC | 5.393 | 32,15 | 412 | 26,85 | ||||
| 2026-01-28 | 13F | Oversea-Chinese Banking CORP Ltd | 53.168 | 59,78 | 4.060 | 53,50 | ||||
| 2026-02-18 | 13F/A | Pinnacle Financial Partners, Inc. | 56.627 | 4.325 | ||||||
| 2026-04-23 | 13F | SJS Investment Consulting Inc. | 2.101 | 0,00 | 170 | 5,63 | ||||
| 2026-01-26 | 13F | Mirae Asset Global Investments Co., Ltd. | 5.753 | 25,45 | 439 | 20,60 | ||||
| 2026-02-05 | 13F | Cambridge Investment Research Advisors, Inc. | 8.995 | 1,57 | 1 | |||||
| 2026-02-17 | 13F | Bank Of America Corp /de/ | 827.335 | 8,03 | 63.184 | 3,78 | ||||
| 2026-02-11 | 13F | Franklin Resources Inc | 38.933 | -24,09 | 2.973 | -27,08 | ||||
| 2026-02-17 | 13F | Jain Global LLC | 18.007 | 89,41 | 1.375 | 82,12 | ||||
| 2026-02-17 | 13F | Kemnay Advisory Services Inc. | 100 | 8 | ||||||
| 2026-04-06 | 13F | GAMMA Investing LLC | 529 | 14,75 | 43 | 20,00 | ||||
| 2025-11-14 | 13F | Cubist Systematic Strategies, LLC | 15.064 | -79,03 | 1.198 | -76,24 | ||||
| 2026-04-14 | 13F | Nbc Securities, Inc. | 77 | 6 | ||||||
| 2026-02-10 | 13F | Jupiter Asset Management Ltd | 22.262 | 0,00 | 1.700 | -3,90 | ||||
| 2026-02-17 | 13F | Two Sigma Advisers, Lp | 209.100 | -25,82 | 15.969 | -28,75 | ||||
| 2026-02-17 | 13F | Cambria Investment Management, L.P. | 8.194 | 0,05 | 626 | -3,99 | ||||
| 2026-02-17 | 13F | FIL Ltd | 1.339 | -31,09 | 102 | -33,77 | ||||
| 2026-02-17 | 13F | Optiver Holding B.V. | 0 | -100,00 | 0 | |||||
| 2026-02-13 | 13F | Van Eck Associates Corp | 12.595 | 11,64 | 1 | |||||
| 2026-02-17 | 13F | Balyasny Asset Management Llc | 131.772 | -67,77 | 10.063 | -69,04 | ||||
| 2025-11-12 | 13F | Simplex Trading, Llc | 0 | -100,00 | 0 | |||||
| 2026-01-21 | 13F | Flagship Harbor Advisors, Llc | 10 | 1 | ||||||
| 2026-02-05 | 13F | Thrivent Financial For Lutherans | 7.955 | -67,29 | 1 | -100,00 | ||||
| 2025-11-14 | 13F | Point72 Europe (London) LLP | 352 | 28 | ||||||
| 2026-04-08 | 13F | Ausbil Investment Management Ltd | 14.848 | 15,55 | 1.214 | 23,65 | ||||
| 2026-02-06 | 13F | ProShare Advisors LLC | 8.597 | 8,70 | 657 | 4,46 | ||||
| 2026-04-23 | 13F | Chelsea Counsel Co | 3.000 | 0,00 | 232 | 0,00 | ||||
| 2026-02-02 | 13F | Truist Financial Corp | 36.233 | 0,04 | 2.767 | -3,89 | ||||
| 2026-01-26 | 13F | Key Capital Management, INC | 621 | 47 | ||||||
| 2026-02-13 | 13F | Squarepoint Ops LLC | 10.479 | 800 | ||||||
| 2025-11-07 | 13F | Fifth Third Bancorp | 0 | -100,00 | 0 | |||||
| 2026-02-13 | 13F | Manufacturers Life Insurance Company, The | 0 | -100,00 | 0 | |||||
| 2025-10-28 | 13F | Pinnacle Financial Partners Inc | 50.252 | 0,00 | 3.995 | 13,40 | ||||
| 2026-04-01 | 13F | Pensionfund DSM Netherlands | 7.000 | 0,00 | 1 | |||||
| 2026-04-24 | 13F | Root Financial Partners, LLC | 104 | 8 | ||||||
| 2026-02-13 | 13F | Barclays Plc | 76.996 | 15,03 | 5.880 | 10,51 | ||||
| 2026-02-17 | 13F | Janus Henderson Group Plc | 19.509 | 0,00 | 1.489 | -4,00 | ||||
| 2026-02-17 | 13F | Fmr Llc | 5.038 | 13,88 | 385 | 9,40 | ||||
| 2025-11-12 | 13F | Elo Mutual Pension Insurance Co | 0 | -100,00 | 0 | |||||
| 2026-04-09 | 13F | Tompkins Financial Corp | 330 | 27 | ||||||
| 2026-02-17 | 13F | Captrust Financial Advisors | 8.907 | 1,67 | 680 | -2,30 | ||||
| 2026-04-13 | 13F | Trust Co | 3.969 | 0,00 | 321 | 5,61 | ||||
| 2026-04-17 | 13F | Bell Investment Advisors, Inc | 24 | 0,00 | 2 | 0,00 | ||||
| 2026-01-29 | 13F | Dunhill Financial, LLC | 2 | 0 | ||||||
| 2025-11-13 | 13F | Total Investment Management Inc | 0 | -100,00 | 0 | |||||
| 2026-02-11 | 13F | Metis Global Partners, LLC | 11.270 | 7,05 | 861 | 2,87 | ||||
| 2026-02-12 | 13F | Cibc World Markets Corp | 3.111 | -45,41 | 238 | -40,60 | ||||
| 2026-04-08 | 13F | Arlington Trust Co LLC | 3 | 0 | ||||||
| 2026-02-13 | 13F | State Street Corp | 1.997.410 | -0,90 | 154.333 | -4,76 | ||||
| 2026-02-10 | 13F | Intech Investment Management Llc | 23.028 | 0,00 | 1.759 | -3,93 | ||||
| 2026-02-17 | 13F | Jump Financial, LLC | 19.360 | 53,90 | 1.479 | 47,80 | ||||
| 2026-02-18 | 13F | EP Wealth Advisors, Inc. | 4.592 | 0,20 | 351 | 9,03 | ||||
| 2026-02-09 | 13F | Jackson Creek Investment Advisors LLC | 22.750 | -7,17 | 2 | 0,00 | ||||
| 2026-02-17 | 13F | DV Trading LLC | 100 | 8 | ||||||
| 2026-02-17 | 13F | Two Sigma Investments, Lp | 246.537 | -19,27 | 18.828 | -22,45 | ||||
| 2026-02-17 | 13F | Northern Trust Corp | 550.430 | -4,90 | 42.036 | -8,64 | ||||
| 2026-01-12 | 13F | CVA Family Office, LLC | 49 | 0,00 | 4 | 0,00 | ||||
| 2026-02-12 | 13F | Voya Investment Management Llc | 8.366 | 0,00 | 639 | -4,06 | ||||
| 2026-01-28 | 13F | Klp Kapitalforvaltning As | 10.200 | 4,08 | 787 | 0,00 | ||||
| 2026-02-05 | 13F | Alexander Randolph Advisory Inc | 4.616 | 10,85 | 353 | 6,34 | ||||
| 2026-02-05 | 13F | Avantax Planning Partners, Inc. | 4.208 | 0,00 | 321 | -3,89 | ||||
| 2026-02-05 | 13F | Bessemer Group Inc | 35 | 0,00 | 0 | |||||
| 2026-04-06 | 13F | Versant Capital Management, Inc | 80 | 158,06 | 6 | 200,00 | ||||
| 2026-02-13 | 13F | Commerce Bank | 4.866 | -0,71 | 372 | -4,63 | ||||
| 2026-02-17 | 13F | Credit Agricole S A | 9.931 | 0,00 | 758 | -3,93 | ||||
| 2026-02-13 | 13F | Colony Group, LLC | 4.904 | 3,99 | 375 | 0,00 | ||||
| 2026-01-15 | 13F | Nisa Investment Advisors, Llc | 5.736 | -26,31 | 445 | -29,03 | ||||
| 2026-02-06 | 13F | Global Retirement Partners, LLC | 204 | 1.600,00 | 16 | |||||
| 2026-04-15 | 13F | Belleair Asset Management, LLC | 4.706 | 0,00 | 381 | 5,85 | ||||
| 2026-01-27 | 13F | Meritage Portfolio Management | 62.512 | 47,64 | 4.774 | 41,83 | ||||
| 2026-01-23 | 13F | Assetmark, Inc | 1.195 | 23,45 | 91 | 19,74 | ||||
| 2026-02-13 | 13F | Neuberger Berman Group LLC | 3.136 | -1,41 | 240 | -5,16 | ||||
| 2026-02-18 | 13F | Vident Advisory, LLC | 9.126 | -13,31 | 697 | -16,63 | ||||
| 2026-01-29 | 13F | Lee Danner & Bass Inc | 51.220 | -13,65 | 3.912 | -17,05 | ||||
| 2026-02-13 | 13F | Macquarie Group Ltd | 49.113 | -94,98 | 3.751 | -95,18 | ||||
| 2026-02-13 | 13F | Cornerstone Financial Management LLC | 16 | 1 | ||||||
| 2026-02-04 | 13F | Versor Investments LP | 0 | -100,00 | 0 | |||||
| 2026-01-30 | 13F | State of New Jersey Common Pension Fund D | 27.521 | 0,00 | 2.102 | -3,93 | ||||
| 2026-02-17 | 13F | State Of Wisconsin Investment Board | 46.161 | 0,98 | 3.525 | -3,00 | ||||
| 2026-02-17 | 13F | Qube Research & Technologies Ltd | 232.270 | -12,70 | 17.738 | -16,13 | ||||
| 2026-02-11 | 13F | Vestcor Inc | 0 | -100,00 | 0 | -100,00 | ||||
| 2026-02-11 | 13F | Renaissance Group Llc | 3.206 | 3,79 | 245 | -0,41 | ||||
| 2026-02-13 | 13F | Morgan Stanley Institutional Investment Advisors LLC | 77.029 | 5.883 | ||||||
| 2026-03-26 | 13F | Leonteq Securities AG | 0 | -100,00 | 0 | |||||
| 2026-02-13 | 13F | Kestra Advisory Services, LLC | 0 | -100,00 | 0 | |||||
| 2026-02-17 | 13F | Citadel Advisors Llc | Call | 12.900 | 44,94 | 985 | 39,32 | |||
| 2025-11-12 | 13F | Headlands Technologies LLC | 0 | -100,00 | 0 | |||||
| 2026-02-17 | 13F | Citadel Advisors Llc | 36.418 | 199,24 | 2.781 | 187,59 | ||||
| 2026-04-13 | 13F | True Wealth Design, LLC | 1 | -75,00 | 0 | |||||
| 2026-02-10 | 13F | Quantbot Technologies LP | 7.681 | -47,75 | 587 | -49,83 | ||||
| 2025-11-21 | 13F/A | CIBC Bancorp USA Inc. | 4.930 | 392 | ||||||
| 2026-02-11 | 13F | Manchester Capital Management LLC | 7 | 1 | ||||||
| 2026-02-02 | 13F | Equitable Trust Co | 3.310 | 0,00 | 253 | -4,18 | ||||
| 2026-02-12 | 13F | Brinker Capital Investments, LLC | 2.775 | 212 | ||||||
| 2026-04-22 | 13F | Sterling Capital Management LLC | 1.280 | -40,93 | 104 | -37,58 | ||||
| 2026-02-10 | 13F | Nomura Asset Management Co Ltd | 70.810 | 2,11 | 5.408 | -1,92 | ||||
| 2026-04-24 | 13F | Strs Ohio | 76.700 | -31,76 | 6.202 | -27,75 | ||||
| 2026-02-13 | 13F | Toroso Investments, LLC | 3.052 | -4,98 | 233 | -8,63 | ||||
| 2026-01-20 | 13F | Harbor Capital Advisors, Inc. | 140 | -1,41 | 0 | |||||
| 2026-02-17 | 13F | Creative Planning | 12.001 | 3,21 | 916 | -0,87 | ||||
| 2026-02-09 | 13F | Hartland & Co., LLC | 0 | -100,00 | 0 | |||||
| 2026-02-13 | 13F | Dynamic Technology Lab Private Ltd | 4.023 | 307 | ||||||
| 2025-11-07 | 13F | Alberta Investment Management Corp | 0 | -100,00 | 0 | |||||
| 2026-02-12 | 13F | Loomis Sayles & Co L P | 357 | 32,71 | 27 | 28,57 | ||||
| 2026-02-17 | 13F | Citadel Advisors Llc | Put | 5.900 | 1,72 | 451 | -2,39 | |||
| 2026-02-17 | 13F | Cetera Investment Advisers | 10.790 | 0,01 | 824 | -3,85 | ||||
| 2026-03-02 | 13F | Reflection Asset Management | 130 | 10 | ||||||
| 2026-01-26 | 13F | Roman Butler Fullerton & Co | 7.001 | 0,30 | 552 | 7,41 | ||||
| 2026-02-13 | 13F | Schroder Investment Management Group | 28.721 | 1,57 | 2.202 | 0,23 | ||||
| 2026-02-17 | 13F | Clayton Partners LLC | 55.456 | 14,42 | 4.235 | 9,91 | ||||
| 2026-02-12 | 13F | MetLife Investment Management, LLC | 212.485 | 9,94 | 16.227 | 5,62 | ||||
| 2026-02-10 | 13F | Godfrey Financial Associates, Inc. | 2 | 0 | ||||||
| 2026-02-17 | 13F | Advisor Group Holdings, Inc. | 33.376 | 50,46 | 2.549 | 46,66 | ||||
| 2026-02-10 | 13F | Easterly Investment Partners Llc | 0 | -100,00 | 0 | |||||
| 2026-02-17 | 13F | Wiley Bros.-aintree Capital, Llc | 3.496 | 1,78 | 267 | -2,56 | ||||
| 2025-11-14 | 13F | Graham Capital Management, L.P. | 0 | -100,00 | 0 | -100,00 | ||||
| 2025-11-13 | 13F | Benchmark Investment Advisors LLC | 5.000 | 0,00 | 398 | 7,59 | ||||
| 2026-01-23 | 13F | Optima Capital Llc | 23 | 2 | ||||||
| 2026-03-06 | 13F | Hsbc Holdings Plc | 75.426 | 20,72 | 5.760 | 15,97 | ||||
| 2026-02-11 | 13F | Parallel Advisors, LLC | 75 | 0,00 | 6 | 0,00 | ||||
| 2026-02-11 | 13F | Buckingham Strategic Partners | 0 | -100,00 | 0 | |||||
| 2026-02-18 | 13F | NFP Retirement, Inc. | 25.097 | 0,42 | 1.917 | -3,52 | ||||
| 2026-02-13 | 13F | Rhumbline Advisers | 68.548 | -11,90 | 5.235 | -15,38 | ||||
| 2025-11-14 | 13F | Point72 (DIFC) Ltd | 3.140 | 250 |
Other Listings
| DE:WX6 | 65,50 € |