Grundlæggende statistik
| Institutionelle ejere | 167 total, 163 long only, 0 short only, 4 long/short - change of 118,18% MRQ |
| Gennemsnitlig porteføljeallokering | 0.0766 % - change of -82,02% MRQ |
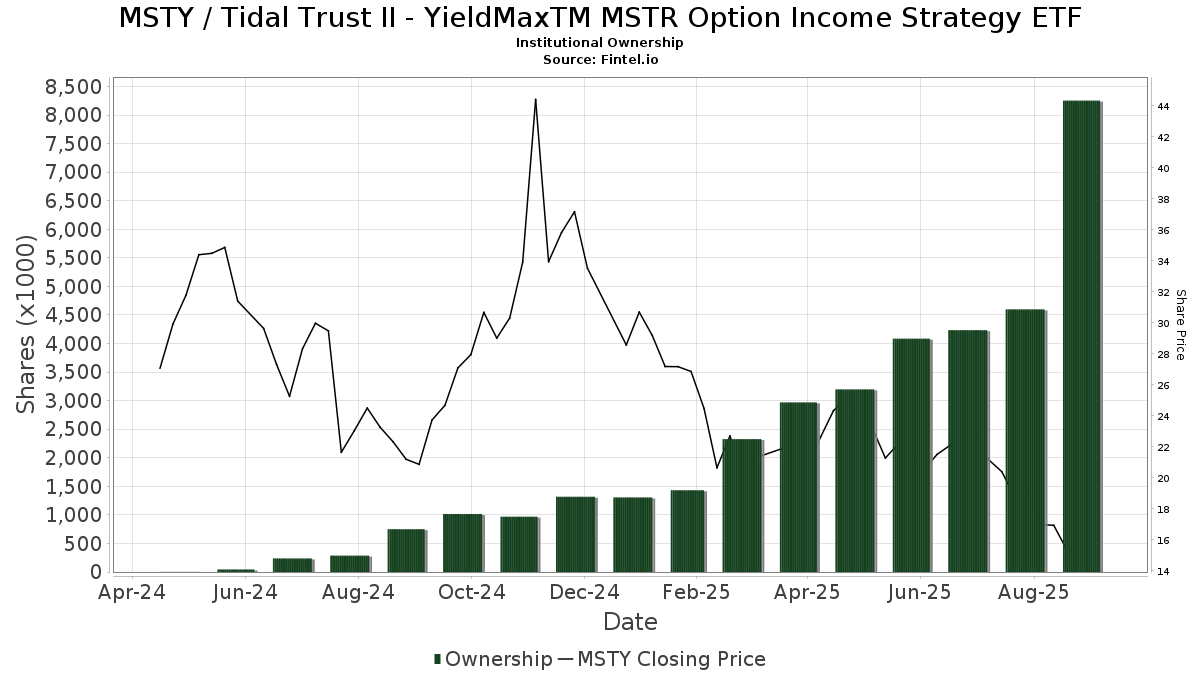
| Institutionelle aktier (lange) | 8.254.831 (ex 13D/G) - change of 4,23MM shares 105,25% MRQ |
| Institutionel værdi (lang) | $ 176.491 USD ($1000) |
Institutionelt ejerskab og aktionærer
Tidal Trust II - YieldMaxTM MSTR Option Income Strategy ETF (US:MSTY) har 167 institutionelle ejere og aktionærer, der har indsendt 13D/G- eller 13F-formularer til Securities Exchange Commission (SEC). Disse institutioner har i alt 8,254,831 aktier. Største aktionærer omfatter Toroso Investments, LLC, YMAX - YieldMaxTM Universe Fund of Option Income ETFs, Citadel Advisors Llc, Susquehanna International Group, Llp, Susquehanna International Group, Llp, Private Advisor Group, LLC, Jane Street Group, Llc, Citadel Advisors Llc, Jump Financial, LLC, and Jane Street Group, Llc .
Tidal Trust II - YieldMaxTM MSTR Option Income Strategy ETF (ARCA:MSTY) institutionel ejerskabsstruktur viser aktuelle positioner i virksomheden efter institutioner og fonde, samt seneste ændringer i positionsstørrelse. Større aktionærer kan omfatte individuelle investorer, investeringsforeninger, hedgefonde eller institutioner. Skema 13D angiver, at investoren besidder (eller besidder) mere end 5 % af virksomheden og har til hensigt (eller har til hensigt at) aktivt at forfølge en ændring i forretningsstrategi. Skema 13G indikerer en passiv investering på over 5%.
The share price as of September 8, 2025 is 15,47 / share. Previously, on September 9, 2024, the share price was 20,53 / share. This represents a decline of 24,65% over that period.
Fondens stemningsscore
Fund Sentiment Score (fka Ownership Accumulation Score) finder de aktier, der bliver mest købt af fonde. Det er resultatet af en sofistikeret, multi-faktor kvantitativ model, der identificerer virksomheder med de højeste niveauer af institutionel akkumulering. Scoringsmodellen bruger en kombination af den samlede stigning i oplyste ejere, ændringerne i porteføljeallokeringer i disse ejere og andre målinger. Tallet går fra 0 til 100, hvor højere tal indikerer et højere niveau af akkumulering for sine jævnaldrende, og 50 er gennemsnittet.
Opdateringsfrekvens: Dagligt
Se Ownership Explorer, som giver en liste over højest rangerende virksomheder.
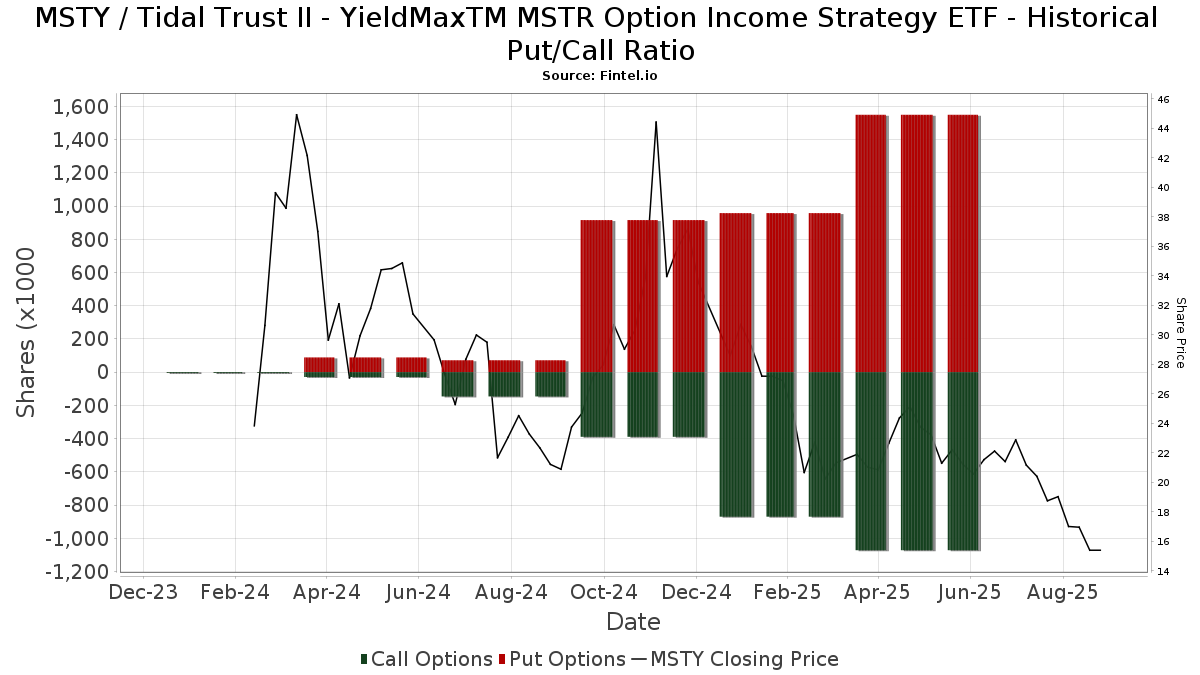
Institutionel Put/Call-forhold
Ud over at indberette standardaktie- og gældsudstedelser skal institutter med mere end 100 mill. aktiver under forvaltning også oplyse deres put- og call-optionsbeholdninger. Da salgsoptioner generelt indikerer negativ stemning, og købsoptioner indikerer positiv stemning, kan vi få en fornemmelse af den overordnede institutionelle stemning ved at plotte forholdet mellem put og kald. Diagrammet til højre viser det historiske put/call-forhold for dette instrument.
Brug af Put/Call Ratio som en indikator for investorernes stemning overvinder en af de vigtigste mangler ved at bruge totalt institutionelt ejerskab, som er, at en betydelig mængde af aktiver under forvaltning investeres passivt for at spore indekser. Passivt forvaltede fonde køber typisk ikke optioner, så indikatoren for put/call-forholdet følger mere nøje følelsen af aktivt forvaltede fonde.
13F og NPORT arkivering
Detaljer om 13F-arkivering er gratis. Detaljer om NP-ansøgninger kræver et premium-medlemskab. Grønne rækker angiver nye positioner. Røde rækker angiver lukkede positioner. Klik på linket ikon for at se den fulde transaktionshistorik.
Opgrader
for at låse premium-data op og eksportere til Excel ![]() .
.
| Fil dato | Kilde | Investor | Type | Gennemsnitlig pris (Øst) |
Aktier | Δ Aktier (%) |
Rapporteret Værdi ($1000) |
Δ Værdi (%) |
Port Alloc (%) |
|
|---|---|---|---|---|---|---|---|---|---|---|
| 2025-07-08 | 13F | Arlington Trust Co LLC | 220 | 5 | ||||||
| 2025-07-14 | 13F | Sowell Financial Services LLC | 11.794 | 261 | ||||||
| 2025-08-05 | 13F | Lifeworks Advisors, LLC | 38.025 | 126,66 | 843 | 147,21 | ||||
| 2025-08-06 | 13F | AE Wealth Management LLC | 7.550 | 5,59 | 167 | 15,17 | ||||
| 2025-04-28 | 13F | Strategic Financial Concepts, LLC | 0 | -100,00 | 0 | -100,00 | ||||
| 2025-08-11 | 13F | HighTower Advisors, LLC | 14.265 | 316 | ||||||
| 2025-08-12 | 13F | Proequities, Inc. | 0 | 0 | ||||||
| 2025-08-06 | 13F | ZEGA Investments, LLC | 17.435 | 36,37 | 387 | 49,03 | ||||
| 2025-08-13 | 13F | Natixis | 53.065 | 23,96 | 1.165 | 32,84 | ||||
| 2025-08-27 | 13F/A | Brinker Capital Investments, LLC | 65.718 | 1.457 | ||||||
| 2025-07-14 | 13F | AdvisorNet Financial, Inc | 3.774 | -41,10 | 84 | -36,15 | ||||
| 2025-08-01 | 13F | Belvedere Trading LLC | 4.982 | -79,86 | 110 | -78,09 | ||||
| 2025-08-01 | 13F | Belvedere Trading LLC | Call | 12.900 | 5,74 | 286 | 14,92 | |||
| 2025-08-01 | 13F | Belvedere Trading LLC | Put | 20.600 | -41,14 | 457 | -35,86 | |||
| 2025-08-12 | 13F | Aspiring Ventures, LLC | 154.150 | 3.418 | ||||||
| 2025-07-15 | 13F | Financial Partners Group, Inc | 27.073 | 600 | ||||||
| 2025-08-13 | 13F | Texas Capital Bank Wealth Management Services Inc | 42.952 | 952 | ||||||
| 2025-08-14 | 13F | Harwood Advisory Group, LLC | 40 | 1 | ||||||
| 2025-07-09 | 13F | Fiduciary Alliance LLC | 75.767 | 99,42 | 1.680 | 117,49 | ||||
| 2025-08-14 | 13F | TCG Advisory Services, LLC | 13.701 | 304 | ||||||
| 2025-07-10 | 13F | Signal Advisors Wealth, LLC | 68.742 | 1.524 | ||||||
| 2025-07-16 | 13F | Instrumental Wealth, Llc | 71.133 | 61,63 | 1.593 | 53,47 | ||||
| 2025-05-15 | 13F | Dimension Capital Management Llc | 0 | -100,00 | 0 | -100,00 | ||||
| 2025-07-16 | 13F | ORG Partners LLC | 8.872 | 191 | ||||||
| 2025-07-17 | 13F | Sound Income Strategies, LLC | 1.500 | 33 | ||||||
| 2025-07-16 | 13F | Strategic Investment Solutions, Inc. /IL | 139 | 3 | ||||||
| 2025-08-14 | 13F | Private Wealth Advisors, LLC | 12.124 | 269 | ||||||
| 2025-08-12 | 13F | Change Path, LLC | 16.359 | 363 | ||||||
| 2025-08-13 | 13F | StoneX Group Inc. | 101.726 | 369,24 | 2.255 | 412,50 | ||||
| 2025-08-14 | 13F | Toroso Investments, LLC | 1.432.831 | 26,46 | 31.766 | 37,90 | ||||
| 2025-07-25 | 13F | Cwm, Llc | 121 | -73,64 | 0 | |||||
| 2025-08-14 | 13F | Susquehanna International Group, Llp | Put | 581.400 | 131,08 | 12.890 | 151,98 | |||
| 2025-08-14 | 13F | Susquehanna International Group, Llp | 536.093 | 261,98 | 11.885 | 294,85 | ||||
| 2025-08-06 | 13F | Prospera Financial Services Inc | 44.514 | 987 | ||||||
| 2025-08-14 | 13F | Susquehanna International Group, Llp | Call | 88.200 | -16,00 | 1.955 | -8,39 | |||
| 2025-08-12 | 13F | MAI Capital Management | 1.000 | 0,00 | 22 | 10,00 | ||||
| 2025-07-16 | 13F | Kiley Juergens Wealth Management, Llc | 10.785 | 239 | ||||||
| 2025-08-08 | 13F | Foundations Investment Advisors, LLC | 9.092 | 202 | ||||||
| 2025-08-13 | 13F | Beacon Pointe Advisors, LLC | 31.081 | 689 | ||||||
| 2025-08-13 | 13F | Avestar Capital, LLC | 14.900 | 330 | ||||||
| 2025-08-12 | 13F | Global Retirement Partners, LLC | 5.849 | 130 | ||||||
| 2025-08-14 | 13F | Mml Investors Services, Llc | 18.179 | -9,93 | 0 | |||||
| 2025-08-07 | 13F | CENTRAL TRUST Co | 500 | 11 | ||||||
| 2025-07-01 | 13F | Stonehearth Capital Management, LLC | 10.364 | 230 | ||||||
| 2025-08-13 | 13F | Northwestern Mutual Wealth Management Co | 46 | 1 | ||||||
| 2025-08-14 | 13F | McIlrath & Eck, LLC | 5.627 | 125 | ||||||
| 2025-07-30 | 13F | Pittenger & Anderson Inc | 680 | 15 | ||||||
| 2025-08-13 | 13F | Continuum Advisory, LLC | 0 | -100,00 | 0 | |||||
| 2025-08-04 | 13F | Hantz Financial Services, Inc. | 85 | 0 | ||||||
| 2025-08-11 | 13F | Cornerstone Planning Group LLC | 12.176 | 223 | ||||||
| 2025-07-10 | 13F | Wealth Enhancement Advisory Services, Llc | 69.034 | 77,73 | 1.442 | 82,76 | ||||
| 2025-08-14 | 13F | SIH Partners, LLLP | 108.032 | 2.395 | ||||||
| 2025-08-15 | 13F | CI Private Wealth, LLC | 44.572 | 199,24 | 988 | 227,15 | ||||
| 2025-07-14 | 13F | Proathlete Wealth Management Llc | 188 | 4 | ||||||
| 2025-08-04 | 13F | Migdal Insurance & Financial Holdings Ltd. | 0 | -100,00 | 0 | |||||
| 2025-08-06 | 13F | Legacy Investment Solutions, LLC | 12.048 | 267 | ||||||
| 2025-08-14 | 13F | Coppell Advisory Solutions LLC | 0 | -100,00 | 0 | |||||
| 2025-07-28 | 13F | BRYN MAWR TRUST Co | 6.915 | 26,23 | 153 | 37,84 | ||||
| 2025-08-14 | 13F | Visionary Wealth Advisors | 24.971 | 52,68 | 554 | 66,57 | ||||
| 2025-07-24 | 13F | PDS Planning, Inc | 13.269 | 294 | ||||||
| 2025-08-14 | 13F | Wells Fargo & Company/mn | 4 | 300,00 | 0 | |||||
| 2025-08-14 | 13F | SWAN Capital LLC | 283 | 6 | ||||||
| 2025-08-06 | 13F | Walkner Condon Financial Advisors LLC | 0 | -100,00 | 0 | |||||
| 2025-08-06 | 13F | Wedbush Securities Inc | 12.765 | 0 | ||||||
| 2025-08-11 | 13F | United Advisor Group, LLC | 20.744 | 460 | ||||||
| 2025-08-08 | 13F | Meridian Wealth Management, LLC | 20.451 | 453 | ||||||
| 2025-08-14 | 13F | Raymond James Financial Inc | 1.644 | 36 | ||||||
| 2025-04-09 | 13F | Worth Asset Management, LLC | 0 | -100,00 | 0 | |||||
| 2025-07-21 | 13F | Hilltop National Bank | 87 | 0,00 | 2 | -50,00 | ||||
| 2025-08-14 | 13F | Beaird Harris Wealth Management, LLC | 4.051 | 90 | ||||||
| 2025-08-14 | 13F | Jane Street Group, Llc | Call | 304.100 | -27,78 | 6.742 | -21,25 | |||
| 2025-08-04 | 13F | Wealth Management Associates, Inc. | 10.570 | 234 | ||||||
| 2025-07-28 | 13F | Kiker Wealth Management, LLC | 355 | 25,89 | 8 | 40,00 | ||||
| 2025-08-14 | 13F | Jane Street Group, Llc | Put | 474.700 | 49,94 | 10.524 | 63,52 | |||
| 2025-08-08 | 13F | Creative Planning | 30.689 | 680 | ||||||
| 2025-08-14 | 13F | Toronto Dominion Bank | 5.000 | 150,00 | 111 | 170,73 | ||||
| 2025-08-18 | 13F | Hollencrest Capital Management | 500 | 11 | ||||||
| 2025-08-11 | 13F | BluePath Capital Management, LLC | 54.787 | 23,47 | 1.215 | 34,59 | ||||
| 2025-08-05 | 13F | Simplex Trading, Llc | 206.692 | 68,30 | 5 | 100,00 | ||||
| 2025-05-12 | 13F | Fmr Llc | 0 | -100,00 | 0 | |||||
| 2025-07-28 | 13F | Frazier Financial Advisors, LLC | 25 | 0,00 | 1 | |||||
| 2025-08-15 | 13F | Tower Research Capital LLC (TRC) | 0 | -100,00 | 0 | -100,00 | ||||
| 2025-07-21 | 13F | Ameritas Advisory Services, LLC | 1.718 | 38 | ||||||
| 2025-08-13 | 13F | Kilter Group LLC | 150 | 3 | ||||||
| 2025-07-24 | 13F | Us Bancorp \de\ | 5.650 | 125 | ||||||
| 2025-08-12 | 13F | Jpmorgan Chase & Co | 0 | -100,00 | 0 | -100,00 | ||||
| 2025-07-30 | 13F | Evermay Wealth Management Llc | 202 | 4 | ||||||
| 2025-08-14 | 13F | Citadel Advisors Llc | Put | 474.000 | 33,56 | 10.509 | 45,64 | |||
| 2025-08-14 | 13F | TT Capital Management LLC | 83.000 | 1.843 | ||||||
| 2025-08-14 | 13F | Citadel Advisors Llc | Call | 667.600 | 101,08 | 14.801 | 119,29 | |||
| 2025-06-26 | NP | YMAX - YieldMaxTM Universe Fund of Option Income ETFs | 1.049.840 | 15,24 | 25.553 | 4,47 | ||||
| 2025-08-12 | 13F | SRS Capital Advisors, Inc. | 0 | -100,00 | 0 | -100,00 | ||||
| 2025-08-04 | 13F | Spire Wealth Management | 915 | 71,35 | 20 | 100,00 | ||||
| 2025-08-11 | 13F | Principal Securities, Inc. | 6.499 | 4.937,98 | 144 | 4.700,00 | ||||
| 2025-07-17 | 13F | Investment Research & Advisory Group, Inc. | 50 | 1 | ||||||
| 2025-07-16 | 13F | Signaturefd, Llc | 3.754 | 50,16 | 83 | 66,00 | ||||
| 2025-08-14 | 13F | Prelude Capital Management, Llc | 100.000 | 2.217 | ||||||
| 2025-08-08 | 13F | Avantax Advisory Services, Inc. | 21.263 | -3,03 | 471 | 5,84 | ||||
| 2025-07-21 | 13F | HighMark Wealth Management LLC | 123 | 3 | ||||||
| 2025-05-19 | 13F/A | Jane Street Group, Llc | 0 | -100,00 | 0 | -100,00 | ||||
| 2025-08-14 | 13F | Royal Bank Of Canada | 10.601 | 235 | ||||||
| 2025-08-14 | 13F | Citadel Advisors Llc | 0 | -100,00 | 0 | -100,00 | ||||
| 2025-08-15 | 13F | Captrust Financial Advisors | 15.382 | 341 | ||||||
| 2025-08-13 | 13F | BCJ Capital Management, LLC | 9.525 | 211 | ||||||
| 2025-07-10 | 13F | Redhawk Wealth Advisors, Inc. | 16.513 | 38,75 | 366 | 51,87 | ||||
| 2025-08-14 | 13F | Federation des caisses Desjardins du Quebec | 207.522 | 105,47 | 4.599 | 123,96 | ||||
| 2025-08-14 | 13F | Group One Trading, L.p. | 174.193 | -21,32 | 3.862 | -14,20 | ||||
| 2025-08-05 | 13F | Huntington National Bank | 256 | |||||||
| 2025-08-13 | 13F | Finer Wealth Management, Inc. | 14.874 | 330 | ||||||
| 2025-08-13 | 13F | Lauer Wealth, LLC | 29.845 | 579 | ||||||
| 2025-08-08 | 13F | Everett Harris & Co /ca/ | 10.555 | 234 | ||||||
| 2025-08-14 | 13F | Mariner, LLC | 25.258 | -10,91 | 560 | -2,95 | ||||
| 2025-08-01 | 13F | Winebrenner Capital Management Llc | 10.500 | 0,00 | 233 | 8,92 | ||||
| 2025-08-14 | 13F | Headlands Technologies LLC | 709 | -44,91 | 16 | -42,31 | ||||
| 2025-08-14 | 13F | UBS Group AG | 3.837 | 39,43 | 85 | 54,55 | ||||
| 2025-07-16 | 13F | Legend Financial Advisors, Inc. | 500 | 11 | ||||||
| 2025-08-12 | 13F | Maripau Wealth Management Llc | 45.852 | 1.017 | ||||||
| 2025-05-28 | 13F | Silicon Valley Capital Partners | 214 | 4 | ||||||
| 2025-08-07 | 13F | Argent Advisors, Inc. | 50.000 | 150,00 | 1.108 | 172,91 | ||||
| 2025-07-31 | 13F | Cambridge Investment Research Advisors, Inc. | 15.906 | -13,66 | 0 | |||||
| 2025-07-08 | 13F | Parallel Advisors, LLC | 667 | 15 | ||||||
| 2025-07-11 | 13F | Kapstone Financial Advisors LLC | 18.077 | 401 | ||||||
| 2025-08-18 | 13F | Geneos Wealth Management Inc. | 623 | 72,58 | 14 | 85,71 | ||||
| 2025-08-08 | 13F | Larson Financial Group LLC | 752 | 26,17 | 17 | 33,33 | ||||
| 2025-05-13 | 13F | SHEPHERD WEALTH MANAGEMENT Ltd LIABILITY Co | 0 | -100,00 | 0 | |||||
| 2025-07-30 | 13F | FNY Investment Advisers, LLC | 8.200 | 355,56 | 0 | |||||
| 2025-08-14 | 13F/A | Rockefeller Capital Management L.P. | 10.000 | 222 | ||||||
| 2025-08-14 | 13F | CoreCap Advisors, LLC | 4.838 | 2.089,14 | 107 | 2.575,00 | ||||
| 2025-07-14 | 13F | Farmers & Merchants Investments Inc | 200 | 4 | ||||||
| 2025-08-12 | 13F | Park Square Financial Group, LLC | 464 | 10 | ||||||
| 2025-08-15 | 13F | Morgan Stanley | 70.810 | 210,73 | 1.570 | 238,88 | ||||
| 2025-07-25 | 13F | Almanack Investment Partners, LLC. | 16.183 | 359 | ||||||
| 2025-07-29 | 13F | Tradewinds Capital Management, LLC | 18 | 0 | ||||||
| 2025-07-10 | 13F | Secure Asset Management, LLC | 71.072 | 1.576 | ||||||
| 2025-08-13 | 13F | Walleye Capital LLC | 20.100 | 446 | ||||||
| 2025-08-07 | 13F | Allworth Financial LP | 1.238 | 27 | ||||||
| 2025-08-14 | 13F | Mercer Global Advisors Inc /adv | 90.315 | 0,21 | 2.002 | 9,28 | ||||
| 2025-07-25 | 13F | Hemington Wealth Management | 4.189 | 0,00 | 0 | |||||
| 2025-08-11 | 13F | Private Advisor Group, LLC | 502.370 | 35,66 | 11.138 | 47,94 | ||||
| 2025-08-15 | 13F | Kestra Advisory Services, LLC | 19.371 | 429 | ||||||
| 2025-07-24 | 13F | Ulland Investment Advisors, LLC | 354 | 0 | ||||||
| 2025-07-17 | 13F | Beacon Capital Management, LLC | 336 | -13,62 | 7 | 0,00 | ||||
| 2025-08-08 | 13F | Pnc Financial Services Group, Inc. | 301.300 | 6.680 | ||||||
| 2025-07-22 | 13F | Merit Financial Group, LLC | 65.361 | 18,53 | 1.449 | 29,26 | ||||
| 2025-06-27 | NP | Tidal Trust II - YieldMax(TM) Dorsey Wright Hybrid 5 Income ETF | 0 | -100,00 | 0 | -100,00 | ||||
| 2025-06-27 | NP | Tidal Trust II - YieldMax(TM) Dorsey Wright Featured 5 Income ETF | 0 | -100,00 | 0 | -100,00 | ||||
| 2025-08-07 | 13F | Kestra Private Wealth Services, Llc | 11.567 | 256 | ||||||
| 2025-08-14 | 13F | Keebeck Wealth Management, LLC | 60.335 | 76,67 | 1.338 | 92,65 | ||||
| 2025-07-07 | 13F | Versant Capital Management, Inc | 1.155 | 26 | ||||||
| 2025-07-30 | 13F | Capital Wealth Alliance, LLC | 15.126 | 335 | ||||||
| 2025-08-13 | 13F | Jump Financial, LLC | 425.060 | 9.424 | ||||||
| 2025-08-11 | 13F | Pin Oak Investment Advisors Inc | 50 | 0 | ||||||
| 2025-05-15 | 13F | Optiver Holding B.V. | 0 | -100,00 | 0 | |||||
| 2025-08-13 | 13F | Barclays Plc | 0 | -100,00 | 0 | |||||
| 2025-08-06 | 13F | Legacy Wealth Managment, LLC/ID | 12.048 | 267 | ||||||
| 2025-07-28 | 13F | Harbour Investments, Inc. | 306 | 146,77 | 7 | 200,00 | ||||
| 2025-08-12 | 13F | Steward Partners Investment Advisory, Llc | 2.886 | 64 | ||||||
| 2025-08-14 | 13F | Old Mission Capital Llc | 270.556 | 5.998 | ||||||
| 2025-07-22 | 13F | Blue Square Asset Management, Llc | 16.000 | 355 | ||||||
| 2025-07-25 | 13F | PrairieView Partners, LLC | 412 | 0 | ||||||
| 2025-09-04 | 13F/A | Advisor Group Holdings, Inc. | 14.059 | -15,44 | 312 | -7,99 | ||||
| 2025-08-05 | 13F | Bank Of Montreal /can/ | 670 | 15 | ||||||
| 2025-08-13 | 13F | M Holdings Securities, Inc. | 12.343 | 0 | ||||||
| 2025-07-31 | 13F | Ssa Swiss Advisors Ag | 4.801 | 101 | ||||||
| 2025-08-18 | 13F | N.E.W. Advisory Services LLC | 88 | 2 | ||||||
| 2025-07-11 | 13F | Farther Finance Advisors, LLC | 27 | 125,00 | 1 | |||||
| 2025-07-18 | 13F | Precision Wealth Strategies, LLC | 9.406 | 209 | ||||||
| 2025-08-12 | 13F | Legacy Financial Group, Inc. | 12.850 | 285 | ||||||
| 2025-08-13 | 13F | EverSource Wealth Advisors, LLC | 0 | -100,00 | 0 | |||||
| 2025-07-07 | 13F | Thurston, Springer, Miller, Herd & Titak, Inc. | 100 | 0,00 | 2 | 0,00 | ||||
| 2025-08-14 | 13F | Schonfeld Strategic Advisors LLC | 9.700 | -51,50 | 215 | -47,04 | ||||
| 2025-07-31 | 13F/A | Avion Wealth | 100 | 0 | ||||||
| 2025-08-08 | 13F | CFO4Life Group, LLC | 17.594 | 390 | ||||||
| 2025-07-22 | 13F | Wealthcare Advisory Partners LLC | 11.007 | 244 | ||||||
| 2025-07-23 | 13F | Evexia Wealth Llc | 53.800 | 1.166 | ||||||
| 2025-08-12 | 13F | Clear Street Markets Llc | 3.800 | 90,00 | 84 | 110,00 | ||||
| 2025-07-09 | 13F | Dynamic Advisor Solutions LLC | 29.991 | 22,89 | 665 | 33,87 | ||||
| 2025-08-01 | 13F | Envestnet Asset Management Inc | 92.335 | 25,41 | 2.047 | 36,83 | ||||
| 2025-07-17 | 13F | Nelson, Van Denburg & Campbell Wealth Management Group, LLC | 9.115 | 202 | ||||||
| 2025-08-14 | 13F | Ausdal Financial Partners, Inc. | 16.262 | 361 | ||||||
| 2025-08-06 | 13F | Commonwealth Equity Services, Llc | 92.418 | 668,36 | 2 | |||||
| 2025-07-22 | 13F | Team Financial Group, LLC | 487 | 11 | ||||||
| 2025-08-12 | 13F | CIBC Private Wealth Group, LLC | 1.760 | 39 | ||||||
| 2025-07-15 | 13F | Regatta Capital Group, Llc | 34.000 | 36,00 | 754 | 48,23 | ||||
| 2025-08-14 | 13F | Arete Wealth Advisors, LLC | 10.935 | 0,29 | 0 | |||||
| 2025-08-14 | 13F | Riggs Asset Managment Co. Inc. | 11 | 0 | ||||||
| 2025-08-04 | 13F | Creative Financial Designs Inc /adv | 316 | 7 | ||||||
| 2025-08-14 | 13F | Bank Of America Corp /de/ | 82.659 | 818,43 | 1.833 | 906,59 | ||||
| 2025-08-14 | 13F | Premier Financial Group | 338 | 7 | ||||||
| 2025-08-19 | 13F | Newbridge Financial Services Group, Inc. | 7.095 | 31,39 | 157 | 44,04 | ||||
| 2025-07-22 | 13F | Berger Financial Group, Inc | 12.934 | 287 | ||||||
| 2025-08-13 | 13F | Renaissance Technologies Llc | 182.800 | 4.053 | ||||||
| 2025-08-04 | 13F | Roble, Belko & Company, Inc | 15 | 0 | ||||||
| 2025-05-15 | 13F | Scientech Research LLC | 0 | -100,00 | 0 | |||||
| 2025-08-01 | 13F | Vision Financial Markets Llc | 1.021 | 139,11 | 23 | 175,00 |