Grundlæggende statistik
| Institutionelle ejere | 120 total, 120 long only, 0 short only, 0 long/short - change of 0,84% MRQ |
| Gennemsnitlig porteføljeallokering | 0.3548 % - change of 10,01% MRQ |
| Institutionelle aktier (lange) | 37.553.441 (ex 13D/G) - change of 8,22MM shares 28,04% MRQ |
| Institutionel værdi (lang) | $ 880.893 USD ($1000) |
Institutionelt ejerskab og aktionærer
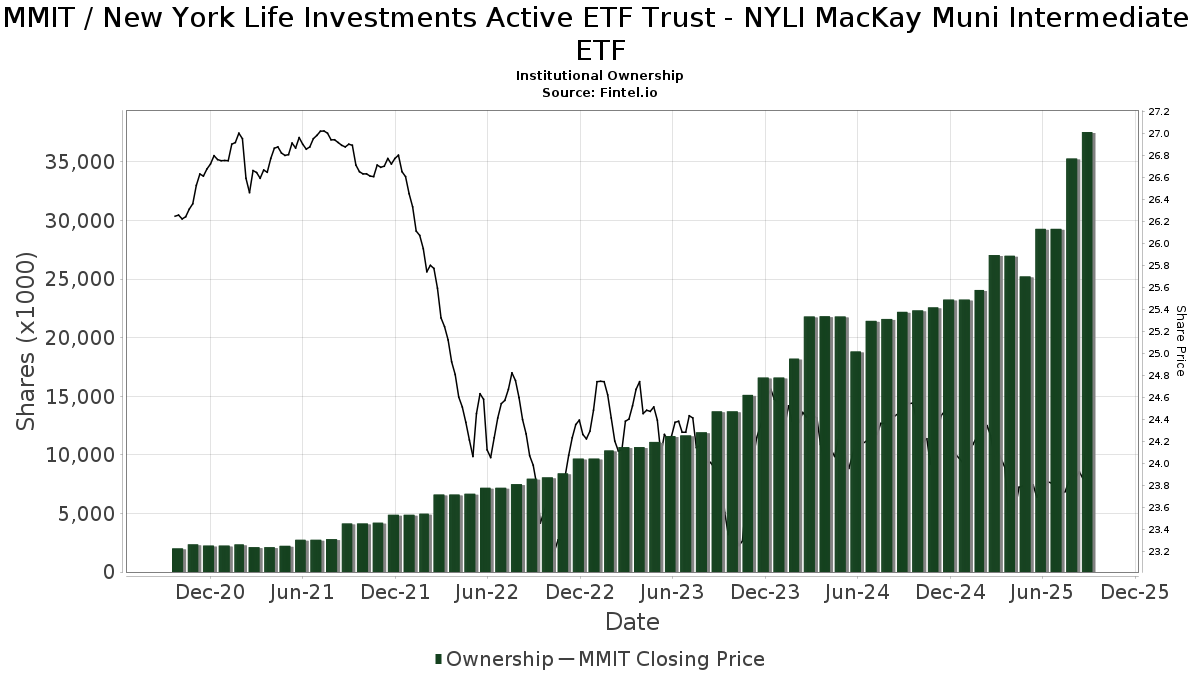
New York Life Investments Active ETF Trust - NYLI MacKay Muni Intermediate ETF (US:MMIT) har 120 institutionelle ejere og aktionærer, der har indsendt 13D/G- eller 13F-formularer til Securities Exchange Commission (SEC). Disse institutioner har i alt 37,553,441 aktier. Største aktionærer omfatter Orgel Wealth Management, LLC, Bank Of America Corp /de/, Morgan Stanley, Meeder Advisory Services, Inc., Schneider Downs Wealth Management Advisors, LP, Cetera Investment Advisers, Raymond James Financial Inc, UBS Group AG, LPL Financial LLC, and Avantax Planning Partners, Inc. .
New York Life Investments Active ETF Trust - NYLI MacKay Muni Intermediate ETF (ARCA:MMIT) institutionel ejerskabsstruktur viser aktuelle positioner i virksomheden efter institutioner og fonde, samt seneste ændringer i positionsstørrelse. Større aktionærer kan omfatte individuelle investorer, investeringsforeninger, hedgefonde eller institutioner. Skema 13D angiver, at investoren besidder (eller besidder) mere end 5 % af virksomheden og har til hensigt (eller har til hensigt at) aktivt at forfølge en ændring i forretningsstrategi. Skema 13G indikerer en passiv investering på over 5%.
The share price as of September 8, 2025 is 24,14 / share. Previously, on September 9, 2024, the share price was 24,50 / share. This represents a decline of 1,49% over that period.
Fondens stemningsscore
Fund Sentiment Score (fka Ownership Accumulation Score) finder de aktier, der bliver mest købt af fonde. Det er resultatet af en sofistikeret, multi-faktor kvantitativ model, der identificerer virksomheder med de højeste niveauer af institutionel akkumulering. Scoringsmodellen bruger en kombination af den samlede stigning i oplyste ejere, ændringerne i porteføljeallokeringer i disse ejere og andre målinger. Tallet går fra 0 til 100, hvor højere tal indikerer et højere niveau af akkumulering for sine jævnaldrende, og 50 er gennemsnittet.
Opdateringsfrekvens: Dagligt
Se Ownership Explorer, som giver en liste over højest rangerende virksomheder.
Institutionel Put/Call-forhold
Ud over at indberette standardaktie- og gældsudstedelser skal institutter med mere end 100 mill. aktiver under forvaltning også oplyse deres put- og call-optionsbeholdninger. Da salgsoptioner generelt indikerer negativ stemning, og købsoptioner indikerer positiv stemning, kan vi få en fornemmelse af den overordnede institutionelle stemning ved at plotte forholdet mellem put og kald. Diagrammet til højre viser det historiske put/call-forhold for dette instrument.
Brug af Put/Call Ratio som en indikator for investorernes stemning overvinder en af de vigtigste mangler ved at bruge totalt institutionelt ejerskab, som er, at en betydelig mængde af aktiver under forvaltning investeres passivt for at spore indekser. Passivt forvaltede fonde køber typisk ikke optioner, så indikatoren for put/call-forholdet følger mere nøje følelsen af aktivt forvaltede fonde.
13F og NPORT arkivering
Detaljer om 13F-arkivering er gratis. Detaljer om NP-ansøgninger kræver et premium-medlemskab. Grønne rækker angiver nye positioner. Røde rækker angiver lukkede positioner. Klik på linket ikon for at se den fulde transaktionshistorik.
Opgrader
for at låse premium-data op og eksportere til Excel ![]() .
.
| Fil dato | Kilde | Investor | Type | Gennemsnitlig pris (Øst) |
Aktier | Δ Aktier (%) |
Rapporteret Værdi ($1000) |
Δ Værdi (%) |
Port Alloc (%) |
|
|---|---|---|---|---|---|---|---|---|---|---|
| 2025-08-08 | 13F | Condor Capital Management | 461.713 | 11.012 | ||||||
| 2025-08-14 | 13F | Peapack Gladstone Financial Corp | 0 | -100,00 | 0 | |||||
| 2025-07-09 | 13F | Dynamic Advisor Solutions LLC | 355.902 | -10,31 | 8.488 | -10,76 | ||||
| 2025-08-14 | 13F | Visionary Wealth Advisors | 12.683 | 0,95 | 302 | 0,33 | ||||
| 2025-08-11 | 13F | Vista Cima Wealth Management LLC | 19.970 | 0,00 | 476 | -0,42 | ||||
| 2025-08-05 | 13F | Elyxium Wealth, LLC | 86.302 | 127,69 | 2.058 | 126,65 | ||||
| 2025-08-01 | 13F/A | GGM Financials LLC | 113.950 | 244,73 | 2.718 | 243,06 | ||||
| 2025-07-14 | 13F | Friday Financial | 14.083 | -1,04 | 336 | -1,47 | ||||
| 2025-08-13 | 13F | Flow Traders U.s. Llc | 28.129 | 1 | ||||||
| 2025-07-14 | 13F | Park Avenue Securities Llc | 47.737 | 2,79 | 1 | 0,00 | ||||
| 2025-08-11 | 13F | Elequin Capital Lp | 27.641 | 659 | ||||||
| 2025-09-04 | 13F/A | Advisor Group Holdings, Inc. | 362.887 | 96,67 | 8.655 | 95,70 | ||||
| 2025-07-18 | 13F | Vicus Capital | 308.869 | 35,15 | 7.367 | 34,49 | ||||
| 2025-08-27 | 13F/A | Brinker Capital Investments, LLC | 456.989 | 4,07 | 10.899 | 3,55 | ||||
| 2025-08-13 | 13F | Jones Financial Companies Lllp | 1.393 | 33 | ||||||
| 2025-04-25 | 13F | Smallwood Wealth Investment Management, LLC | 98.313 | 14,25 | 2.357 | 14,04 | ||||
| 2025-08-05 | 13F | NewSquare Capital LLC | 23.574 | 2,77 | 562 | 2,37 | ||||
| 2025-08-15 | 13F | Morgan Stanley | 2.496.217 | -2,97 | 59.535 | -3,46 | ||||
| 2025-07-14 | 13F | Golden State Equity Partners | 18.461 | 7,81 | 440 | 7,32 | ||||
| 2025-08-14 | 13F | Royal Bank Of Canada | 401.594 | 310,48 | 9.578 | 308,44 | ||||
| 2025-08-11 | 13F | Private Advisor Group, LLC | 75.091 | -46,85 | 1.791 | -47,14 | ||||
| 2025-07-31 | 13F | Schneider Downs Wealth Management Advisors, LP | 1.838.266 | 4,40 | 43.843 | 3,88 | ||||
| 2025-05-15 | 13F | Gts Securities Llc | 0 | -100,00 | 0 | |||||
| 2025-08-04 | 13F | Daymark Wealth Partners, Llc | 10.420 | 249 | ||||||
| 2025-08-07 | 13F | Midwest Trust Co | 581.489 | 13.869 | ||||||
| 2025-08-14 | 13F | Jane Street Group, Llc | 214.396 | -50,98 | 5.113 | -51,23 | ||||
| 2025-08-04 | 13F | Atria Investments Llc | 16.138 | 13,30 | 385 | 12,61 | ||||
| 2025-08-13 | 13F | Level Four Advisory Services, Llc | 17.577 | -1,86 | 419 | -2,33 | ||||
| 2025-08-07 | 13F | PFG Advisors | 58.777 | 18,53 | 1.402 | 17,93 | ||||
| 2025-07-25 | 13F | Landmark Wealth Management, LLC | 59.785 | -29,09 | 1 | -50,00 | ||||
| 2025-07-14 | 13F | Brady Martz Wealth Solutions, LLC | 206.903 | -13,25 | 4.935 | -13,68 | ||||
| 2025-07-18 | 13F | Bartlett & Co. Wealth Management Llc | 5.060 | -20,81 | 121 | -21,57 | ||||
| 2025-08-05 | 13F | Tsfg, Llc | 5.409 | 0,11 | 0 | |||||
| 2025-08-11 | 13F | Pineridge Advisors LLC | 8.091 | -9,43 | 193 | -10,28 | ||||
| 2025-07-10 | 13F | Orgel Wealth Management, LLC | 5.909.226 | 140.935 | ||||||
| 2025-07-07 | 13F | TruWealth Advisors, LLC | 691.196 | 1,35 | 16.485 | 0,84 | ||||
| 2025-07-09 | 13F | Burt Wealth Advisors | 70.430 | 137,30 | 1.680 | 136,15 | ||||
| 2025-08-14 | 13F | GWM Advisors LLC | 18.920 | 108,21 | 451 | 107,83 | ||||
| 2025-08-13 | 13F | Bernardo Wealth Planning LLC | 144.828 | -11,64 | 3 | 0,00 | ||||
| 2025-07-16 | 13F | Evergreen Private Wealth LLC | 65.745 | -1,02 | 1.568 | -1,51 | ||||
| 2025-08-04 | 13F | Assetmark, Inc | 4.185 | 81,72 | 100 | 80,00 | ||||
| 2025-08-06 | 13F | AE Wealth Management LLC | 10.917 | 13,75 | 260 | 13,04 | ||||
| 2025-08-14 | 13F | Wells Fargo & Company/mn | 4.878 | 116 | ||||||
| 2025-08-05 | 13F | GPS Wealth Strategies Group, LLC | 0 | -100,00 | 0 | |||||
| 2025-05-16 | 13F | Coppell Advisory Solutions LLC | 0 | -100,00 | 0 | |||||
| 2025-07-25 | 13F | Atria Wealth Solutions, Inc. | 31.248 | 15,81 | 745 | 15,33 | ||||
| 2025-07-31 | 13F | Opes Wealth Management LLC | 39.255 | 9,03 | 936 | 8,46 | ||||
| 2025-07-15 | 13F | BCS Wealth Management | 22.762 | -36,82 | 1 | |||||
| 2025-08-12 | 13F | Steward Partners Investment Advisory, Llc | 3.000 | -18,26 | 72 | -18,39 | ||||
| 2025-07-28 | 13F | Harbour Investments, Inc. | 0 | -100,00 | 0 | |||||
| 2025-08-08 | 13F | CFO4Life Group, LLC | 411.040 | 26,90 | 9.803 | 26,28 | ||||
| 2025-08-07 | 13F | Meeder Advisory Services, Inc. | 1.910.061 | 11,99 | 45.555 | 11,43 | ||||
| 2025-08-12 | 13F | Jpmorgan Chase & Co | 196.002 | 36,11 | 4.675 | 35,44 | ||||
| 2025-08-04 | 13F | Amplius Wealth Advisors, LLC | 20.092 | -27,43 | 479 | -27,75 | ||||
| 2025-08-06 | 13F | Commonwealth Equity Services, Llc | 141.061 | -1,71 | 3 | 0,00 | ||||
| 2025-08-14 | 13F | Hrt Financial Lp | 0 | -100,00 | 0 | |||||
| 2025-08-06 | 13F | Golden State Wealth Management, LLC | 80.395 | -1,10 | 1.917 | -1,59 | ||||
| 2025-08-14 | 13F | Great Valley Advisor Group, Inc. | 412.212 | -2,25 | 9.831 | -2,75 | ||||
| 2025-08-15 | 13F | Captrust Financial Advisors | 61.136 | -32,22 | 1.458 | -32,53 | ||||
| 2025-08-14 | 13F | Mariner, LLC | 66.024 | -4,92 | 1.575 | -5,41 | ||||
| 2025-08-08 | 13F | Evolution Wealth Advisors, LLC | 30.413 | 0,00 | 725 | -0,55 | ||||
| 2025-08-12 | 13F | Proequities, Inc. | 0 | 0 | ||||||
| 2025-08-14 | 13F | Mml Investors Services, Llc | 102.075 | -3,70 | 2 | 0,00 | ||||
| 2025-05-15 | 13F/A | Orion Portfolio Solutions, LLC | 439.103 | 10.525 | ||||||
| 2025-08-15 | 13F | Kestra Advisory Services, LLC | 9.019 | -53,62 | 215 | -53,86 | ||||
| 2025-08-08 | 13F | Avantax Advisory Services, Inc. | 10.575 | 252 | ||||||
| 2025-07-30 | 13F | Caliber Wealth Management, LLC / KS | 16.694 | 0,00 | 398 | -0,50 | ||||
| 2025-08-26 | 13F/A | Thrivent Financial For Lutherans | 0 | -100,00 | 0 | |||||
| 2025-05-14 | 13F | Susquehanna International Group, Llp | 0 | -100,00 | 0 | |||||
| 2025-07-31 | 13F | New Hampshire Trust | 9.494 | -68,97 | 226 | -69,17 | ||||
| 2025-08-05 | 13F | Bank of New York Mellon Corp | 301.516 | -1,56 | 7.191 | -2,04 | ||||
| 2025-08-13 | 13F | Kuhn & Co Investment Counsel | 77.193 | 3,92 | 1.841 | 3,43 | ||||
| 2025-08-14 | 13F | Synovus Financial Corp | 10.480 | -5,54 | 250 | -6,04 | ||||
| 2025-08-11 | 13F | Anderson Financial Strategies, LLC | 0 | -100,00 | 0 | |||||
| 2025-08-13 | 13F | Vertex Planning Partners, LLC | 11.335 | 0,00 | 270 | -0,37 | ||||
| 2025-08-14 | 13F | Bank Of America Corp /de/ | 4.543.656 | 9,71 | 108.366 | 9,16 | ||||
| 2025-08-11 | 13F | Avantax Planning Partners, Inc. | 1.320.615 | 90,75 | 31.497 | 89,79 | ||||
| 2025-07-17 | 13F | Saxon Interests, Inc. | 30.995 | 0,00 | 743 | 0,00 | ||||
| 2025-07-31 | 13F | Cambridge Investment Research Advisors, Inc. | 8.939 | 0 | ||||||
| 2025-08-08 | 13F | Fortis Group Advisors, LLC | 28.799 | 25,31 | 685 | 24,36 | ||||
| 2025-08-11 | 13F | Invenio Wealth Partners Llc | 300.375 | 7.164 | ||||||
| 2025-08-12 | 13F | J.w. Cole Advisors, Inc. | 15.558 | 1,16 | 371 | 0,82 | ||||
| 2025-08-08 | 13F/A | Sequoia Financial Advisors, LLC | 0 | -100,00 | 0 | |||||
| 2025-07-18 | 13F | Truist Financial Corp | 288.933 | 0,98 | 6.891 | 0,48 | ||||
| 2025-07-23 | 13F | Clear Creek Financial Management, LLC | 14.468 | 0,00 | 345 | -0,29 | ||||
| 2025-08-13 | 13F | Northwestern Mutual Wealth Management Co | 4.056 | 16,82 | 97 | 15,66 | ||||
| 2025-08-08 | 13F | Cornerstone Advisors Asset Management, Inc | 463.423 | -2,23 | 11.053 | -2,72 | ||||
| 2025-08-14 | 13F | Old Mission Capital Llc | 32.862 | 24,58 | 784 | 23,89 | ||||
| 2025-07-14 | 13F | AdvisorNet Financial, Inc | 84.400 | -2,06 | 2.013 | -2,57 | ||||
| 2025-07-21 | 13F | Ameritas Advisory Services, LLC | 3.319 | 79 | ||||||
| 2025-07-10 | 13F | Legacy Financial Strategies, LLC | 77.814 | 1,45 | 1.856 | 0,92 | ||||
| 2025-08-13 | 13F | VestGen Advisors, LLC | 113.586 | 20,18 | 2.705 | 19,43 | ||||
| 2025-08-14 | 13F | Citadel Advisors Llc | 0 | -100,00 | 0 | |||||
| 2025-08-14 | 13F | Comerica Bank | 41.146 | 34,96 | 981 | 34,38 | ||||
| 2025-07-10 | 13F | Wealth Enhancement Advisory Services, Llc | 23.656 | 59,37 | 563 | 58,59 | ||||
| 2025-07-28 | 13F | Axxcess Wealth Management, Llc | 40.161 | 4,10 | 958 | 3,57 | ||||
| 2025-07-22 | 13F | DAVENPORT & Co LLC | 17.073 | 1,83 | 407 | 1,50 | ||||
| 2025-08-01 | 13F | Financial Counselors Inc | 0 | -100,00 | 0 | |||||
| 2025-08-11 | 13F | HighTower Advisors, LLC | 22.105 | 527 | ||||||
| 2025-08-08 | 13F | Cetera Investment Advisers | 1.702.735 | 2,31 | 40.610 | 1,79 | ||||
| 2025-07-29 | 13F | Swmg, Llc | 31.643 | -0,16 | 751 | 0,00 | ||||
| 2025-08-14 | 13F | Raymond James Financial Inc | 1.586.989 | -13,74 | 37.850 | -14,17 | ||||
| 2025-08-01 | 13F | Envestnet Asset Management Inc | 589.199 | 8,44 | 14.052 | 7,90 | ||||
| 2025-08-14 | 13F | Goldman Sachs Group Inc | 80.600 | 1.922 | ||||||
| 2025-07-21 | 13F | Kennebec Savings Bank | 10.039 | 0,00 | 239 | -0,42 | ||||
| 2025-07-17 | 13F | Janney Capital Management LLC | 58.723 | -1,04 | 1 | 0,00 | ||||
| 2025-08-12 | 13F | CIBC Private Wealth Group, LLC | 1 | 0,00 | 0 | |||||
| 2025-08-14 | 13F | Stifel Financial Corp | 167.239 | -10,38 | 3.989 | -10,84 | ||||
| 2025-08-11 | 13F | Western Wealth Management, LLC | 27.631 | 2,76 | 659 | 2,33 | ||||
| 2025-07-25 | 13F | Bill Few Associates, Inc. | 13.132 | 0,00 | 313 | -0,32 | ||||
| 2025-08-12 | 13F | Journey Strategic Wealth Llc | 117.986 | -7,13 | 2.814 | -7,62 | ||||
| 2025-08-14 | 13F/A | Rockefeller Capital Management L.P. | 20.844 | 0,61 | 497 | 0,20 | ||||
| 2025-08-14 | 13F | UBS Group AG | 1.405.478 | -11,65 | 33.521 | -12,09 | ||||
| 2025-08-14 | 13F | Prestige Wealth Management Group LLC | 259.805 | -5,68 | 6.196 | -6,15 | ||||
| 2025-07-09 | 13F | Massmutual Trust Co Fsb/adv | 417.115 | 38,92 | 9.948 | 38,24 | ||||
| 2025-08-14 | 13F | TCG Advisory Services, LLC | 10.991 | -30,96 | 262 | -31,23 | ||||
| 2025-07-31 | 13F | Buckingham Strategic Partners | 220.986 | -12,56 | 5.271 | -12,99 | ||||
| 2025-07-24 | 13F | Lokken Investment Group LLC | 15.410 | 52,17 | 368 | 51,65 | ||||
| 2025-08-12 | 13F | Frontier Asset Management, LLC | 38.894 | -3,94 | 928 | -4,43 | ||||
| 2025-08-13 | 13F | IAG Wealth Partners, LLC | 999.094 | -8,13 | 23.828 | -8,59 | ||||
| 2025-07-11 | 13F | Farther Finance Advisors, LLC | 0 | -100,00 | 0 | |||||
| 2025-08-12 | 13F | Titleist Asset Management, Llc | 36.209 | 1,21 | 864 | 0,70 | ||||
| 2025-08-12 | 13F | Global Retirement Partners, LLC | 458 | 0,00 | 11 | 0,00 | ||||
| 2025-08-12 | 13F | LPL Financial LLC | 1.345.146 | 13,83 | 32.082 | 13,26 | ||||
| 2025-08-14 | 13F | Main Street Financial Solutions, LLC | 267.310 | -1,71 | 6.375 | -2,19 | ||||
| 2025-07-14 | 13F | Narus Financial Partners, LLC | 40.038 | -5,06 | 955 | -5,54 | ||||
| 2025-08-08 | 13F | Wiser Advisor Group LLC | 0 | -100,00 | 0 | |||||
| 2025-07-10 | 13F | Cypress Point Wealth Management, LLC | 130.965 | -3,10 | 3.124 | -3,58 | ||||
| 2025-08-07 | 13F | Allworth Financial LP | 390 | 0,00 | 9 | 0,00 | ||||
| 2025-08-14 | 13F | Snowden Capital Advisors LLC | 61.588 | 27,95 | 1.469 | 27,32 | ||||
| 2025-07-21 | 13F | Curran Financial Partners, LLC | 23.903 | -10,12 | 570 | -10,52 | ||||
| 2025-07-09 | 13F | Pallas Capital Advisors LLC | 576.031 | -6,90 | 13.738 | -7,36 | ||||
| 2025-05-01 | 13F | Cwm, Llc | 0 | -100,00 | 0 | |||||
| 2025-08-12 | 13F | PKS Advisory Services, LLC | 38.951 | 10,13 | 929 | 9,56 | ||||
| 2025-08-11 | 13F | Principal Securities, Inc. | 5.562 | 4,39 | 133 | 3,94 | ||||
| 2025-08-13 | 13F | WCG Wealth Advisors LLC | 10.098 | -0,35 | 241 | -0,83 |