Grundlæggende statistik
| Institutionelle ejere | 113 total, 113 long only, 0 short only, 0 long/short - change of 1,80% MRQ |
| Gennemsnitlig porteføljeallokering | 0.1183 % - change of 117,82% MRQ |
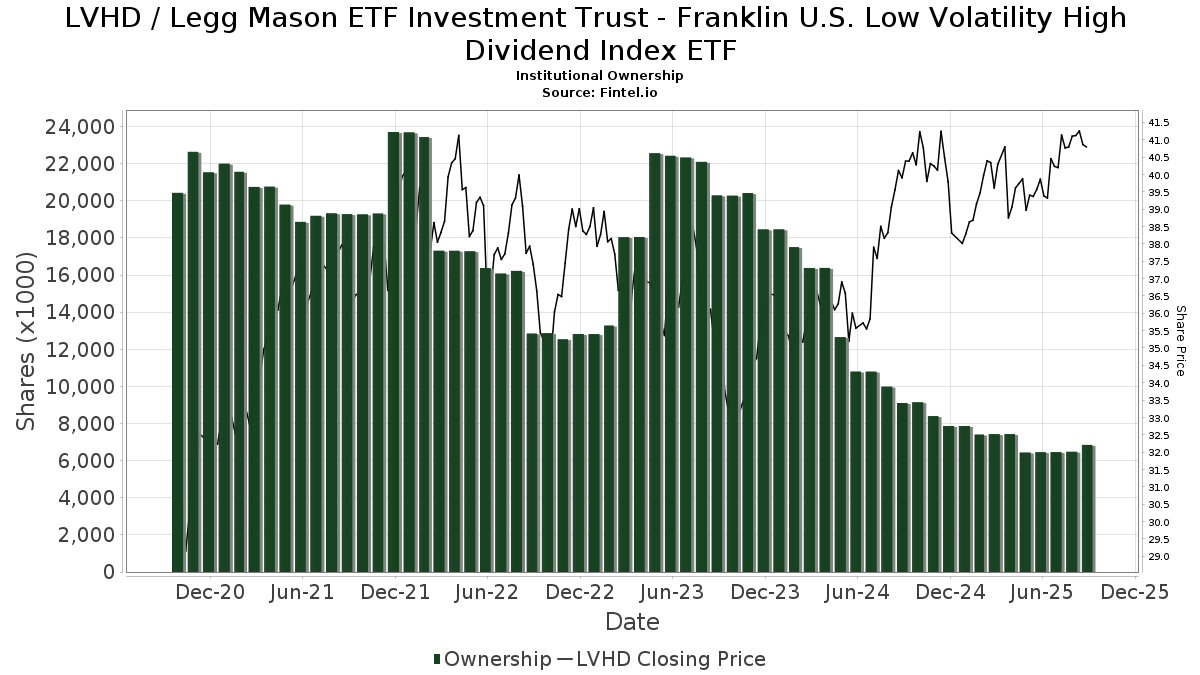
| Institutionelle aktier (lange) | 6.994.912 (ex 13D/G) - change of -0,23MM shares -3,20% MRQ |
| Institutionel værdi (lang) | $ 275.345 USD ($1000) |
Institutionelt ejerskab og aktionærer
Legg Mason ETF Investment Trust - Franklin U.S. Low Volatility High Dividend Index ETF (US:LVHD) har 113 institutionelle ejere og aktionærer, der har indsendt 13D/G- eller 13F-formularer til Securities Exchange Commission (SEC). Disse institutioner har i alt 6,994,912 aktier. Største aktionærer omfatter Morgan Stanley, Financial Engines Advisors L.L.C., LPL Financial LLC, Bank Of America Corp /de/, UBS Group AG, Wells Fargo & Company/mn, Raymond James Financial Inc, Commonwealth Equity Services, Llc, Sequent Planning LLC, and Cetera Investment Advisers .
Legg Mason ETF Investment Trust - Franklin U.S. Low Volatility High Dividend Index ETF (NasdaqGM:LVHD) institutionel ejerskabsstruktur viser aktuelle positioner i virksomheden efter institutioner og fonde, samt seneste ændringer i positionsstørrelse. Større aktionærer kan omfatte individuelle investorer, investeringsforeninger, hedgefonde eller institutioner. Skema 13D angiver, at investoren besidder (eller besidder) mere end 5 % af virksomheden og har til hensigt (eller har til hensigt at) aktivt at forfølge en ændring i forretningsstrategi. Skema 13G indikerer en passiv investering på over 5%.
The share price as of April 24, 2026 is 42,82 / share. Previously, on April 28, 2025, the share price was 39,51 / share. This represents an increase of 8,37% over that period.
Fondens stemningsscore
Fund Sentiment Score (fka Ownership Accumulation Score) finder de aktier, der bliver mest købt af fonde. Det er resultatet af en sofistikeret, multi-faktor kvantitativ model, der identificerer virksomheder med de højeste niveauer af institutionel akkumulering. Scoringsmodellen bruger en kombination af den samlede stigning i oplyste ejere, ændringerne i porteføljeallokeringer i disse ejere og andre målinger. Tallet går fra 0 til 100, hvor højere tal indikerer et højere niveau af akkumulering for sine jævnaldrende, og 50 er gennemsnittet.
Opdateringsfrekvens: Dagligt
Se Ownership Explorer, som giver en liste over højest rangerende virksomheder.
AI+ Ask Fintel’s AI assistant about Legg Mason ETF Investment Trust - Franklin U.S. Low Volatility High Dividend Index ETF.
Select a question to share a public post with an AI-crafted answer.
Thinking of good questions…
Institutionel Put/Call-forhold
Ud over at indberette standardaktie- og gældsudstedelser skal institutter med mere end 100 mill. aktiver under forvaltning også oplyse deres put- og call-optionsbeholdninger. Da salgsoptioner generelt indikerer negativ stemning, og købsoptioner indikerer positiv stemning, kan vi få en fornemmelse af den overordnede institutionelle stemning ved at plotte forholdet mellem put og kald. Diagrammet til højre viser det historiske put/call-forhold for dette instrument.
Brug af Put/Call Ratio som en indikator for investorernes stemning overvinder en af de vigtigste mangler ved at bruge totalt institutionelt ejerskab, som er, at en betydelig mængde af aktiver under forvaltning investeres passivt for at spore indekser. Passivt forvaltede fonde køber typisk ikke optioner, så indikatoren for put/call-forholdet følger mere nøje følelsen af aktivt forvaltede fonde.

13F og NPORT arkivering
Detaljer om 13F-arkivering er gratis. Detaljer om NP-ansøgninger kræver et premium-medlemskab. Grønne rækker angiver nye positioner. Røde rækker angiver lukkede positioner. Klik på linket ikon for at se den fulde transaktionshistorik.
Opgrader
for at låse premium-data op og eksportere til Excel ![]() .
.
| Fil dato | Kilde | Investor | Type | Gennemsnitlig pris (Øst) |
Aktier | Δ Aktier (%) |
Rapporteret Værdi ($1000) |
Δ Værdi (%) |
Port Alloc (%) |
|
|---|---|---|---|---|---|---|---|---|---|---|
| 2026-02-17 | 13F | Citadel Advisors Llc | 11.687 | -53,97 | 466 | -55,58 | ||||
| 2026-02-17 | 13F | Advisory Services Network, LLC | 5.410 | 0,07 | 216 | -3,59 | ||||
| 2026-04-16 | 13F | Triad Wealth Partners, LLC | 62.432 | 33,25 | 2.657 | 42,24 | ||||
| 2026-01-29 | 13F | Sanctuary Advisors, LLC | 22.774 | 9,63 | 908 | 5,83 | ||||
| 2025-11-14 | 13F | Strategic Wealth Partners, Ltd. | 1.122 | 0,00 | 46 | 4,55 | ||||
| 2026-01-26 | 13F | Cwm, Llc | 26.198 | 44,32 | 1 | |||||
| 2026-02-03 | 13F | International Assets Investment Management, Llc | 450 | 18 | ||||||
| 2026-02-11 | 13F | Sunrise Financial Services, LLC | 2.186 | 87 | ||||||
| 2026-02-17 | 13F | Raymond James Financial Inc | 219.642 | -7,81 | 8.760 | -11,07 | ||||
| 2026-02-17 | 13F | Bank Of America Corp /de/ | 596.750 | -31,56 | 23.799 | -33,97 | ||||
| 2026-02-06 | 13F | EverSource Wealth Advisors, LLC | 165 | 0,00 | 7 | 0,00 | ||||
| 2026-01-29 | 13F | Dunhill Financial, LLC | 109 | 5,83 | 4 | 0,00 | ||||
| 2026-02-13 | 13F | Gts Securities Llc | 0 | -100,00 | 0 | |||||
| 2026-02-13 | 13F | Kestra Advisory Services, LLC | 0 | -100,00 | 0 | |||||
| 2025-11-14 | 13F | Wetherby Asset Management Inc | 15.408 | -1,91 | 637 | 1,60 | ||||
| 2026-02-03 | 13F | Heffernan Advisory, Inc | 88.457 | 3.528 | ||||||
| 2026-02-09 | 13F | Keating Financial Advisory Services, Inc. | 861 | 34 | ||||||
| 2026-04-15 | 13F | Wealthcare Capital Partners, LLC | 20.855 | 28,81 | 888 | 37,52 | ||||
| 2026-02-13 | 13F | Wells Fargo & Company/mn | 255.932 | 3,83 | 10.207 | 0,16 | ||||
| 2026-02-13 | 13F | Morgan Stanley | 1.051.881 | 1,15 | 41.951 | -2,42 | ||||
| 2026-04-21 | 13F | Pallas Capital Advisors LLC | 16.634 | -3,79 | 708 | 2,61 | ||||
| 2026-01-21 | 13F | Albion Financial Group /ut | 577 | -64,71 | 23 | -65,67 | ||||
| 2026-01-29 | 13F | Comerica Bank | 1.465 | 51,81 | 58 | 48,72 | ||||
| 2026-02-11 | 13F | O'shaughnessy Asset Management, Llc | 684 | 0,00 | 27 | -3,57 | ||||
| 2026-02-05 | 13F | Stephens Inc /ar/ | 13.970 | 1,27 | 557 | -2,28 | ||||
| 2026-02-05 | 13F | Cambridge Investment Research Advisors, Inc. | 34.488 | -9,02 | 1 | 0,00 | ||||
| 2026-02-17 | 13F | United Capital Financial Advisers, Llc | 12.549 | 500 | ||||||
| 2026-02-17 | 13F | Susquehanna International Group, Llp | 35.612 | 1.420 | ||||||
| 2026-02-12 | 13F | Principal Securities, Inc. | 0 | -100,00 | 0 | |||||
| 2026-02-13 | 13F | MAI Capital Management | 300 | 0,00 | 12 | -8,33 | ||||
| 2026-02-10 | 13F/A | Northwestern Mutual Wealth Management Co | 74.652 | -22,54 | 2.977 | -25,28 | ||||
| 2026-02-13 | 13F | Mariner, LLC | 17.356 | 5,88 | 692 | 2,22 | ||||
| 2026-02-12 | 13F | JT Stratford LLC | 49.143 | -2,93 | 1.960 | -6,36 | ||||
| 2026-02-17 | 13F | Private Advisor Group, LLC | 163.172 | 2,34 | 6.508 | -1,27 | ||||
| 2026-04-15 | 13F | LongView Wealth Management | 9.603 | 9,24 | 412 | 16,06 | ||||
| 2026-02-10 | 13F | Envestnet Asset Management Inc | 28.325 | -0,78 | 1.130 | -4,32 | ||||
| 2026-04-15 | 13F | Signature Estate & Investment Advisors Llc | 21.416 | 911 | ||||||
| 2026-02-17 | 13F | Pinnacle Financial Partners, Inc. | 9.338 | 372 | ||||||
| 2026-02-12 | 13F | SWAN Capital LLC | 274 | 0,00 | 11 | -9,09 | ||||
| 2026-02-13 | 13F | Citigroup Inc | 16.090 | -2,05 | 642 | -5,60 | ||||
| 2026-02-17 | 13F | Jones Financial Companies Lllp | 83.523 | 21,66 | 3.331 | 18,21 | ||||
| 2025-11-07 | 13F | Synovus Financial Corp | 9.338 | 0,00 | 386 | 3,76 | ||||
| 2026-02-13 | 13F | Mml Investors Services, Llc | 10.226 | -1,03 | 408 | -4,68 | ||||
| 2026-02-06 | 13F | Global Retirement Partners, LLC | 60 | -98,01 | 2 | -98,39 | ||||
| 2026-02-12 | 13F | Hrt Financial Lp | 0 | -100,00 | 0 | |||||
| 2026-04-08 | 13F | Wealth Enhancement Advisory Services, Llc | 7.660 | -12,92 | 327 | -7,10 | ||||
| 2026-02-04 | 13F | Ameritas Advisory Services, LLC | 0 | -100,00 | 0 | |||||
| 2026-02-17 | 13F | Advisor Group Holdings, Inc. | 46.889 | -42,69 | 1.871 | -44,48 | ||||
| 2026-02-17 | 13F | Wiley Bros.-aintree Capital, Llc | 8.269 | 49,34 | 330 | 44,30 | ||||
| 2026-02-12 | 13F | Triumph Capital Management | 200 | 0,00 | 8 | -12,50 | ||||
| 2026-02-11 | 13F | Franklin Resources Inc | 571 | 0,00 | 23 | -4,35 | ||||
| 2026-02-13 | 13F | SRS Capital Advisors, Inc. | 2.307 | -51,85 | 92 | -63,89 | ||||
| 2026-02-13 | 13F | Baird Financial Group, Inc. | 47.056 | 3,72 | 1.877 | 0,05 | ||||
| 2026-02-13 | 13F | Hurley Capital, LLC | 1.255 | 0,00 | 50 | -1,96 | ||||
| 2025-11-13 | 13F | Quadrature Capital Ltd | 0 | -100,00 | 0 | |||||
| 2026-01-29 | 13F | UBS Group AG | 410.291 | 1,90 | 16.363 | -1,69 | ||||
| 2026-02-20 | 13F | Sunbelt Securities, Inc. | 250 | 0,00 | 10 | -10,00 | ||||
| 2026-01-26 | 13F | Private Trust Co Na | 2.410 | -35,15 | 96 | -37,25 | ||||
| 2026-01-29 | 13F | Advantage Trust Co | 0 | -100,00 | 0 | |||||
| 2026-02-06 | 13F | Pnc Financial Services Group, Inc. | 10.928 | 27,72 | 436 | 23,23 | ||||
| 2026-02-13 | 13F | Integrated Wealth Concepts LLC | 19.486 | -0,17 | 777 | -3,60 | ||||
| 2026-02-18 | 13F | Alpha Capital Advisors Inc /adv | 11.253 | 458 | ||||||
| 2026-02-12 | 13F | Founders Financial Alliance, LLC | 83 | 3 | ||||||
| 2026-04-22 | 13F | Janney Montgomery Scott LLC | 39.518 | -9,14 | 2 | 0,00 | ||||
| 2026-04-22 | 13F | Sykon Capital Llc | 4.790 | -55,00 | 204 | -52,12 | ||||
| 2026-02-11 | 13F | Parallel Advisors, LLC | 168 | 0,00 | 7 | 0,00 | ||||
| 2026-02-17 | 13F | Optiver Holding B.V. | 0 | -100,00 | 0 | |||||
| 2026-02-17 | 13F | Ameriprise Financial Inc | 24.384 | -5,85 | 972 | -9,24 | ||||
| 2026-01-21 | 13F | Raleigh Capital Management Inc. | 344 | 14 | ||||||
| 2026-02-17 | 13F | VestGen Advisors, LLC | 0 | -100,00 | 0 | |||||
| 2026-04-07 | 13F | Farther Finance Advisors, LLC | 20.663 | 0,50 | 878 | 7,08 | ||||
| 2026-02-09 | 13F | Harbour Investments, Inc. | 3.470 | 0,35 | 138 | -2,82 | ||||
| 2026-04-08 | 13F | First Heartland Consultants, Inc. | 14.705 | 1,45 | 626 | 8,13 | ||||
| 2026-02-17 | 13F | Mercer Global Advisors Inc /adv | 0 | -100,00 | 0 | |||||
| 2026-01-27 | 13F | TD Waterhouse Canada Inc. | 7.453 | 4,54 | 297 | 1,02 | ||||
| 2026-02-13 | 13F | Intrepid Financial Planning Group LLC | 6.054 | 0,00 | 241 | -3,60 | ||||
| 2026-02-13 | 13F | Planwiser Financial, Llc | 61.874 | 2.468 | ||||||
| 2026-04-06 | 13F | CX Institutional | 25.999 | -0,99 | 1 | 0,00 | ||||
| 2026-02-13 | 13F | Transamerica Financial Advisors, Inc. | 2 | -33,33 | 0 | |||||
| 2026-04-14 | 13F | Prospera Financial Services Inc | 16.440 | 15,30 | 700 | 23,06 | ||||
| 2026-02-10 | 13F | Goldman Sachs Group Inc | 56.350 | -54,54 | 2.247 | -56,15 | ||||
| 2026-02-05 | 13F | Atria Investments Llc | 8.216 | 23,22 | 328 | 18,91 | ||||
| 2026-04-24 | 13F | Key FInancial Inc | 2.600 | 0,00 | 111 | 6,80 | ||||
| 2026-02-17 | 13F | Russell Investments Group, Ltd. | 14 | 1 | ||||||
| 2026-04-14 | 13F | Thurston, Springer, Miller, Herd & Titak, Inc. | 152 | 1,33 | 6 | 0,00 | ||||
| 2026-03-13 | 13F/A | Pensionmark Financial Group, Llc | 6.012 | 240 | ||||||
| 2026-01-26 | 13F | Wbh Advisory Inc | 12.021 | 0,00 | 479 | -3,43 | ||||
| 2026-02-13 | 13F | Sovereign Investment Advisors, LLC | 151.971 | 0,85 | 6.115 | -1,85 | ||||
| 2026-02-18 | 13F | GWM Advisors LLC | 10.597 | 2,49 | 423 | -1,17 | ||||
| 2026-02-12 | 13F | Financial Engines Advisors L.L.C. | 999.974 | -2,33 | 39.881 | -5,78 | ||||
| 2026-02-17 | 13F | Cetera Investment Advisers | 169.189 | 2,27 | 6.748 | -1,35 | ||||
| 2026-04-14 | 13F | Wealthcare Advisory Partners LLC | 62.759 | -1,27 | 2.671 | 5,36 | ||||
| 2026-01-23 | 13F | Natural Investments, Llc | 0 | -100,00 | 0 | |||||
| 2026-01-20 | 13F | Nvwm, Llc | 686 | -95,63 | 27 | -95,84 | ||||
| 2026-02-12 | 13F | CIBC Private Wealth Group, LLC | 482 | 0,00 | 19 | 0,00 | ||||
| 2026-04-10 | 13F | Centurion Wealth Management LLC | 23.826 | -39,58 | 1.014 | -35,50 | ||||
| 2026-04-13 | 13F | IFP Advisors, Inc | 16 | 1 | ||||||
| 2026-02-17 | 13F | Royal Bank Of Canada | 165.038 | -4,68 | 6.582 | -8,03 | ||||
| 2026-02-13 | 13F | Arkadios Wealth Advisors | 12.583 | 0,78 | 502 | -2,91 | ||||
| 2026-02-13 | 13F | Stifel Financial Corp | 40.360 | 0,73 | 1.610 | -2,84 | ||||
| 2026-02-17 | 13F | Fmr Llc | 1.682 | -5,98 | 67 | -8,22 | ||||
| 2026-01-21 | 13F | Westfuller Advisors, LLC | 676 | 0,90 | 27 | 0,00 | ||||
| 2026-02-12 | 13F | Steward Partners Investment Advisory, Llc | 1.250 | 0,00 | 50 | -3,92 | ||||
| 2026-02-11 | 13F | Jpmorgan Chase & Co | 31.391 | 5,24 | 1.252 | 1,46 | ||||
| 2026-02-13 | 13F | Ubs Asset Management Americas Inc | 213 | 8 | ||||||
| 2026-02-14 | 13F | Rockefeller Capital Management L.P. | 1.278 | -13,88 | 51 | -18,03 | ||||
| 2026-02-12 | 13F | Commonwealth Equity Services, Llc | 181.320 | -1,36 | 7.231 | 103.200,00 | ||||
| 2026-02-11 | 13F | LPL Financial LLC | 747.791 | -9,98 | 29.823 | -13,16 | ||||
| 2026-01-20 | 13F | Stratos Wealth Partners, LTD. | 6.531 | 0,00 | 260 | -3,35 | ||||
| 2026-01-21 | 13F | Flagship Harbor Advisors, Llc | 3.936 | 157 | ||||||
| 2026-01-29 | 13F | Concurrent Investment Advisors, LLC | 7.866 | -9,42 | 314 | -12,57 | ||||
| 2026-02-10 | 13F | IFG Advisory, LLC | 67.441 | 5,43 | 2.690 | 1,70 | ||||
| 2026-04-16 | 13F | XML Financial, LLC | 38.845 | -13,39 | 1.653 | -7,55 | ||||
| 2026-02-12 | 13F | Federation des caisses Desjardins du Quebec | 880 | 0,00 | 35 | -2,78 | ||||
| 2026-04-14 | 13F | Nbc Securities, Inc. | 1.000 | 0,00 | 43 | 7,69 | ||||
| 2026-02-13 | 13F | Perspective Wealth Advisors Llc | 61.874 | 2.468 | ||||||
| 2026-02-13 | 13F | Mill Creek Capital Advisors, LLC | 6.951 | -14,46 | 277 | -17,31 | ||||
| 2026-02-05 | 13F | Allworth Financial LP | 93.478 | -5,29 | 3.728 | -8,63 | ||||
| 2025-11-18 | 13F | Apexium Financial, Lp | 13.466 | -3,73 | 557 | -0,18 | ||||
| 2026-04-03 | 13F | Investors Research Corp | 5.075 | 2,65 | 216 | 9,14 | ||||
| 2026-04-21 | 13F | Sequent Planning LLC | 170.030 | 4,49 | 7.236 | 11,51 | ||||
| 2026-02-12 | 13F | Sepio Capital, LP | 7.569 | 0,00 | 302 | -3,53 | ||||
| 2026-02-04 | 13F | Anson Capital, Inc. | 31.795 | 1.268 | ||||||
| 2026-02-17 | 13F | North Capital, Inc. | 0 | -100,00 | 0 | |||||
| 2026-01-26 | 13F | AE Wealth Management LLC | 3.842 | -6,11 | 153 | -9,47 | ||||
| 2026-02-12 | 13F | Wealthspire Advisors, LLC | 0 | -100,00 | 0 |