Grundlæggende statistik
| Institutionelle ejere | 65 total, 63 long only, 0 short only, 2 long/short - change of -25,29% MRQ |
| Gennemsnitlig porteføljeallokering | 0.3812 % - change of 62,16% MRQ |
| Institutionelle aktier (lange) | 22.426.218 (ex 13D/G) - change of -5,84MM shares -20,66% MRQ |
| Institutionel værdi (lang) | $ 286.757 USD ($1000) |
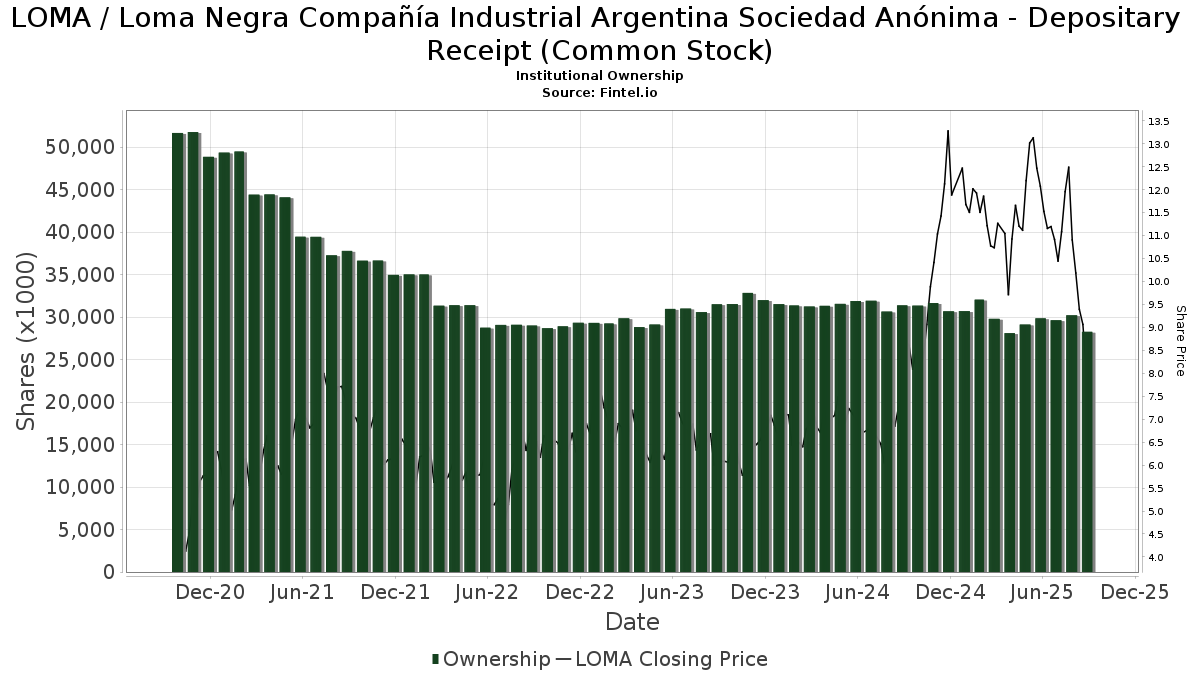
Institutionelt ejerskab og aktionærer
Loma Negra Compañía Industrial Argentina Sociedad Anónima - Depositary Receipt (Common Stock) (US:LOMA) har 65 institutionelle ejere og aktionærer, der har indsendt 13D/G- eller 13F-formularer til Securities Exchange Commission (SEC). Disse institutioner har i alt 22,426,218 aktier. Største aktionærer omfatter Capital International Investors, Fourth Sail Capital LP, RWC Asset Management LLP, Ancient Art, L.P., ARGT - Global X MSCI Argentina ETF, MIRAE ASSET GLOBAL ETFS HOLDINGS Ltd., PointState Capital LP, Standard Life Aberdeen plc, Fundamenta Capital S.A., and M&G Plc .
Loma Negra Compañía Industrial Argentina Sociedad Anónima - Depositary Receipt (Common Stock) (NYSE:LOMA) institutionel ejerskabsstruktur viser aktuelle positioner i virksomheden efter institutioner og fonde, samt seneste ændringer i positionsstørrelse. Større aktionærer kan omfatte individuelle investorer, investeringsforeninger, hedgefonde eller institutioner. Skema 13D angiver, at investoren besidder (eller besidder) mere end 5 % af virksomheden og har til hensigt (eller har til hensigt at) aktivt at forfølge en ændring i forretningsstrategi. Skema 13G indikerer en passiv investering på over 5%.
The share price as of March 27, 2026 is 10,01 / share. Previously, on March 31, 2025, the share price was 10,99 / share. This represents a decline of 8,92% over that period.
Fondens stemningsscore
Fund Sentiment Score (fka Ownership Accumulation Score) finder de aktier, der bliver mest købt af fonde. Det er resultatet af en sofistikeret, multi-faktor kvantitativ model, der identificerer virksomheder med de højeste niveauer af institutionel akkumulering. Scoringsmodellen bruger en kombination af den samlede stigning i oplyste ejere, ændringerne i porteføljeallokeringer i disse ejere og andre målinger. Tallet går fra 0 til 100, hvor højere tal indikerer et højere niveau af akkumulering for sine jævnaldrende, og 50 er gennemsnittet.
Opdateringsfrekvens: Dagligt
Se Ownership Explorer, som giver en liste over højest rangerende virksomheder.
AI+ Ask Fintel’s AI assistant about Loma Negra Compañía Industrial Argentina Sociedad Anónima - Depositary Receipt (Common Stock).
Select a question to share a public post with an AI-crafted answer.
Thinking of good questions…
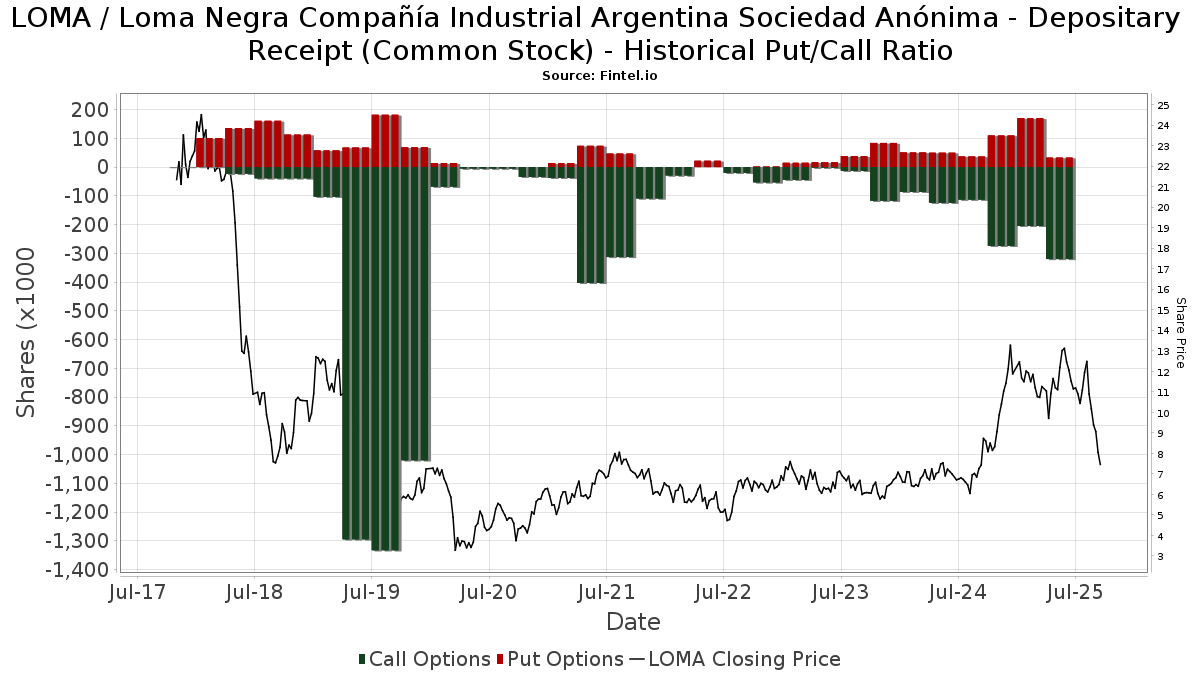
Institutionel Put/Call-forhold
Ud over at indberette standardaktie- og gældsudstedelser skal institutter med mere end 100 mill. aktiver under forvaltning også oplyse deres put- og call-optionsbeholdninger. Da salgsoptioner generelt indikerer negativ stemning, og købsoptioner indikerer positiv stemning, kan vi få en fornemmelse af den overordnede institutionelle stemning ved at plotte forholdet mellem put og kald. Diagrammet til højre viser det historiske put/call-forhold for dette instrument.
Brug af Put/Call Ratio som en indikator for investorernes stemning overvinder en af de vigtigste mangler ved at bruge totalt institutionelt ejerskab, som er, at en betydelig mængde af aktiver under forvaltning investeres passivt for at spore indekser. Passivt forvaltede fonde køber typisk ikke optioner, så indikatoren for put/call-forholdet følger mere nøje følelsen af aktivt forvaltede fonde.
13F og NPORT arkivering
Detaljer om 13F-arkivering er gratis. Detaljer om NP-ansøgninger kræver et premium-medlemskab. Grønne rækker angiver nye positioner. Røde rækker angiver lukkede positioner. Klik på linket ikon for at se den fulde transaktionshistorik.
Opgrader
for at låse premium-data op og eksportere til Excel ![]() .
.
| Fil dato | Kilde | Investor | Type | Gennemsnitlig pris (Øst) |
Aktier | Δ Aktier (%) |
Rapporteret Værdi ($1000) |
Δ Værdi (%) |
Port Alloc (%) |
|
|---|---|---|---|---|---|---|---|---|---|---|
| 2026-01-29 | 13F | Pictet Asset Management Holding SA | 47.821 | 619 | ||||||
| 2026-02-10 | 13F | Goldman Sachs Group Inc | 281.844 | 169,39 | 3.650 | 373,28 | ||||
| 2026-02-17 | 13F | Highland Capital Management Fund Advisors, L.p. | 0 | -100,00 | 0 | -100,00 | ||||
| 2026-01-28 | 13F | Kapitalo Investimentos Ltda | 380.833 | -1,27 | 4.932 | 73,50 | ||||
| 2025-11-21 | 13F/A | Royal Bank Of Canada | 0 | -100,00 | 0 | -100,00 | ||||
| 2026-02-02 | 13F | Advisors Preferred, LLC | 0 | -100,00 | 0 | |||||
| 2026-02-12 | 13F | M&G Plc | 954.292 | 11,92 | 12.406 | 107,86 | ||||
| 2026-02-17 | 13F | Citadel Advisors Llc | 0 | -100,00 | 0 | |||||
| 2025-11-14 | 13F | Raymond James Financial Inc | 0 | -100,00 | 0 | |||||
| 2026-02-17 | 13F | Citadel Advisors Llc | Put | 0 | -100,00 | 0 | ||||
| 2026-02-17 | 13F | Balyasny Asset Management Llc | 131.767 | -45,15 | 1.706 | -3,62 | ||||
| 2025-11-14 | 13F | Nbc Securities, Inc. | 0 | -100,00 | 0 | |||||
| 2026-01-23 | 13F | Farther Finance Advisors, LLC | 64 | 0,00 | 1 | |||||
| 2026-02-17 | 13F | Tower Research Capital LLC (TRC) | 0 | -100,00 | 0 | |||||
| 2026-02-13 | 13F | Fourth Sail Capital LP | 2.404.072 | 1,36 | 31.133 | 78,09 | ||||
| 2026-02-13 | 13F | Itau Unibanco Holding S.A. | 190.920 | 2.427 | ||||||
| 2026-02-17 | 13F | Mirabella Financial Services Llp | 73.847 | 956 | ||||||
| 2026-02-05 | 13F | Helikon Investments Ltd | 0 | -100,00 | 0 | -100,00 | ||||
| 2026-02-02 | 13F | Fifth Third Bancorp | 0 | -100,00 | 0 | |||||
| 2026-01-12 | 13F | Systrade AG | 250.000 | -34,72 | 3.238 | 14,71 | ||||
| 2026-02-10 | 13F | State of Wyoming | 43.111 | 1,34 | 558 | 78,27 | ||||
| 2026-02-13 | 13F | Resources Investment Advisors, LLC. | 57.279 | -3,13 | 742 | 70,34 | ||||
| 2026-02-02 | 13F | Ping Capital Management, Inc. | 91.300 | -39,54 | 1.182 | 6,29 | ||||
| 2026-02-13 | 13F | Aigen Investment Management, Lp | 0 | -100,00 | 0 | |||||
| 2026-02-17 | 13F | D. E. Shaw & Co., Inc. | 139.176 | -79,61 | 1.802 | -64,17 | ||||
| 2026-02-13 | 13F | Walleye Capital LLC | 0 | -100,00 | 0 | |||||
| 2026-02-17 | 13F | Advisor Group Holdings, Inc. | 144 | 39,81 | 2 | |||||
| 2026-01-30 | 13F | Activest Wealth Management | 136.677 | -8,25 | 1.770 | 61,26 | ||||
| 2026-02-17 | 13F | Susquehanna International Group, Llp | Call | 69.800 | 16,53 | 904 | 104,76 | |||
| 2026-02-17 | 13F | Ancient Art, L.P. | 1.435.809 | 0,00 | 18.594 | 75,72 | ||||
| 2026-02-17 | 13F | Susquehanna International Group, Llp | 16.796 | 218 | ||||||
| 2026-02-17 | 13F | Citadel Advisors Llc | Call | 40.700 | 20,77 | 527 | 112,50 | |||
| 2026-02-17 | 13F | Millennium Management Llc | 0 | -100,00 | 0 | |||||
| 2026-02-17 | 13F | XTX Topco Ltd | 0 | -100,00 | 0 | |||||
| 2026-02-13 | 13F | Verition Fund Management LLC | 0 | -100,00 | 0 | |||||
| 2026-02-11 | 13F | Capital International Investors | 4.668.387 | 0,45 | 60.456 | 76,50 | ||||
| 2026-02-11 | 13F | Jpmorgan Chase & Co | 5.098 | -96,12 | 66 | -93,17 | ||||
| 2026-02-17 | 13F | State Of Wisconsin Investment Board | 37.553 | 486 | ||||||
| 2026-02-17 | 13F | PointState Capital LP | 1.130.732 | 245,32 | 14.643 | 506,80 | ||||
| 2026-02-17 | 13F | Point72 Asset Management, L.P. | 0 | -100,00 | 0 | |||||
| 2026-02-13 | 13F | Van Eck Associates Corp | 8.030 | 107,65 | 0 | |||||
| 2026-02-17 | 13F | Long Focus Capital Management, Llc | 377.600 | 0,00 | 4.890 | 75,74 | ||||
| 2026-02-17 | 13F | Qube Research & Technologies Ltd | 0 | -100,00 | 0 | |||||
| 2026-01-08 | 13F | Chesapeake Asset Management Llc | 25.806 | 0,00 | 334 | 75,79 | ||||
| 2026-01-16 | 13F | Standard Life Aberdeen plc | 1.019.991 | -15,08 | 13.209 | 46,04 | ||||
| 2026-02-17 | 13F | Russell Investments Group, Ltd. | 25.196 | 0,00 | 326 | 76,22 | ||||
| 2026-02-11 | 13F | Simplex Trading, Llc | 0 | -100,00 | 0 | |||||
| 2025-11-14 | 13F | Susquehanna International Group, Llp | Put | 0 | -100,00 | 0 | -100,00 | |||
| 2025-11-14 | 13F | Voloridge Investment Management, Llc | 0 | -100,00 | 0 | |||||
| 2025-11-10 | 13F | Options Solutions, Llc | 0 | -100,00 | 0 | |||||
| 2026-02-13 | 13F | Dodge & Cox | 43.482 | 19,46 | 563 | 110,07 | ||||
| 2026-01-27 | 13F | Fundamenta Capital S.A. | 1.010.586 | 13.087 | ||||||
| 2025-11-12 | 13F | Polen Capital Management Llc | 0 | -100,00 | 0 | |||||
| 2026-02-13 | 13F | Wells Fargo & Company/mn | 1.009 | 0,00 | 13 | 85,71 | ||||
| 2026-02-04 | 13F | Hosking Partners LLP | 642.012 | -1,17 | 8.314 | 73,68 | ||||
| 2026-02-13 | 13F | Barclays Plc | 0 | -100,00 | 0 | |||||
| 2026-02-17 | 13F | Engineers Gate Manager LP | 0 | -100,00 | 0 | |||||
| 2026-02-13 | 13F | Morgan Stanley | 481.978 | -56,81 | 6.242 | -24,10 | ||||
| 2026-02-17 | 13F | Schonfeld Strategic Advisors LLC | 35.581 | 461 | ||||||
| 2026-01-29 | 13F | UBS Group AG | 194.838 | 71,68 | 2.523 | 201,79 | ||||
| 2026-02-13 | 13F | Caitong International Asset Management Co., Ltd | 282 | 9.300,00 | 4 | |||||
| 2025-11-04 | 13F | INCA Investments LLC | 0 | -100,00 | 0 | |||||
| 2025-11-14 | 13F | Cubist Systematic Strategies, LLC | 91.064 | 72,24 | 671 | 15,89 | ||||
| 2026-02-17 | 13F | Two Sigma Investments, Lp | 0 | -100,00 | 0 | |||||
| 2026-02-02 | 13F | Truist Financial Corp | 14.548 | -50,76 | 188 | -13,36 | ||||
| 2025-11-12 | 13F | William Blair Investment Management, Llc | 0 | -100,00 | 0 | |||||
| 2026-01-23 | 13F | Clear Creek Financial Management, LLC | 30.045 | 1,35 | 389 | 78,44 | ||||
| 2026-02-12 | 13F | Jane Street Group, Llc | Call | 28.800 | 373 | |||||
| 2026-02-11 | 13F | Simplex Trading, Llc | Put | 14.200 | 184 | |||||
| 2026-02-12 | 13F | Insigneo Advisory Services, Llc | 0 | -100,00 | 0 | |||||
| 2026-02-11 | 13F | Simplex Trading, Llc | Call | 16.700 | 216 | |||||
| 2025-10-31 | 13F | Y-Intercept (Hong Kong) Ltd | 0 | -100,00 | 0 | -100,00 | ||||
| 2026-02-06 | 13F | Pnc Financial Services Group, Inc. | 57 | 1.800,00 | 1 | |||||
| 2025-11-14 | 13F | Mak Capital One Llc | 0 | -100,00 | 0 | -100,00 | ||||
| 2026-02-17 | 13F | Rwc Asset Advisors (us) Llc | 144.315 | 0,00 | 1.869 | 75,73 | ||||
| 2026-02-11 | 13F | Group One Trading, L.p. | Put | 1.900 | -5,00 | 25 | 71,43 | |||
| 2026-02-11 | 13F | Group One Trading, L.p. | Call | 37.300 | -56,73 | 483 | -23,94 | |||
| 2026-02-17 | 13F | Bank Of America Corp /de/ | 17.761 | -88,54 | 230 | -79,86 | ||||
| 2026-02-13 | 13F | Arrowstreet Capital, Limited Partnership | 0 | -100,00 | 0 | |||||
| 2026-02-11 | 13F | Group One Trading, L.p. | 4.083 | 53 | ||||||
| 2026-02-12 | 13F | North of South Capital LLP | 120.000 | 1.554 | ||||||
| 2026-02-11 | 13F | RWC Asset Management LLP | 1.965.612 | 36,84 | 25.455 | 140,45 | ||||
| 2026-02-13 | 13F | Absolute Gestao de Investimentos Ltda. | 85.426 | 1.106 | ||||||
| 2026-02-12 | 13F | Jane Street Group, Llc | 0 | -100,00 | 0 | -100,00 | ||||
| 2026-01-09 | 13F | Crocodile Capital Partners GmbH | 99.736 | 0,00 | 1.292 | 75,65 | ||||
| 2025-10-28 | 13F | Evolution Wealth Advisors, LLC | 0 | -100,00 | 0 | |||||
| 2025-11-13 | 13F | Bnp Paribas Arbitrage, Sa | 0 | -100,00 | 0 | -100,00 | ||||
| 2026-01-30 | 13F | Glenorchy Capital Ltd | 409.870 | -2,06 | 5.308 | 72,08 | ||||
| 2026-02-17 | 13F | Moneda S.A. Administradora General de Fondos | 185.608 | 0,00 | 2.404 | 18,03 | ||||
| 2025-09-29 | NP | ARGT - Global X MSCI Argentina ETF This fund is a listed as child fund of Mirae Asset Global Investments Co., Ltd. and if that institution has disclosed ownership in this security, then these positions will not be double counted when calculating total shares and total value | 1.375.328 | -9,18 | 16.009 | -5,61 | ||||
| 2026-02-17 | 13F | Crawford Fund Management, LLC | Call | 0 | -100,00 | 0 | ||||
| 2026-02-13 | 13F | Banco Santander, S.A. | 11.316 | -17,04 | 147 | 46,00 | ||||
| 2026-02-17 | 13F | Jump Financial, LLC | 14.280 | -82,07 | 185 | -68,60 | ||||
| 2026-02-17 | 13F | Mangrove Partners | 15.557 | 201 | ||||||
| 2026-02-04 | 13F | LRI Investments, LLC | 550 | 0,00 | 7 | 75,00 | ||||
| 2026-02-10 | 13F | Savant Capital, LLC | 13.932 | 180 | ||||||
| 2025-10-23 | 13F | SG Americas Securities, LLC | 0 | -100,00 | 0 | |||||
| 2026-02-17 | 13F | MIRAE ASSET GLOBAL ETFS HOLDINGS Ltd. | 1.145.765 | 2,62 | 14.838 | 80,32 | ||||
| 2026-02-06 | 13F | EverSource Wealth Advisors, LLC | 218 | -41,87 | 3 | 0,00 | ||||
| 2026-02-18 | 13F | SkyView Investment Advisors, LLC | 94.170 | -1,47 | 1 | |||||
| 2025-11-14 | 13F | Two Sigma Advisers, Lp | 0 | -100,00 | 0 | |||||
| 2026-02-17 | 13F | Graham Capital Management, L.P. | 35.497 | -7,75 | 460 | 62,19 | ||||
| 2026-01-30 | 13F | ABS Direct Equity Fund LLC | 103.990 | 1.347 | ||||||
| 2025-11-13 | 13F | Sagil Capital Llp | 0 | -100,00 | 0 | |||||
| 2025-11-14 | 13F | Ancora Advisors, LLC | 0 | -100,00 | 0 | |||||
| 2026-01-05 | 13F | GAMMA Investing LLC | 2.850 | -23,41 | 37 | 33,33 | ||||
| 2026-02-13 | 13F | Citigroup Inc | 100.573 | 1.302 | ||||||
| 2026-02-03 | 13F | SBI Securities Co., Ltd. | 154 | 0,00 | 2 | 0,00 |
Other Listings
| DE:8LN | 8,65 € |